Two Federal Reserve officials made the case for more tightening this week. Gold still edged up to around $4,130 an ounce on Thursday, 8 October 2026. For any gold price analysis built on the rule that hawkish Fed talk sinks bullion, that is an awkward result.
Money markets price roughly 81% odds of a 25 basis point hike in December. Yet gold held above $4,100 after sliding to a two-month low in Wednesday’s session.
If you read gold only through the Fed, you risk selling into a move the market has already priced, or missing the forces doing the real lifting. Here is what is offsetting the Fed’s hawkishness, and which price levels decide whether this bounce holds.
Why did gold rise on a day the Fed sounded hawkish?
The remarks were clearly hawkish. St. Louis Fed President Alberto Musalem said inflation remains elevated and that a strong labour market means the Fed should put fighting it first. Governor Christopher Waller said more hikes are possible but need not come back-to-back, which effectively took October off the table.
That second point carries the weight. By ruling out consecutive moves, Waller confirmed what traders had already concluded: October is unlikely, and December is the live meeting.
Market pricing Money markets put the probability of a 25 bp hike in December at about 81%, while odds of a move at the 27-28 October meeting remain low.
With December already close to fully priced, the officials added little new information. The day’s real movement came elsewhere. US Treasury yields declined and the dollar softened, two of gold’s main headwinds easing at once.
The price readings show the slide and the bounce. Note that the Thursday figures come from different times of day.
| Date | Spot gold | Source | Context |
|---|---|---|---|
| 5 October 2026 | $4,158.17 | Reuters | Steady as a stronger dollar and high yields offset gains |
| 6 October 2026 | $4,128.69 | Reuters | Losses limited by fading October hike expectations |
| 8 October 2026 | $4,116.67 (0625 GMT); near $4,130 later | Reuters; FXStreet | Up about 0.48% after a low near $4,103 |
Labour data added little pressure either way. Initial jobless claims came in at 197K against a 200K forecast, consistent with a low-hire, low-fire market. Exact 10-year yield and Dollar Index levels for the day were not available.
What this tells you is that gold responds to changes in expected policy, not to hawkish language the market has already absorbed. A hawkish headline is not automatically a sell signal.
The same pattern appeared in 2022-2023, when gold fell as much as 20% despite 9.1% inflation and active conflict, which is why simple rules about gold tend to break down exactly when investors lean on them most.
When big ASX news breaks, our subscribers know first
How Middle East tensions and energy prices keep gold supported
Falling yields explain Thursday’s margin. The steadier support comes from the Middle East. Explosions near the Strait of Hormuz pushed West Texas Intermediate (WTI) crude, the US oil benchmark, up more than 4% at one point before it settled around $90.85, still up over 2%.
The link to gold runs through inflation:
- Geopolitical tension threatens energy supply routes.
- Oil prices rise on the risk of disruption.
- Higher energy costs lift inflation and yield expectations; they have already pushed global bond yields to multi-year peaks.
- Investors and central banks hold more gold as a hedge against inflation, growth and currency risk.
That final step explains why gold can hold firm even when yields are high. The World Gold Council (WGC) points to “persistent economic and geopolitical uncertainty” as a driver of demand, while Equiti describes gold as a “strategic reserve asset.”
Why headline risk cuts both ways
Some of WTI’s gains faded after President Trump said the US would not strike Iran before the midterm elections. An Axios report then cited US and Israeli officials saying Iranian leaders distrust that statement and want to avoid another surprise attack.
The tension remains unresolved. That makes the support persistent but headline-dependent: a credible de-escalation could pull oil and gold lower together.
Here is the uncomfortable part. Energy-driven inflation feeds both the hawkish Fed and the gold bid, so you should not expect the two to move in opposite directions every time. Traders are also watching the University of Michigan’s October consumer sentiment survey for clues on inflation expectations.
The oil-to-inflation transmission chain cuts both ways: the World Bank recorded a 12.1% surge in energy prices alongside a 2.7% fall in precious metals in April 2026, because higher oil can delay rate cuts and lift real yields.
What drives gold prices? A short primer
Most investors know the basic rule: rates up, gold down. Gold pays no interest or dividend, so when Treasuries offer a higher return, holding gold costs more in income you give up. Lower rates shrink that cost.
That rule is only one of four drivers. Gold also tends to move inversely to the dollar, because a stronger dollar makes gold more expensive for overseas buyers. It often rises when Treasuries and equities fall, and fear of war or recession lifts it as a safe haven.
The fourth driver is central banks, which can override the rate relationship entirely. According to the WGC, central banks added 1,136 tonnes (about $70 billion) in 2022, the largest annual purchase on record, even as rates climbed. Emerging-market buyers such as China, India and Turkey have been adding rapidly.
A plain example: if yields rise but a central bank buys hundreds of tonnes that quarter, gold can still climb. The buyer is not chasing yield; it is diversifying reserves.
| Driver | Typical effect on gold | Status this week |
|---|---|---|
| Interest rates and yields | Higher rates weigh on gold | Fed hawkish, but Treasury yields eased on Thursday |
| US dollar | Stronger dollar restrains gold | Firm early in the week, softer on Thursday |
| Geopolitical fear | Raises safe-haven demand | Hormuz tensions unresolved |
| Central-bank demand | Structural buying supports prices | Elevated versus pre-2022 levels |
When you see gold move, ask which of these four is dominant that day. This week it was not the Fed.
Record central-bank demand and the technical levels that decide what happens next
The demand floor
The structural case is strong. WGC data show total 2025 demand reached 5,002t, a record, alongside 53 all-time price highs. US demand more than doubled to 679t, and central banks bought 863t.
Buying has continued in 2026. Second-quarter central-bank purchases hit 288.9t, a record for a Q2 and up about 62% year-on-year, according to an EBC summary of a WGC survey. In the same survey, 74% of respondents expect the dollar’s share of reserves to fall over five years.
Central-bank sentiment 95% of surveyed central banks expect global gold reserves to rise over the coming year, and none expect a decline.
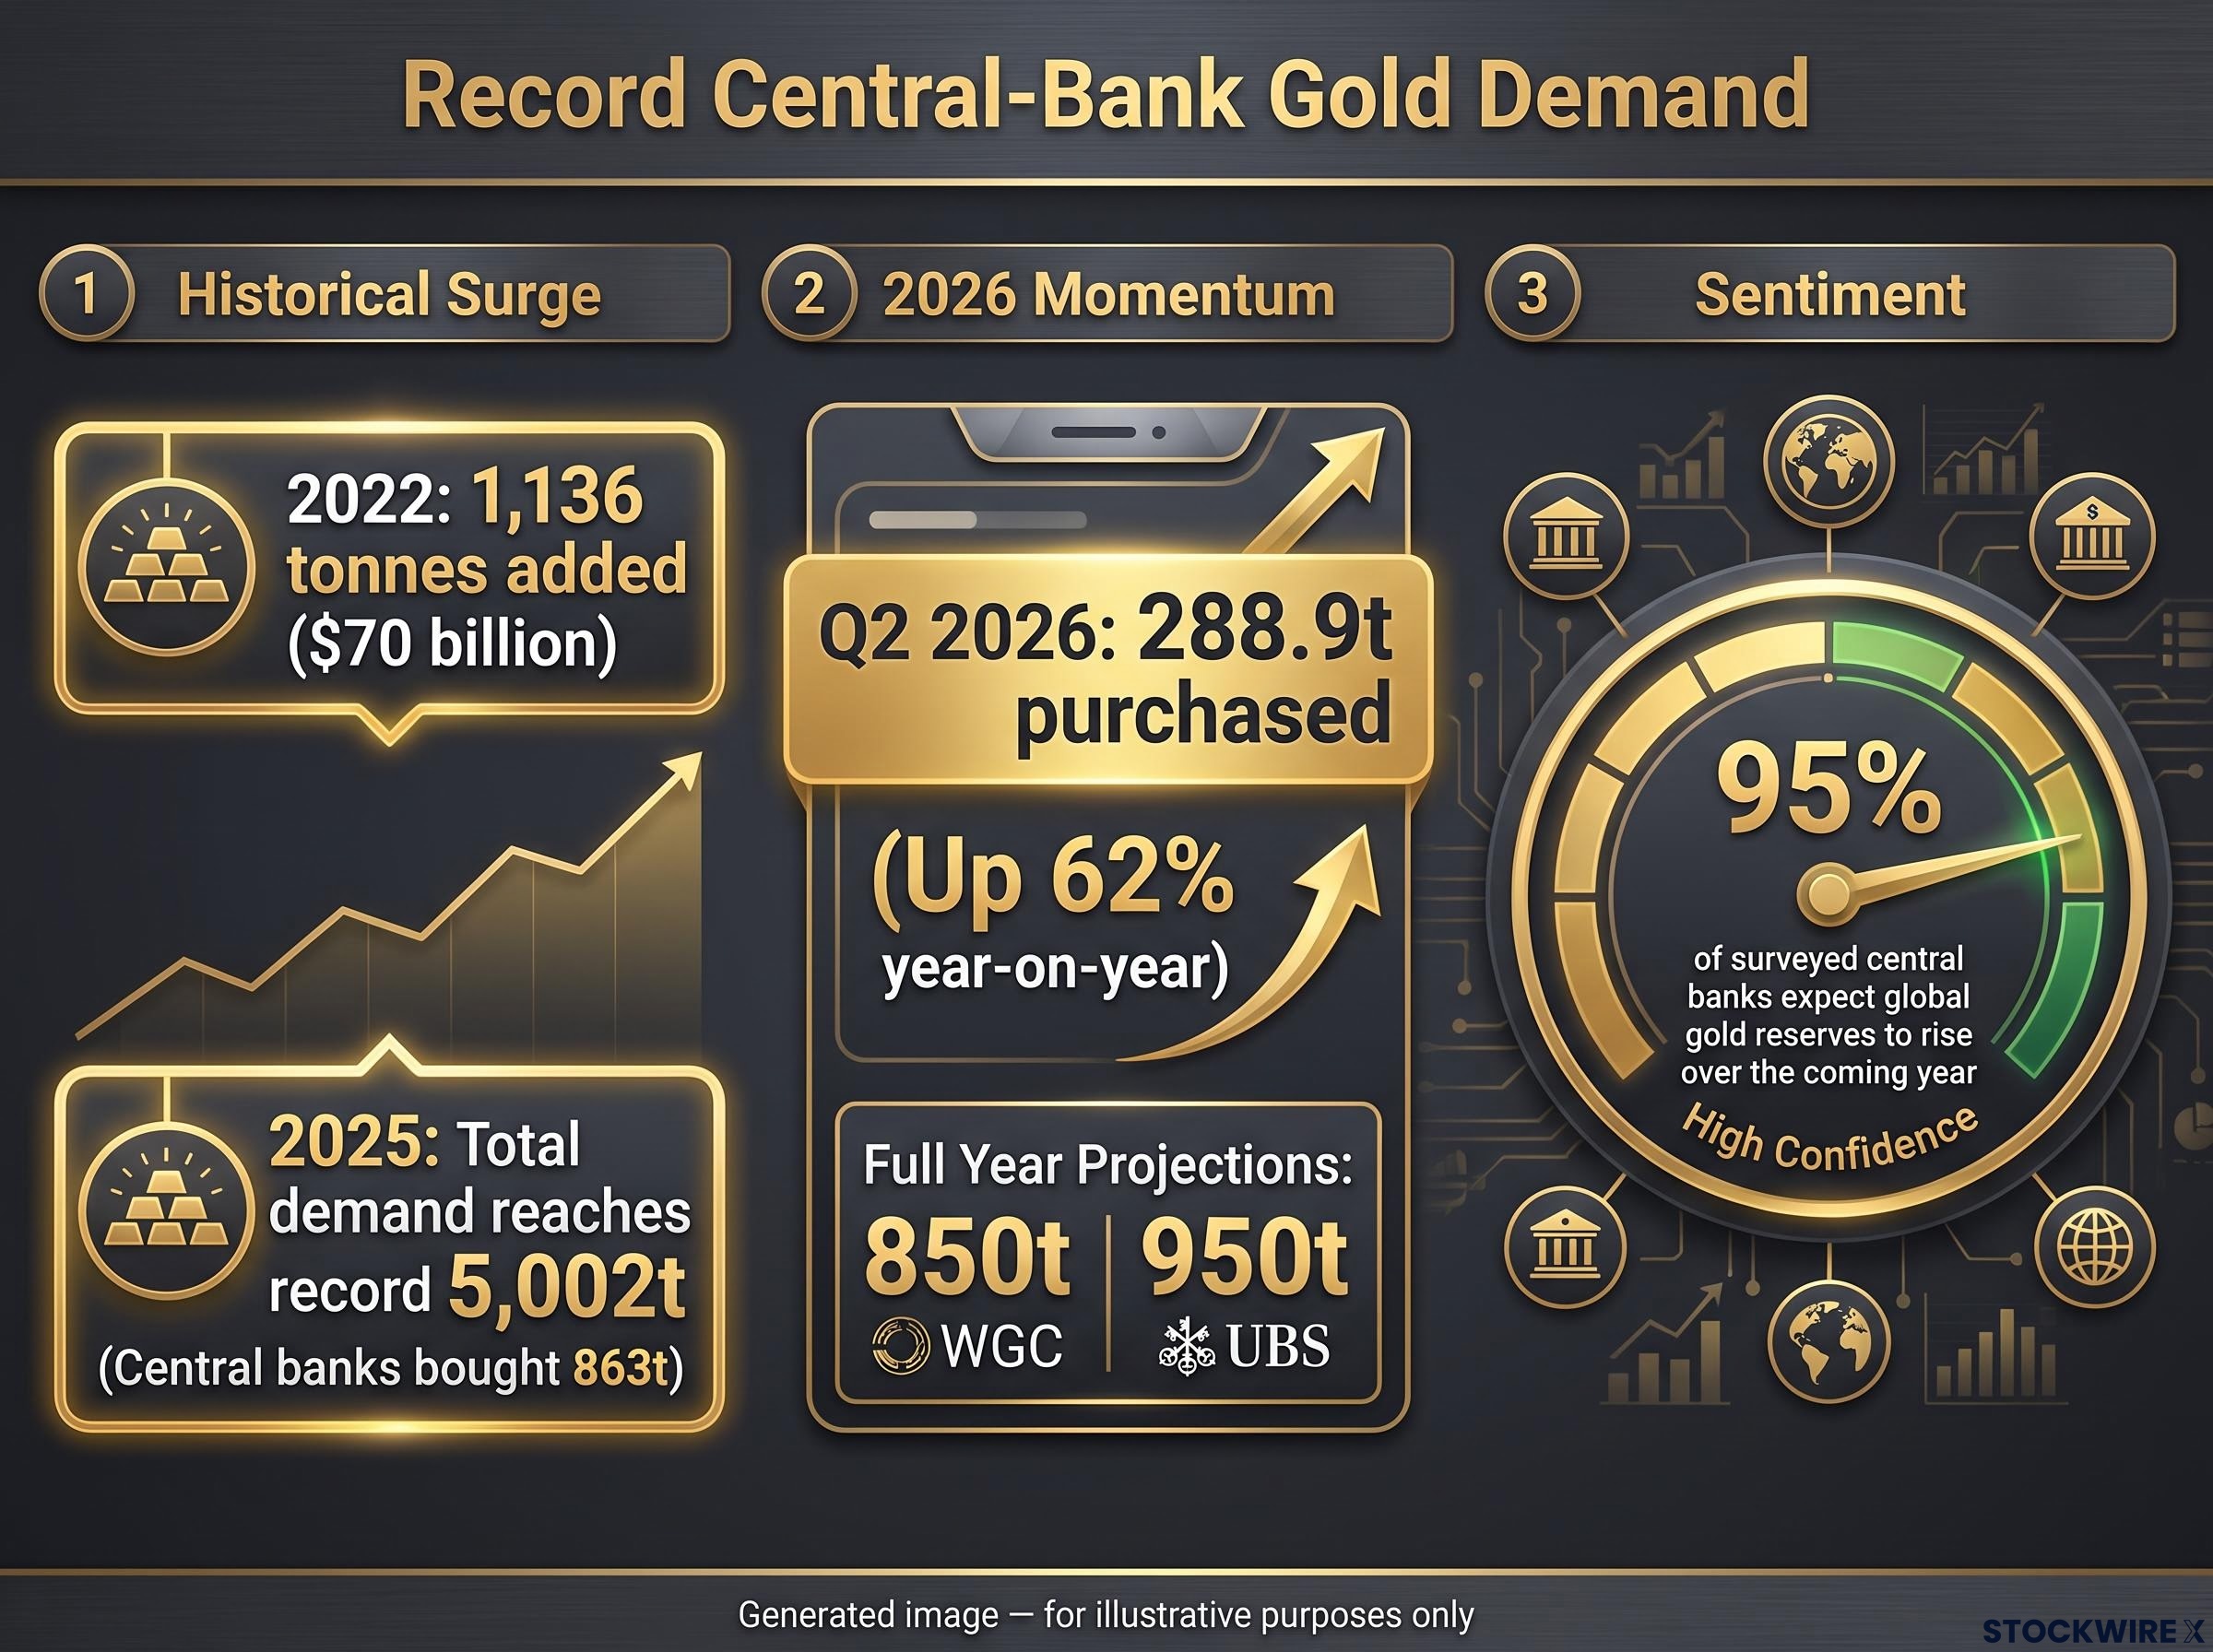
There are caveats. Net central-bank demand in H1 2026 was 345t, the lowest first half since 2022. The WGC expects about 850t for the full year, while UBS projects around 950t, and the WGC expects record prices to dent jewellery demand.
The closest analogue is 2022-2025, when central banks bought more than 1,000t a year during aggressive tightening. No explicit comparison with earlier cycles was found.
The chart: what to watch
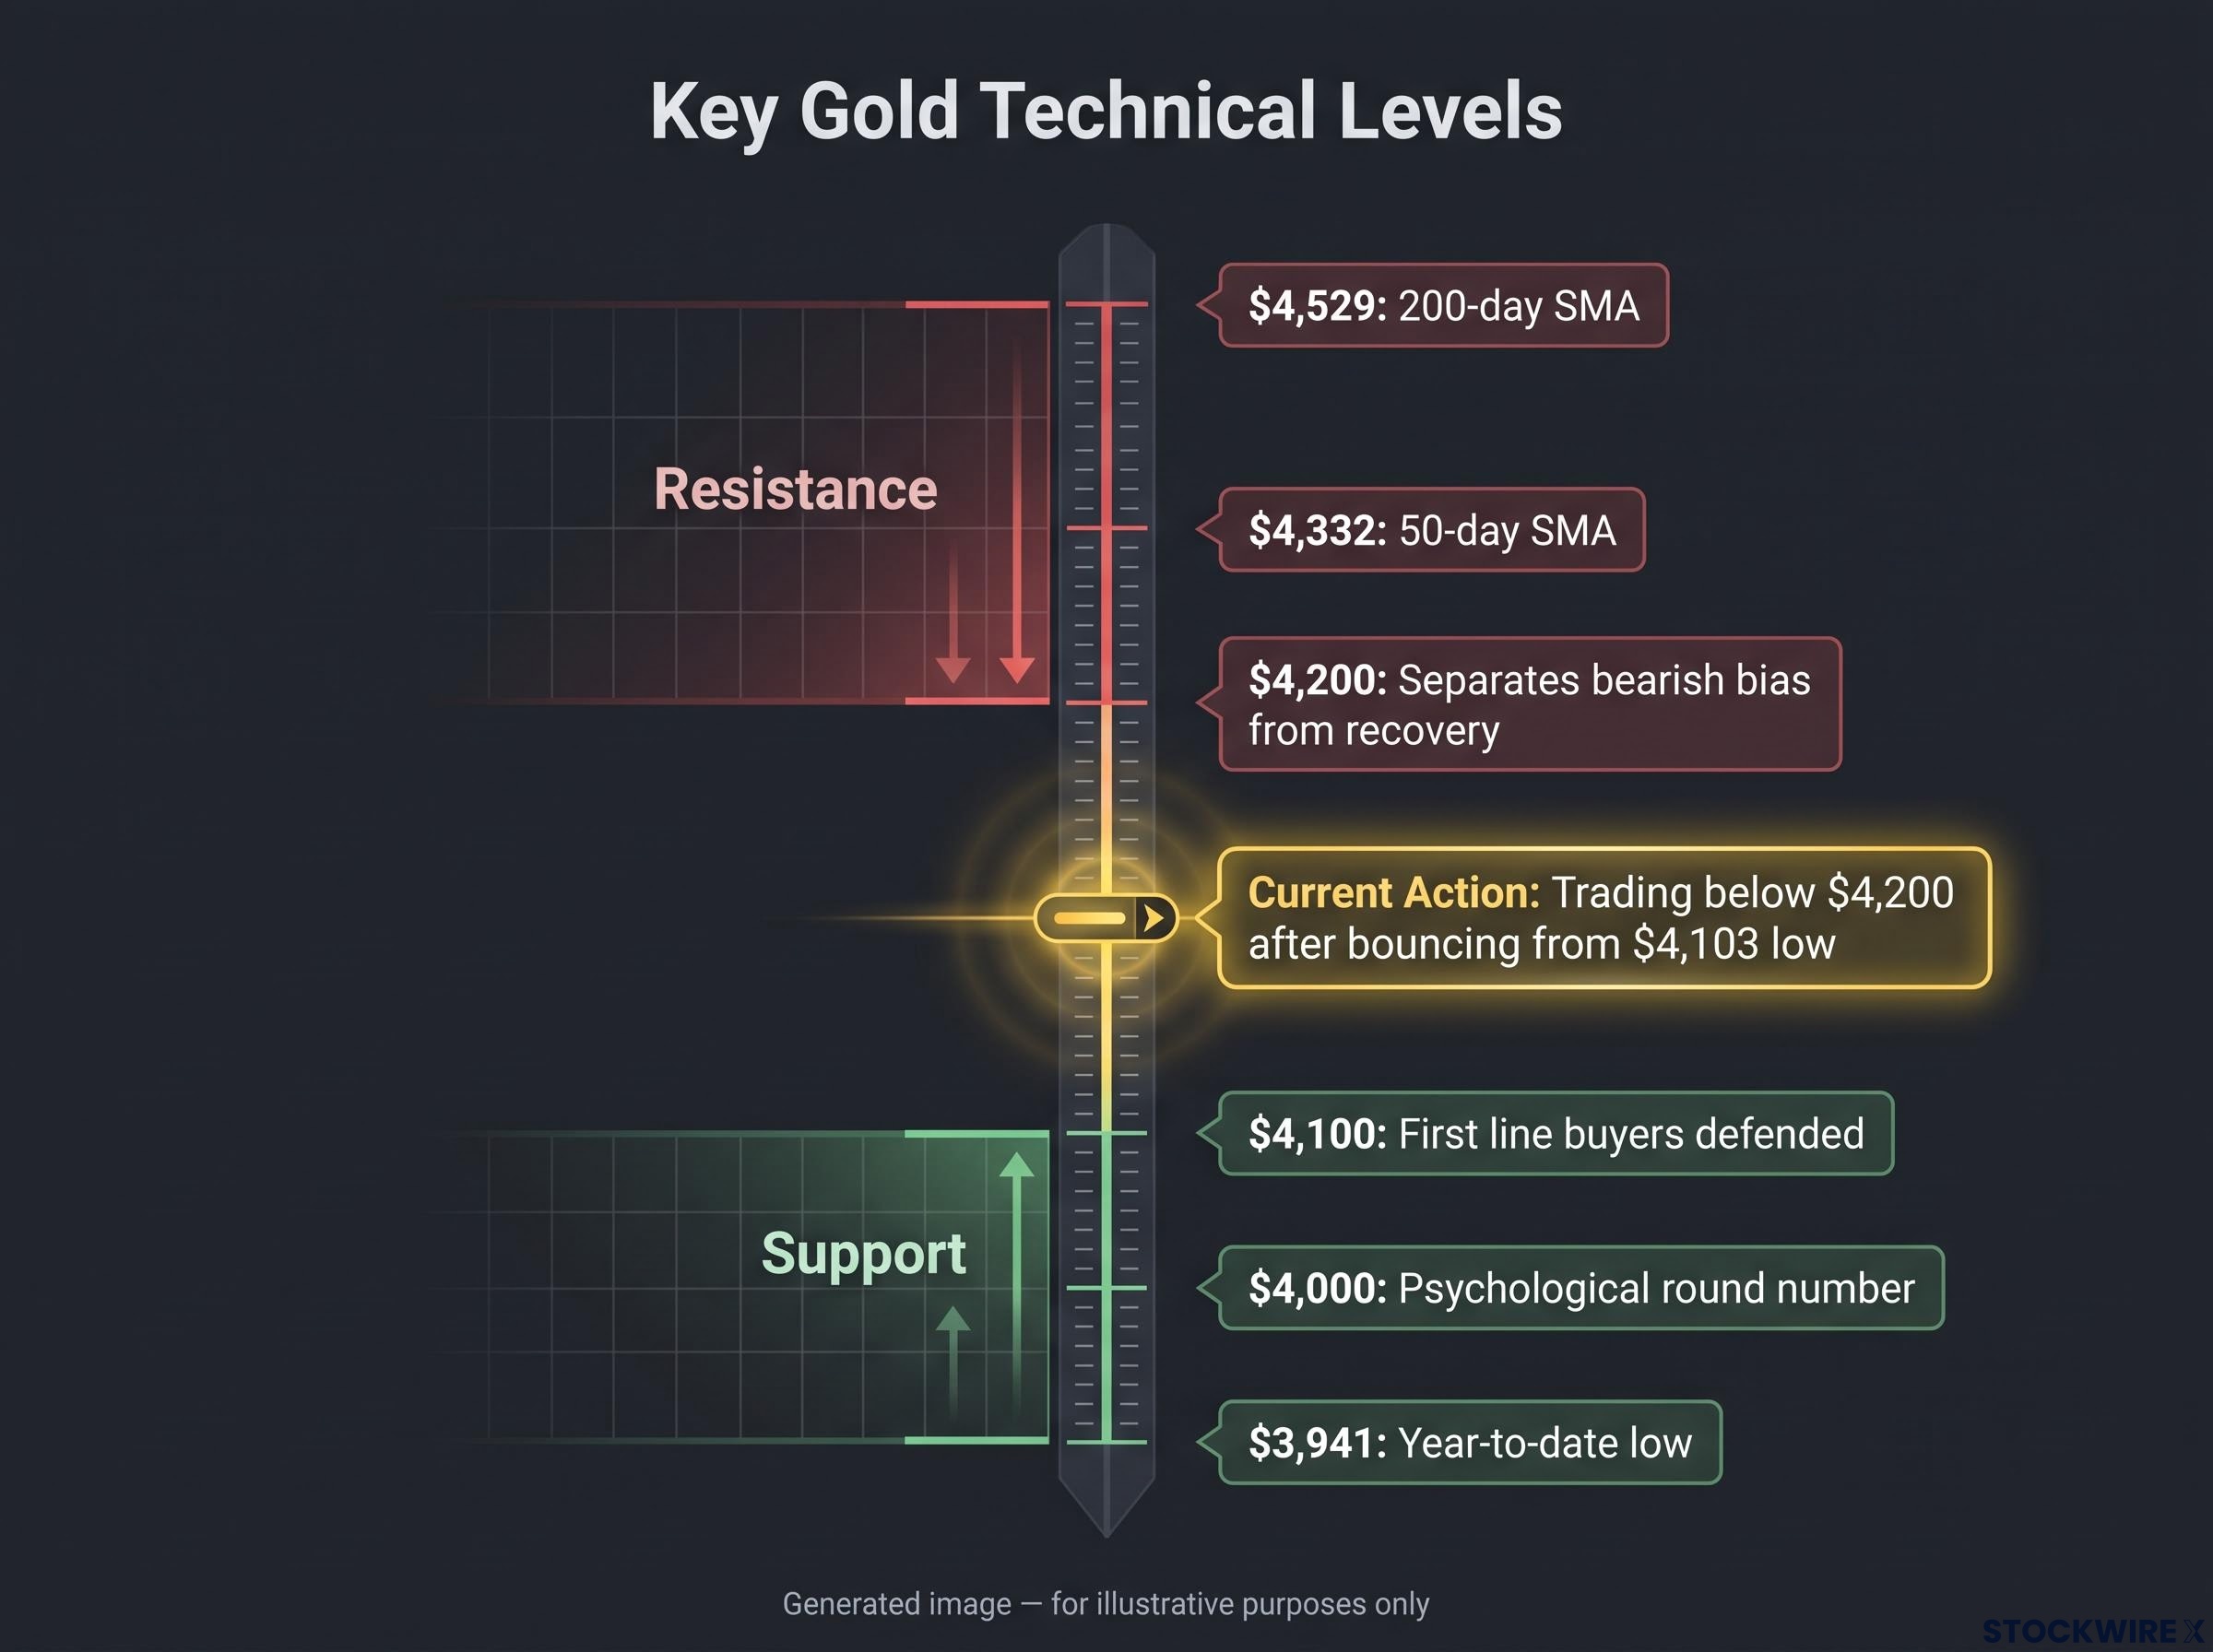
The technical picture is less friendly. FXStreet’s Christian Borjon Valencia sees a bearish bias while gold trades below $4,200. Wednesday’s candle hints at a bullish harami, a two-candle pattern that can signal a reversal, but it needs a decisive breakout to confirm. The Relative Strength Index (RSI), a momentum gauge, remains bearish.
| Level | Type | Significance |
|---|---|---|
| $4,529 | Resistance | 200-day SMA |
| $4,500 | Resistance | Round-number level |
| $4,332 | Resistance | 50-day SMA |
| $4,263 | Resistance | 100-day SMA |
| $4,200 | Resistance | Line separating bearish bias from recovery |
| $4,100 | Support | First line buyers defended this week |
| $4,000 | Support | Psychological round number |
| $3,996 | Support | 29 July swing low |
| $3,941 | Support | Year-to-date low |
The SMA, or simple moving average, is the average closing price over a set number of days. Strong demand tells you dips have been bought, but a close below $4,100 would signal near-term technical pressure is winning. If you hold gold, size your position with those levels in mind.
For readers wanting to map these levels themselves, our detailed coverage of gold support and resistance levels explains how Fibonacci retracements and moving averages mark decision zones.
What the bounce does and does not tell you about gold’s next move
On one side sit easing yields, a softer dollar, energy-driven geopolitical risk and record central-bank buying. On the other sit a hawkish Fed and a bearish chart below $4,200.
The Fed’s dot plot trajectory matters as much as any single hike; the median end-2026 projection has climbed from 3.4% in March to 4.1% in September, and gold has historically responded more to the pivot than to the peak of tightening.
The bounce tells you hawkish rhetoric alone is not enough to break gold. It does not tell you the downtrend is over.
Four things would change the picture: December hike odds moving decisively from 81%, a renewed rise in Treasury yields and the dollar, a Hormuz headline that shifts oil sharply, and a close beyond $4,100 or $4,200. Watch those into the 27-28 October Fed meeting.
This article is for informational purposes only and should not be considered financial advice. Investors should conduct their own research and consult with financial professionals before making investment decisions. Past performance does not guarantee future results. Financial projections are subject to market conditions and various risk factors.