The US Dollar Index climbed back above 101.00 on Wednesday, 23 September 2026, revisiting levels last seen in late July and marking a third consecutive session of gains. On its own, that would be a currency story.
It was not. The same move that lifted the dollar simultaneously pushed the euro, sterling, and the Australian dollar lower, dragged gold to four-day lows, whipped WTI crude around, and left most of the crypto market consolidating with a single loud exception.
That is what makes Wednesday worth examining. The dollar is not one event; it is a transmission mechanism, and this single session showed exactly how a stack of macro drivers cascades across four different arenas at once.
Underneath the move sits a specific combination: hawkish Federal Reserve expectations, resilient US economic data, and rising Treasury yields. When those three forces converge, they do not stay contained in forex. They reprice everything denominated in, or priced against, the dollar.
Here is what the day actually tells you about the macro environment, why these assets moved together rather than separately, and which specific Thursday catalysts could either extend the trend or snap it. Read this way, the dollar’s reach becomes a diagnostic tool, not just a headline.
What pushed the dollar to two-month highs on Wednesday
This was not a random tick higher. Wednesday’s advance was the convergence of three reinforcing forces, each substantial enough to move the dollar on its own.
The three drivers stack as follows:
- Strong US economic data, with the Chicago Fed National Activity Index cited in FX analysis dated 21 September 2026 as a specific near-term trigger for a dollar move higher.
- Rising US Treasury yields across the full maturity spectrum, accompanying the advance and drawing capital toward dollar assets.
- Hawkish Federal Reserve communication, keeping expectations for elevated rates anchored even where projected paths looked slightly less aggressive than prior pricing.
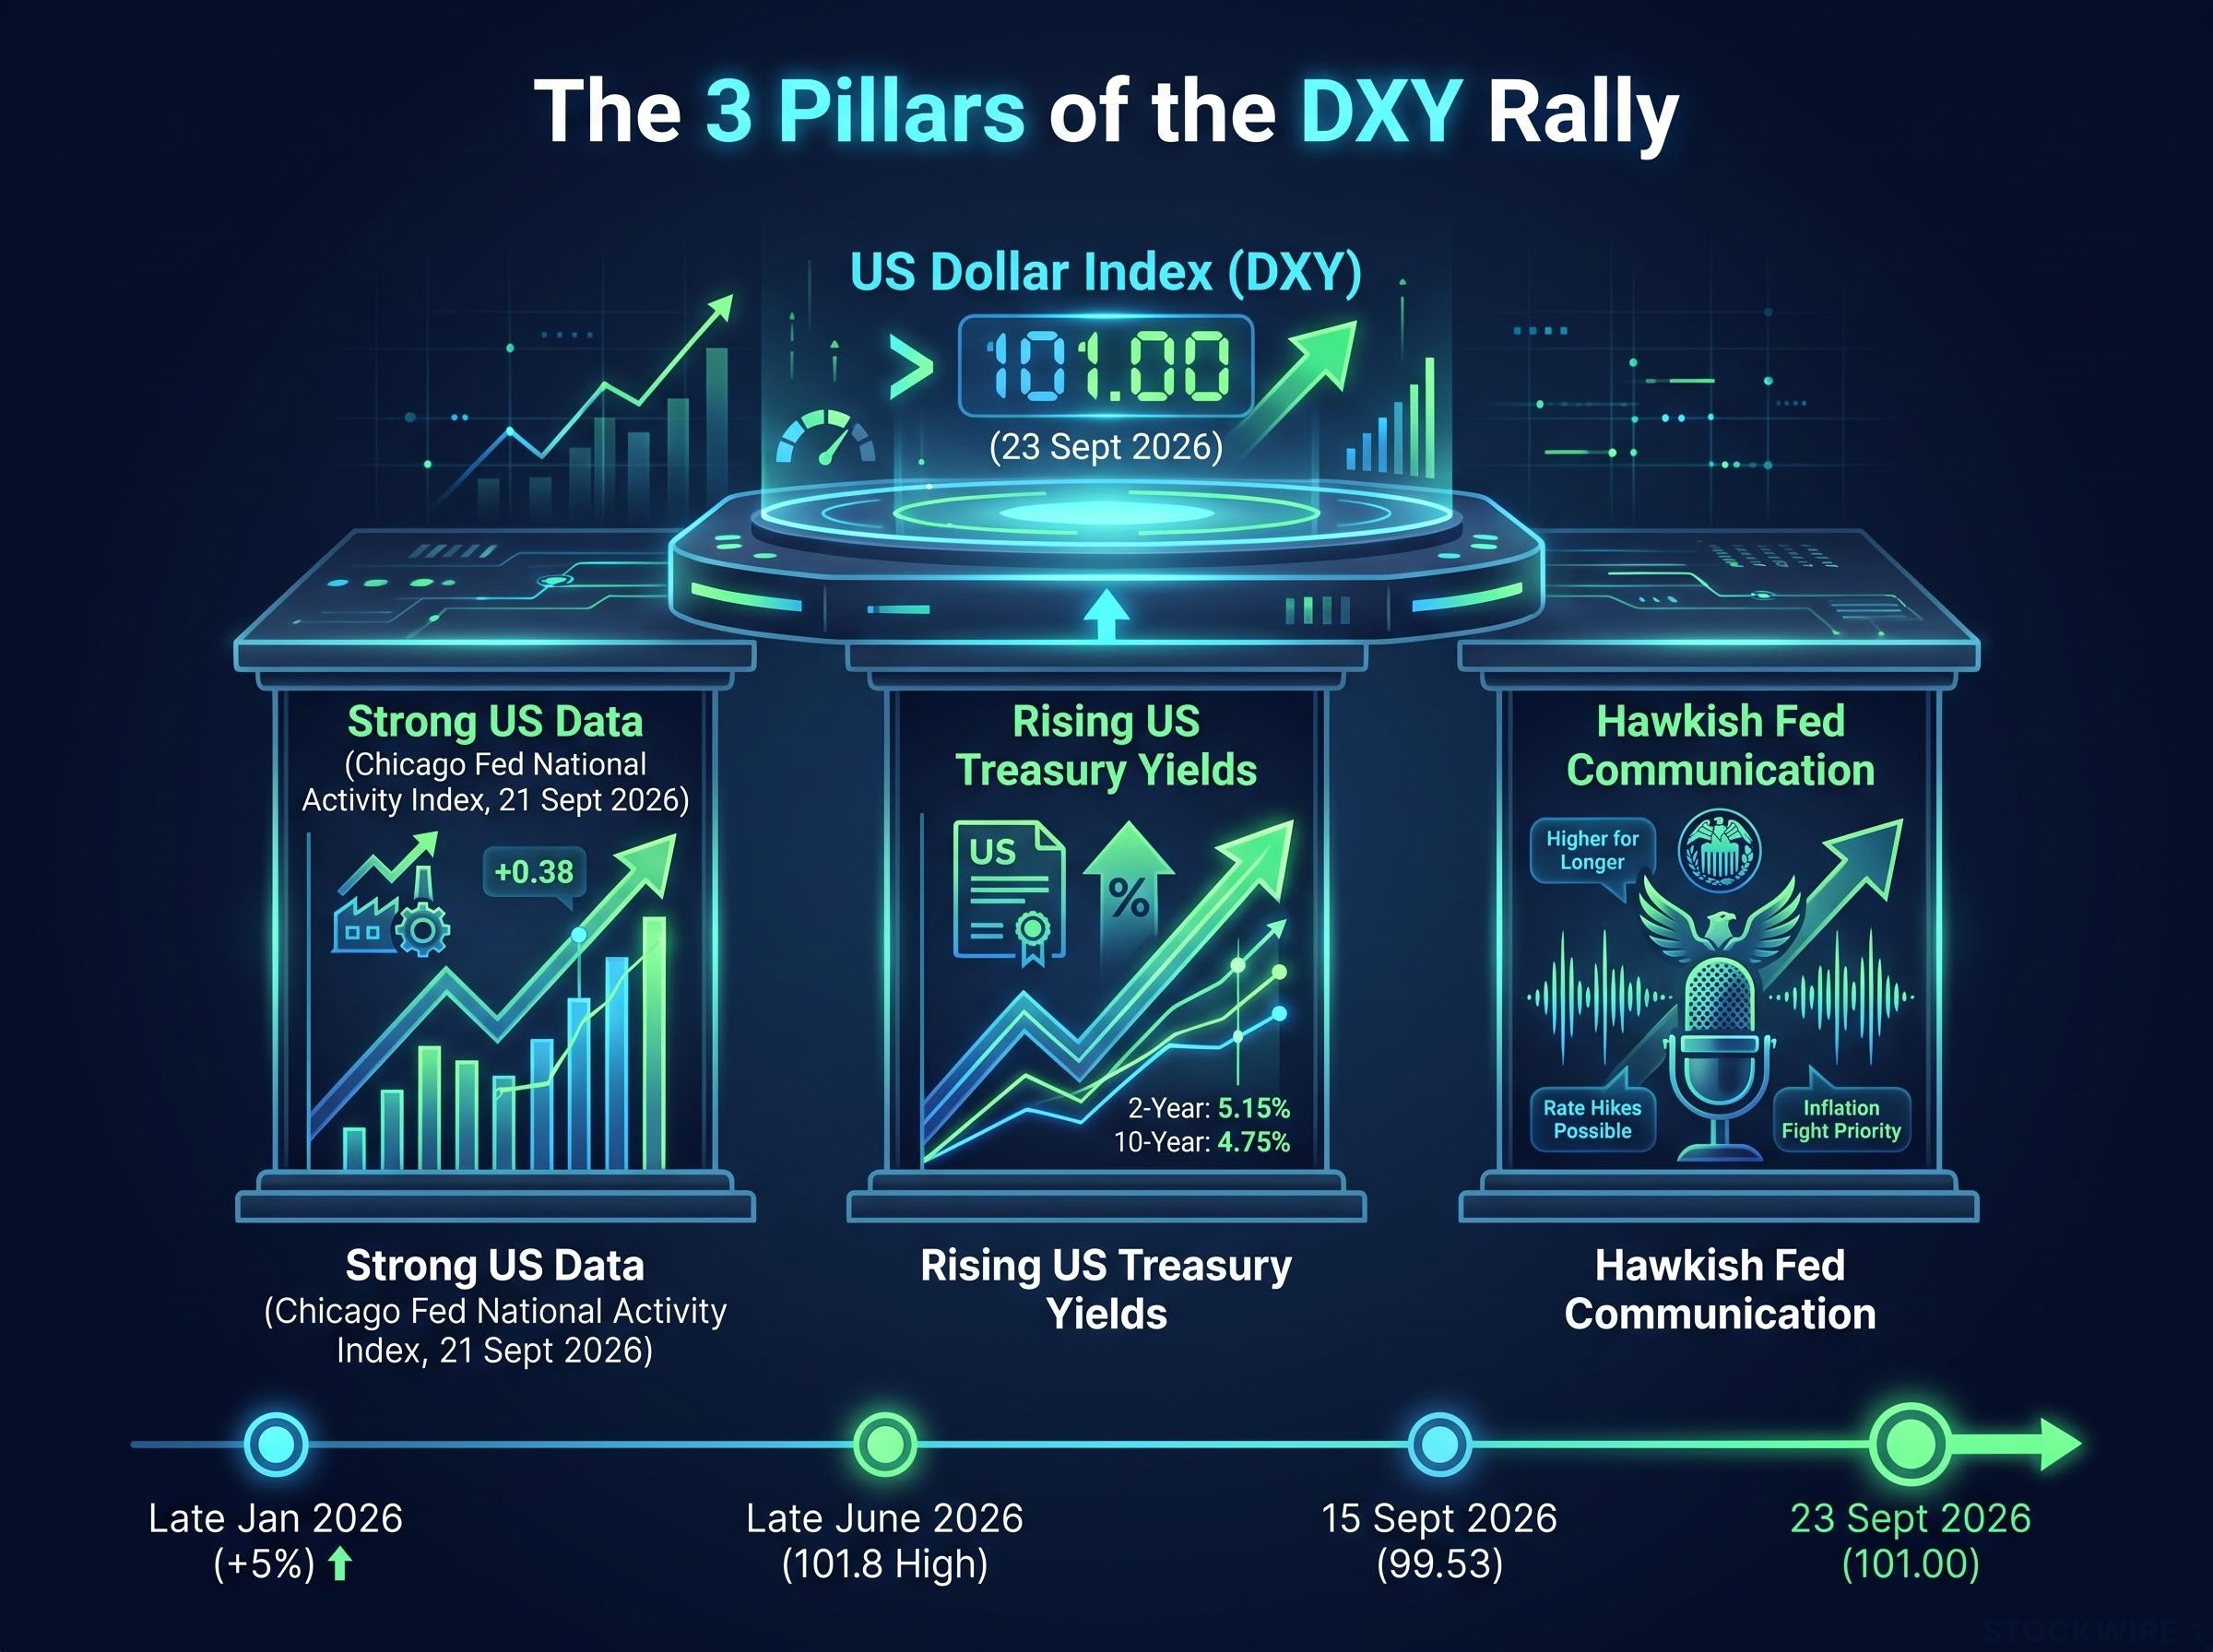
The important part is how they feed each other. Strong data lifts yield expectations. Higher yields pull capital into dollar-denominated assets. Fed hawkishness then locks in the assumption that rates stay high for longer, which supports yields again.
That last point deserves emphasis. Market interpretation of Fed communications has stayed hawkish even where the projected rate path softened somewhat, which means the communication itself became a dollar-support mechanism, not just the policy behind it.
Market interpretation of Fed forward guidance has stayed hawkish even where the projected rate path softened somewhat, which means official communication is itself functioning as a dollar-support mechanism, a dynamic that non-voting regional presidents can amplify without any formal policy change.
The dollar has advanced roughly 3% year-to-date and 5% since late January 2026, with a 13-month high of 101.8 posted in late June 2026.
The path there was not linear. The index had dipped to around 99.53 on 15 September 2026 before recovering back above 101.00 by the 23rd, a reminder that even strong rallies stall and reload rather than march in a straight line.
For an investor, the driver stack is the key read. A rally resting on a single data point can reverse on a single miss. This one has three load-bearing pillars, which means more than one of them would need to crack before the move genuinely unwinds. That asymmetry is the practical takeaway, and it shapes everything that follows across the other asset classes.
When big ASX news breaks, our subscribers know first
How dollar strength transmitted across forex pairs
The clearest signal in the forex tape on Wednesday was not any single pair. It was the fact that all of them moved the same way.
When the euro, sterling, the yen, the Australian dollar, and the Canadian dollar all weaken against the greenback in one session, that broad-based pattern points to genuine dollar strength rather than idiosyncratic trouble in any one economy. Each pair still reveals something specific about its home economy’s exposure to the US rate differential.
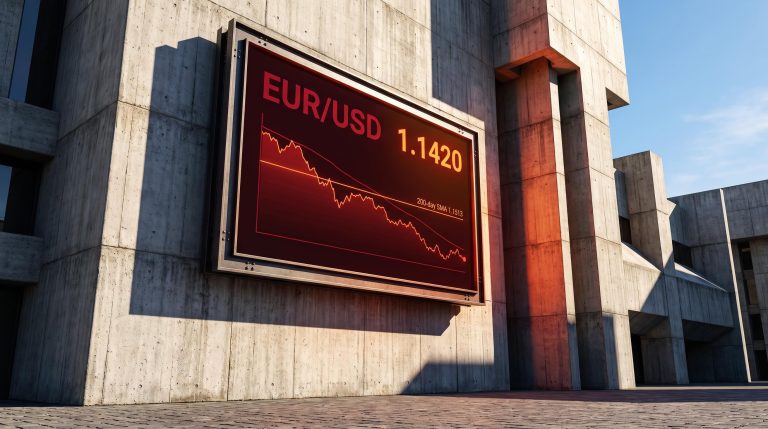
EUR/USD dropped to around 1.1370, nearing its yearly low range under the weight of the dollar bid. GBP/USD approached 1.3230, a level tied to three-month lows, with sterling’s slide attributed mainly to the dollar rather than any UK-specific catalyst.
EUR/USD dropping toward its yearly low range is principally a story about the ECB-Fed rate differential, where markets are pricing expected future paths rather than current official rates, which is why Thursday’s Lane and Schnabel appearances carry more near-term EUR/USD weight than any rate decision already in the price.
USD/CAD traded near 1.4090, up around 0.21% on the day, with the Canadian dollar unable to hold ground even as WTI crude staged a partial recovery. AUD/USD pulled back to the low-0.7000 area, and its weakness carried an extra layer worth noting: flash Australian PMI data showed manufacturing sliding into contraction while services expanded only marginally. That is dollar strength meeting domestic softness, and the combination accelerates the move.
| Currency Pair | Wednesday Level | Session Direction | Key Thursday Event |
|---|---|---|---|
| EUR/USD | ~1.1370 | Lower, near yearly low range | ECB’s Lane and Schnabel speak |
| GBP/USD | ~1.3230 | Lower, three-month lows | BoE’s Bean, Dhingra, Breeden; CBI survey |
| USD/JPY | Above 158.00 | Higher, fourth straight session | Japan preliminary S&P Global PMI |
| AUD/USD | Low-0.7000 area | Lower, third straight day | August labour market report |
| USD/CAD | ~1.4090 | Higher, +0.21% on the day | WTI price direction |
For a US investor holding international equity exposure, this table maps where the pressure is landing hardest and where Thursday’s event risk could shift the dynamic.
The BoJ paradox: raising rates, losing ground
USD/JPY broke above 158.00 for a fourth consecutive session, approaching its 200-day simple moving average, and it did so despite the Bank of Japan actually tightening. The BoJ raised its short-term rate to 1.25% from 1.00% in a 7-2 vote, a dovish-hike posture that still left the yen pressured because Japanese rates remain far below US levels and the Fed’s advantage stayed dominant.
That is the most telling signal in the whole forex picture. When even a central bank tightening cycle cannot support its own currency, it shows you just how much Fed policy expectations are setting the global FX tone right now.
The only visible check on further upside is intervention. Concerns about potential Japanese currency action were noted as the main factor capping how far USD/JPY can run from here.
Gold, oil, and crypto: reading the dollar’s footprint across asset classes
These three markets are not separate stories. Read together, they form a single diagnostic of how dollar strength actually transmits, and gold is the cleanest place to start.
Gold dropped to just above $4,250 per troy ounce on 23 September, a four-day low, before sliding further below $4,300 to weekly lows in subsequent midweek trading. For context, spot gold had traded near $4,291-$4,294 in mid-September. The decline flows through three distinct channels:
- The dollar cost channel: a stronger dollar raises the effective price of dollar-denominated bullion for buyers outside the US, dampening demand.
- The yield opportunity-cost channel: higher Treasury yields make holding a non-yielding asset like gold more expensive relative to income-producing alternatives.
- The oil-driven inflation channel: rising crude fuels inflation worries, which reinforce both yield pressure and dollar strength, compounding the drag on gold.
This is where the educational point matters for anyone newer to cross-asset dynamics. Gold does not fall because of one thing. It falls because the dollar, yields, and inflation expectations move together, and when gold drops hard it is telling you that at least two of those three forces are tightening at once. That is your real-time gauge for whether any non-yielding position is worth revisiting.
Oil complicates the inflation leg of that story. WTI crude briefly fell below $89.00 early in the North American session on 23 September before recovering to roughly $92.00. That sits well below the mid-September highs, which sources put in a $102-$105 range, and the pullback actually softens the inflation-expectations channel that had been one of the dollar’s earlier pillars.
Crypto, by contrast, largely sat the move out. Bitcoin traded near $86,000, consolidating after confirming a golden cross around $85,247 on 23 September, while Ethereum held above $2,700, both stable and range-bound. The one exception stood well apart.
XRP traded above $1.61 on 23 September, extending a six-day winning streak. As of 17 September it was up approximately 22.96% over the prior seven days, the standout performer among major cryptocurrencies.
| Asset | Wednesday Level | Direction | Dollar Sensitivity |
|---|---|---|---|
| Gold | Just above $4,250/oz | Lower, four-day low | High |
| WTI crude | ~$92/barrel | Recovered from sub-$89 | Moderate |
| Bitcoin | ~$86,000 | Consolidating | Low |
| Ethereum | Above $2,700 | Stable | Low |
| XRP | Above $1.61 | Six-day winning streak | Decoupled |
Knowing that each asset answers to a different dimension of the dollar story helps you position for Thursday. A hot jobless claims print could push yields and the dollar further and extend gold’s weakness, while a soft number could reverse the chain quickly.
Is this dollar rally built to last, and what could break it on Thursday?
Start with the structural foundation, because it is more solid than the day-to-day price action suggests. Analysts frame the 2026 move as a cyclical recovery from sharp 2025 declines, powered by resilient US growth and renewed Fed rate-hike expectations, rather than a permanent restructuring of the global monetary order. On that view, talk of de-dollarization is overstated, and the dollar’s reserve status stays intact.
Dollar reserve dominance, with the greenback holding approximately 57% of global official reserves while appearing on one side of nearly 90% of all FX trades, means even modest central bank diversification has barely dented the currency’s operational grip, which is why analyst frameworks framing the 2026 rally as cyclical rather than a permanent restructuring carry statistical weight.
Cyclical, though, is not the same as stable. Each pillar holding this rally up has a plausible way of cracking, and the vulnerabilities are specific:
- Data-sensitivity: the Chicago Fed National Activity Index episode showed how a single release moves the dollar. A growth or inflation miss could catalyse a reversal just as easily.
- Oil-price linkage: because oil-driven inflation is one of the yield-support channels, a sharp crude correction would remove a pillar rather than dent it.
- Positioning asymmetry: gold bounced back near $4,350 on sessions when the dollar softened and oil dropped, proof that the market’s positioning is not one-sided and reversals come fast.
The DXY chart itself hints at fragility. The rally built from late January 2026, peaked at 101.8 in late June, dipped to 99.53 in mid-September, then recovered above 101.00, a pattern of building and stalling around resistance rather than powering cleanly through it.
Thursday’s catalyst map
Thursday, 24 September 2026, carries a dense US data calendar, and each release cuts both ways for the dollar.
| Thursday Catalyst | Type | Potential Market Impact Direction |
|---|---|---|
| Weekly initial jobless claims | Data | Hot labour reading supports dollar; soft print pressures it |
| New home sales | Data | Strong sales reinforce growth narrative and dollar |
| Building permits | Data | Upside surprise adds to yield and dollar support |
| Q2 current account balance | Data | Wider deficit is a longer-term dollar drag |
| Fed: Williams, Barkin, Hammack, Paulson | CB Speech | Hawkish tone extends rally; dovish tilt softens it |
| ECB: Lane, Schnabel | CB Speech | Hawkish signals could steady EUR/USD |
| BoE: Bean, Dhingra, Breeden | CB Speech | Tightening hints could lift GBP/USD off lows |
| Trump-Xi Summit | Geopolitical | Direction uncertain; hardest event to position around |
The summit is the wildcard. Its market impact is genuinely uncertain in direction, which makes it the single hardest event to hedge or trade around. Taken together, the calendar is dense enough that Wednesday’s dollar posture could look meaningfully different within 24 hours, so any dollar-sensitive position deserves that asymmetry factored in rather than a straight extrapolation of the trend.
What the dollar’s reach across markets tells you about where the macro cycle stands
Pull back to the wider view and the pattern resolves into one conclusion. The simultaneous repricing across forex, gold, oil, and crypto is not noise. It is a coherent signal that US rate expectations are the dominant global financial variable in late September 2026.
Look at the full picture the session drew: DXY above 101.00, EUR/USD near 1.1370, GBP/USD near 1.3230, USD/JPY above 158.00, gold at four-day lows near $4,250, WTI recovering to $92, and XRP the lone major outperformer. When assets this different move together this cleanly, the market is usually one data print away from a sharp partial reversal, and knowing that is more actionable than any single price level.
The dollar-gold-crypto alignment observed in Wednesday’s session has a recent mirror image: when the DXY fell to three-month lows in August 2026, gold tested resistance near $4,600, Bitcoin cleared $77,000, and sterling hit a six-month high simultaneously, confirming that the transmission mechanism runs with equal force in both directions.
The asymmetry is the point. Each of the rally’s cyclical drivers has a plausible reversal scenario, so the risk here is not one-directional. Three specific scenarios are worth monitoring:
- A data miss that undercuts the resilient-growth narrative.
- An oil-price correction that removes an inflation-support channel.
- A dovish shift in Fed communication that softens rate expectations.
So the question to hold is not “will the dollar keep rising?” It is “which of Wednesday’s three pillars is most likely to crack first, and what is my exposure to that scenario?” That framing turns a single session into a durable lens for reading the next dollar-strength episode.
This article is for informational purposes only and should not be considered financial advice. Investors should conduct their own research and consult with financial professionals before making investment decisions. Past performance does not guarantee future results, and financial projections are subject to market conditions and various risk factors.