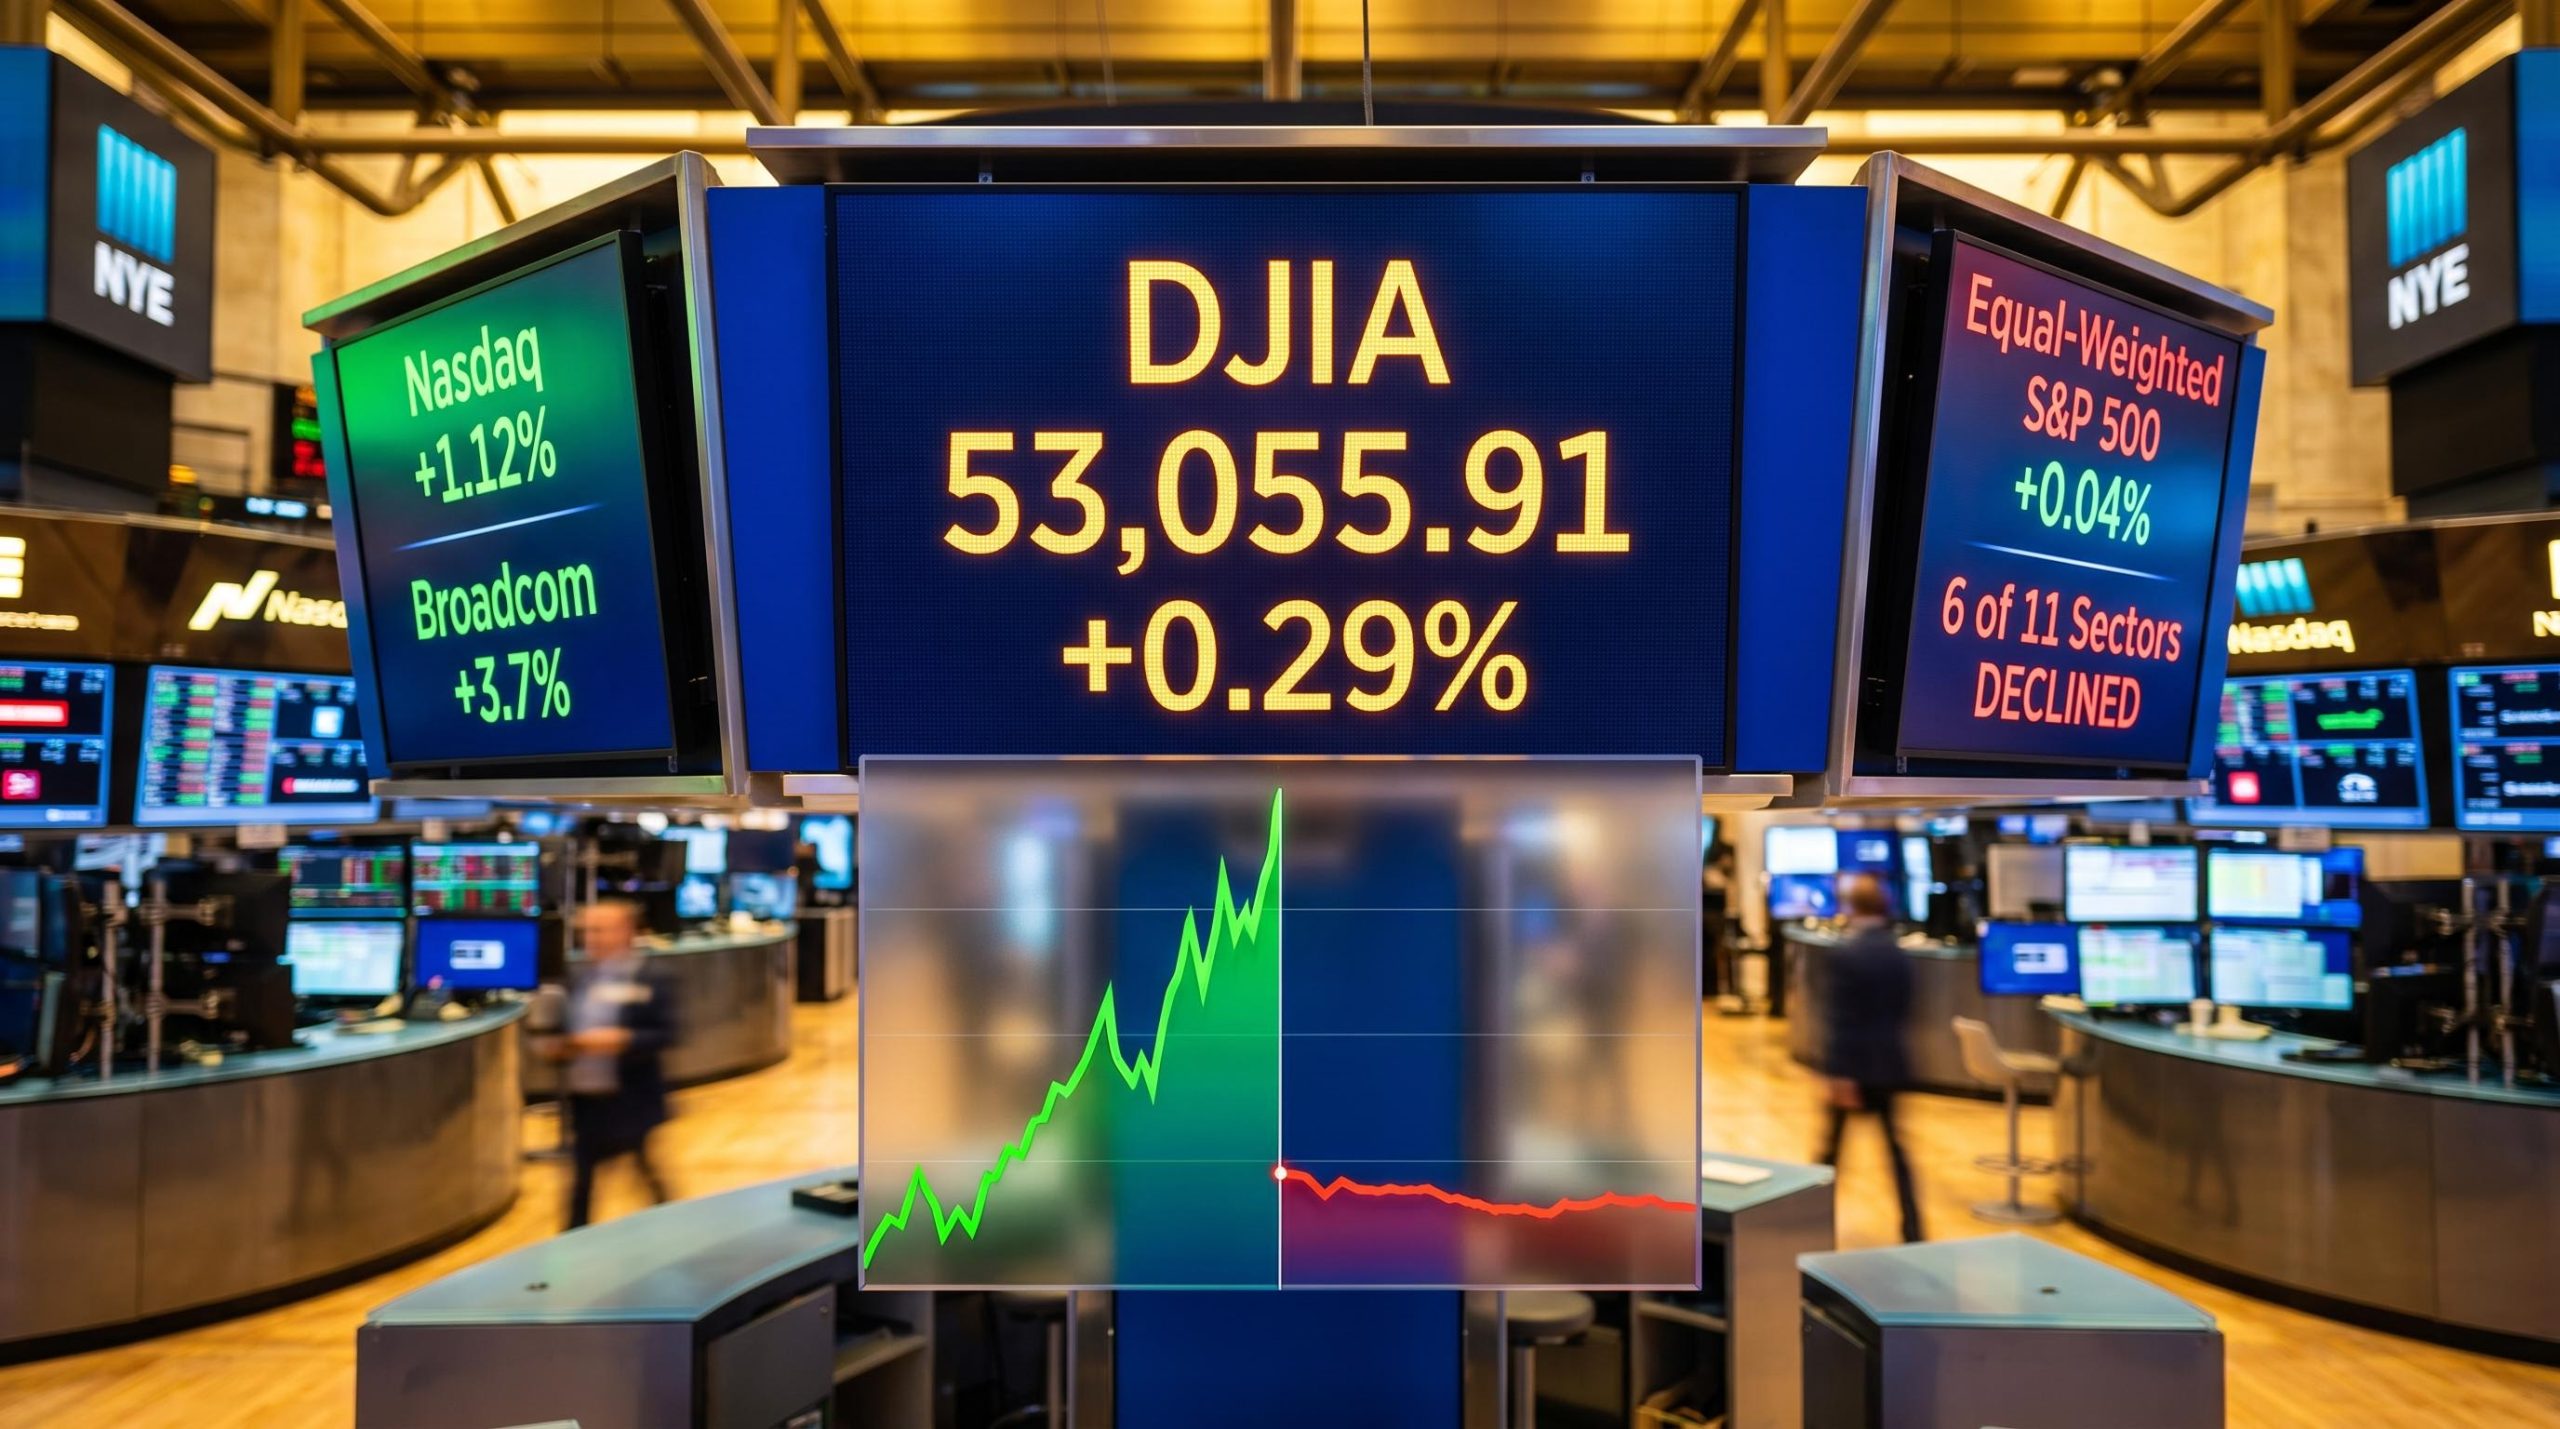
The Dow Jones crossed the 53,000 threshold for the first time on Monday 6 July 2026, ending the session at 53,055.91. That same day, more than half of all S&P 500 sectors finished in negative territory.
That contradiction is the story. The Nasdaq Composite gained 1.12%, its best single-session move in weeks, while the equal-weighted S&P 500 added just 0.04%. One number says the US stock market is at an all-time high. The other says the average stock barely moved.
This piece breaks down exactly what drove the session, which companies and sectors did the heavy lifting, what two major Wall Street strategists are saying about whether it holds, and the one internal signal worth tracking through the second half of 2026.
A record close built on a thin foundation
Four major US indices finished higher, but the quality of the advance varied sharply depending on how you measure it.
| Index | Close | Change (%) | Note |
|---|---|---|---|
| Dow Jones | 53,055.91 | +0.29% | All-time record high; first close above 53,000 |
| S&P 500 | 7,537.43 | +0.72% | Cap-weighted gain |
| Nasdaq Composite | 26,121.16 | +1.12% | Session leader |
| Russell 2000 | 3,009.54 | +0.45% | Modest small-cap participation |
| Equal-Weighted S&P 500 | — | +0.04% | 68 basis points below cap-weighted benchmark |
The cap-weighted S&P 500 gained 0.72%. The equal-weighted version, which gives every stock the same influence, gained 0.04%. At 68 basis points, the divergence between the two measures was the sharpest signal the session produced.
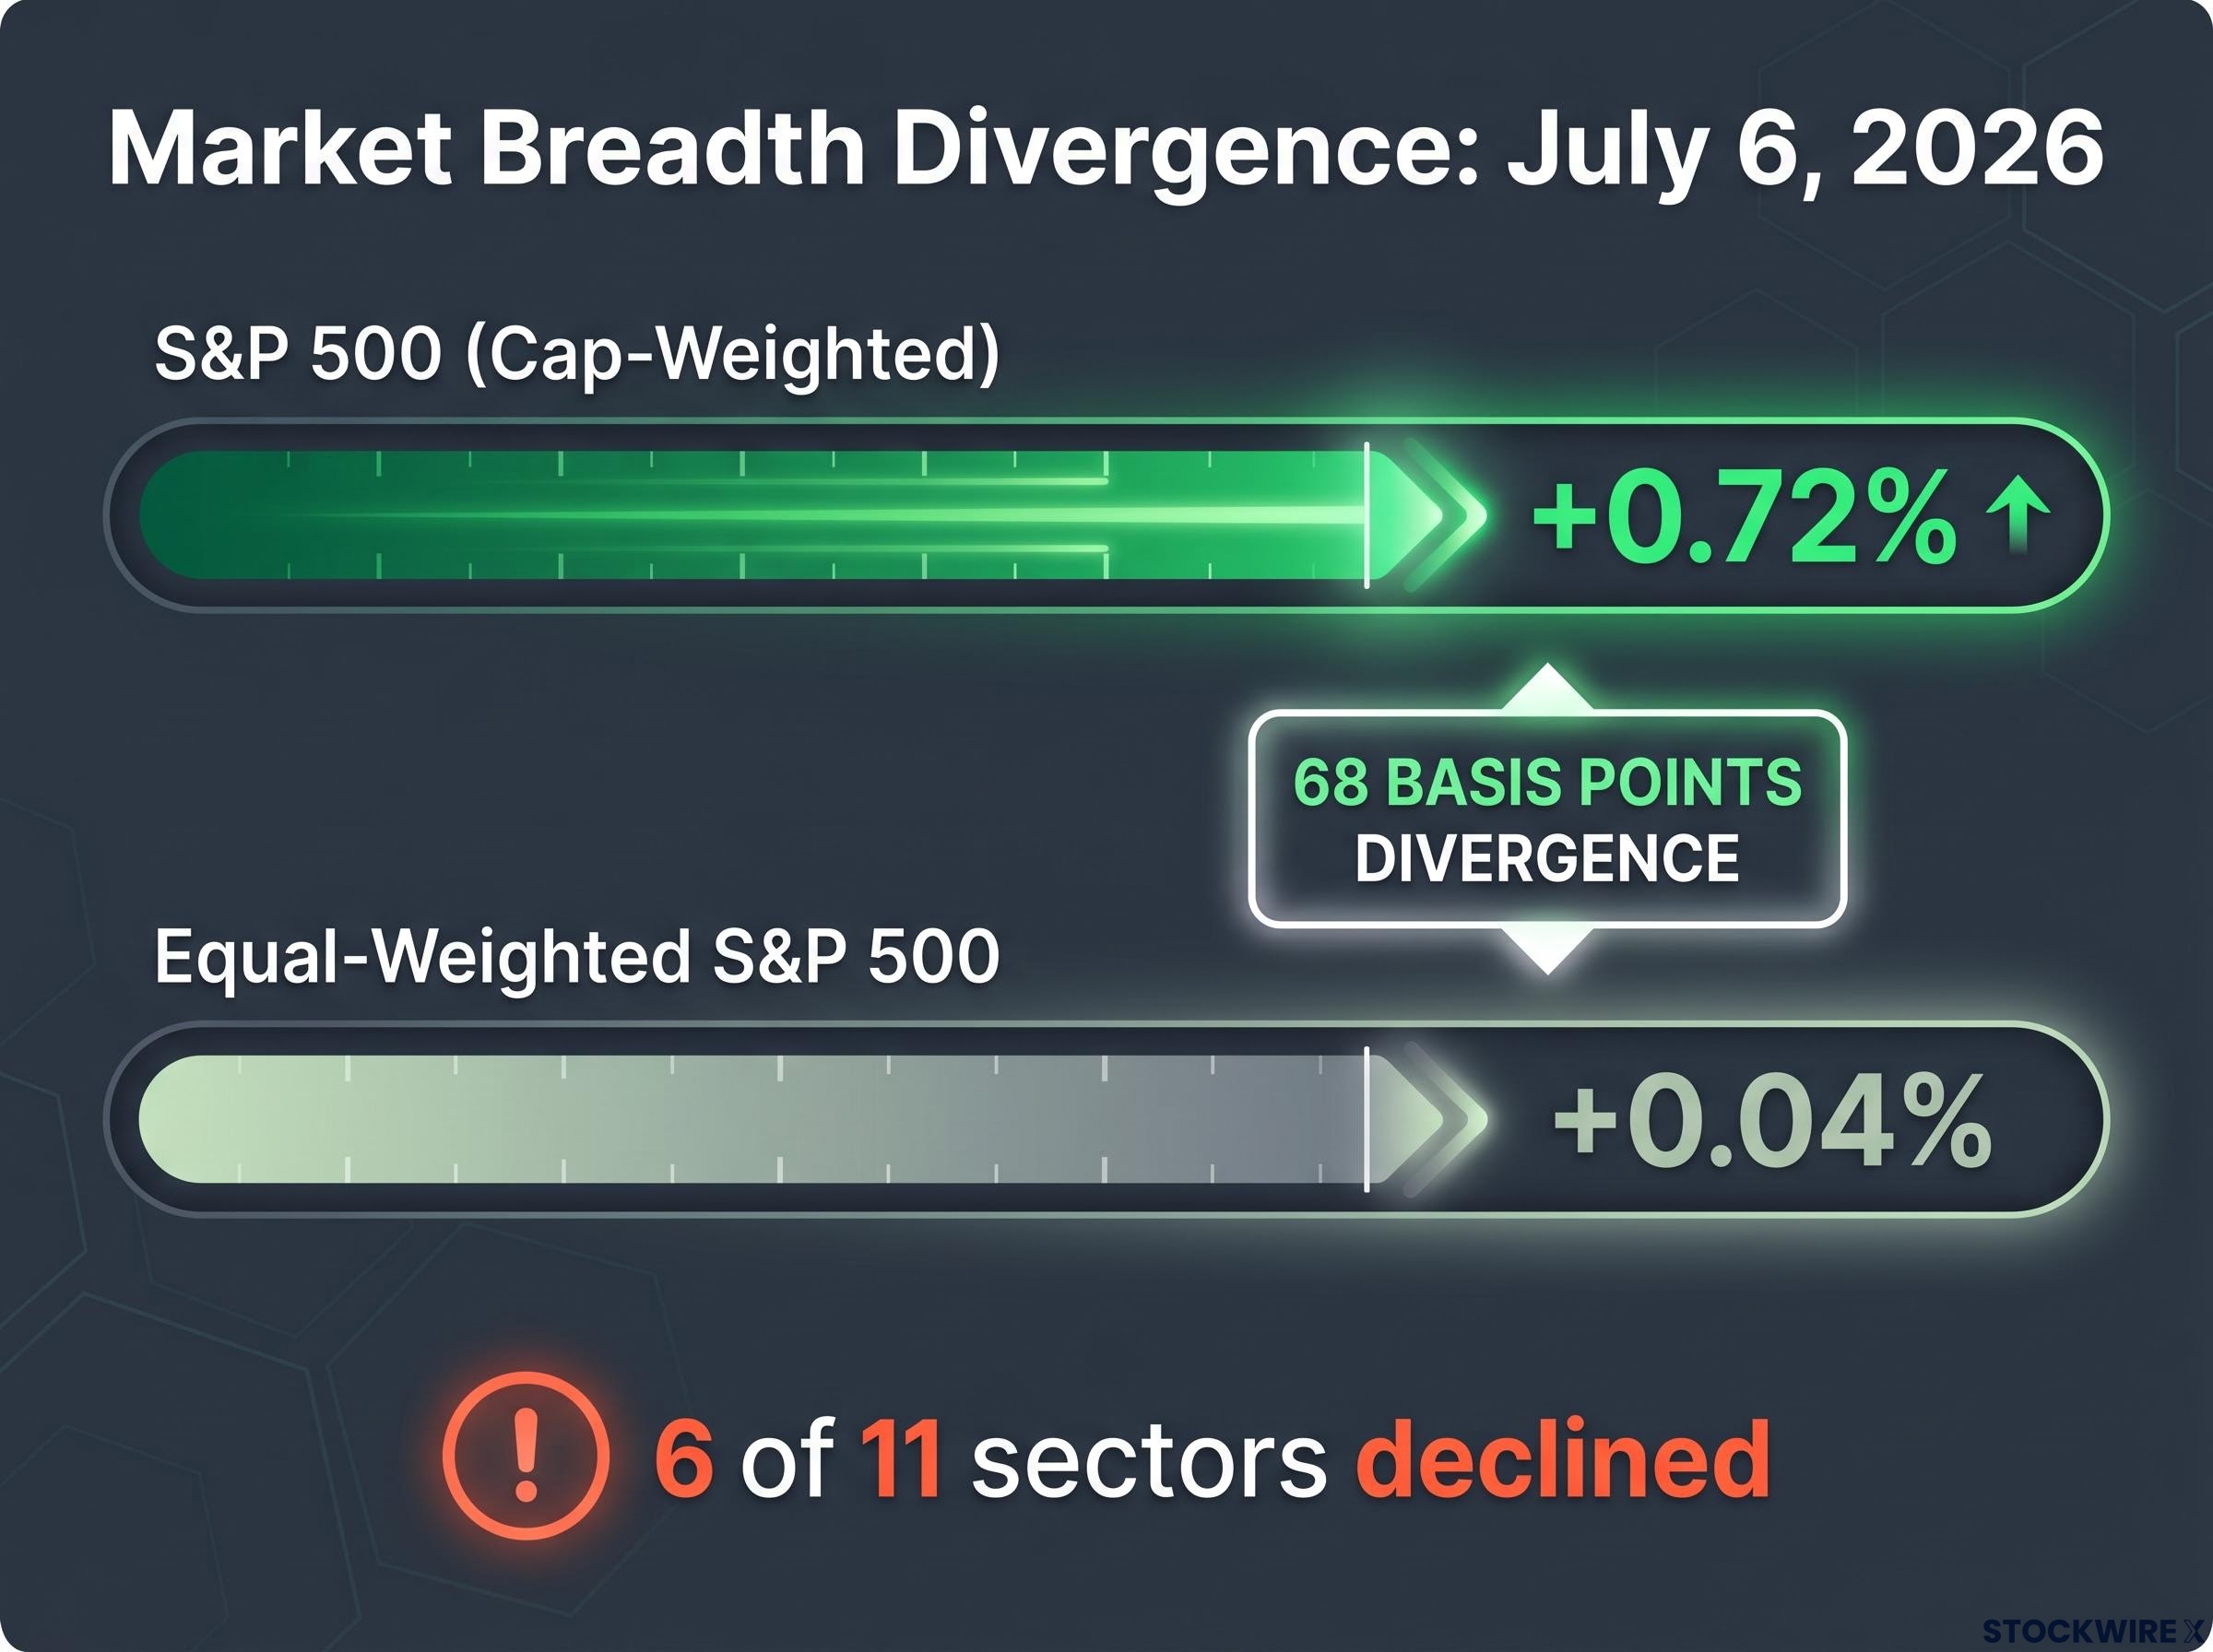
0.04%: the gain for the average S&P 500 stock on the day the Dow crossed 53,000 for the first time.
Six of eleven sectors declined. The record high was real, but it was built by a handful of very large companies, not a broad market advance. If you hold a diversified index fund, your experience of this session was very different from the headline.
Dow Theory divergence signals have been flagging internal inconsistencies in the 2026 rally since April, when industrial and transportation averages failed to confirm each other’s highs, a structural warning that the current narrow leadership pattern continues to extend.
When big ASX news breaks, our subscribers know first
Chips and AI pulled the session higher: here is what drove it
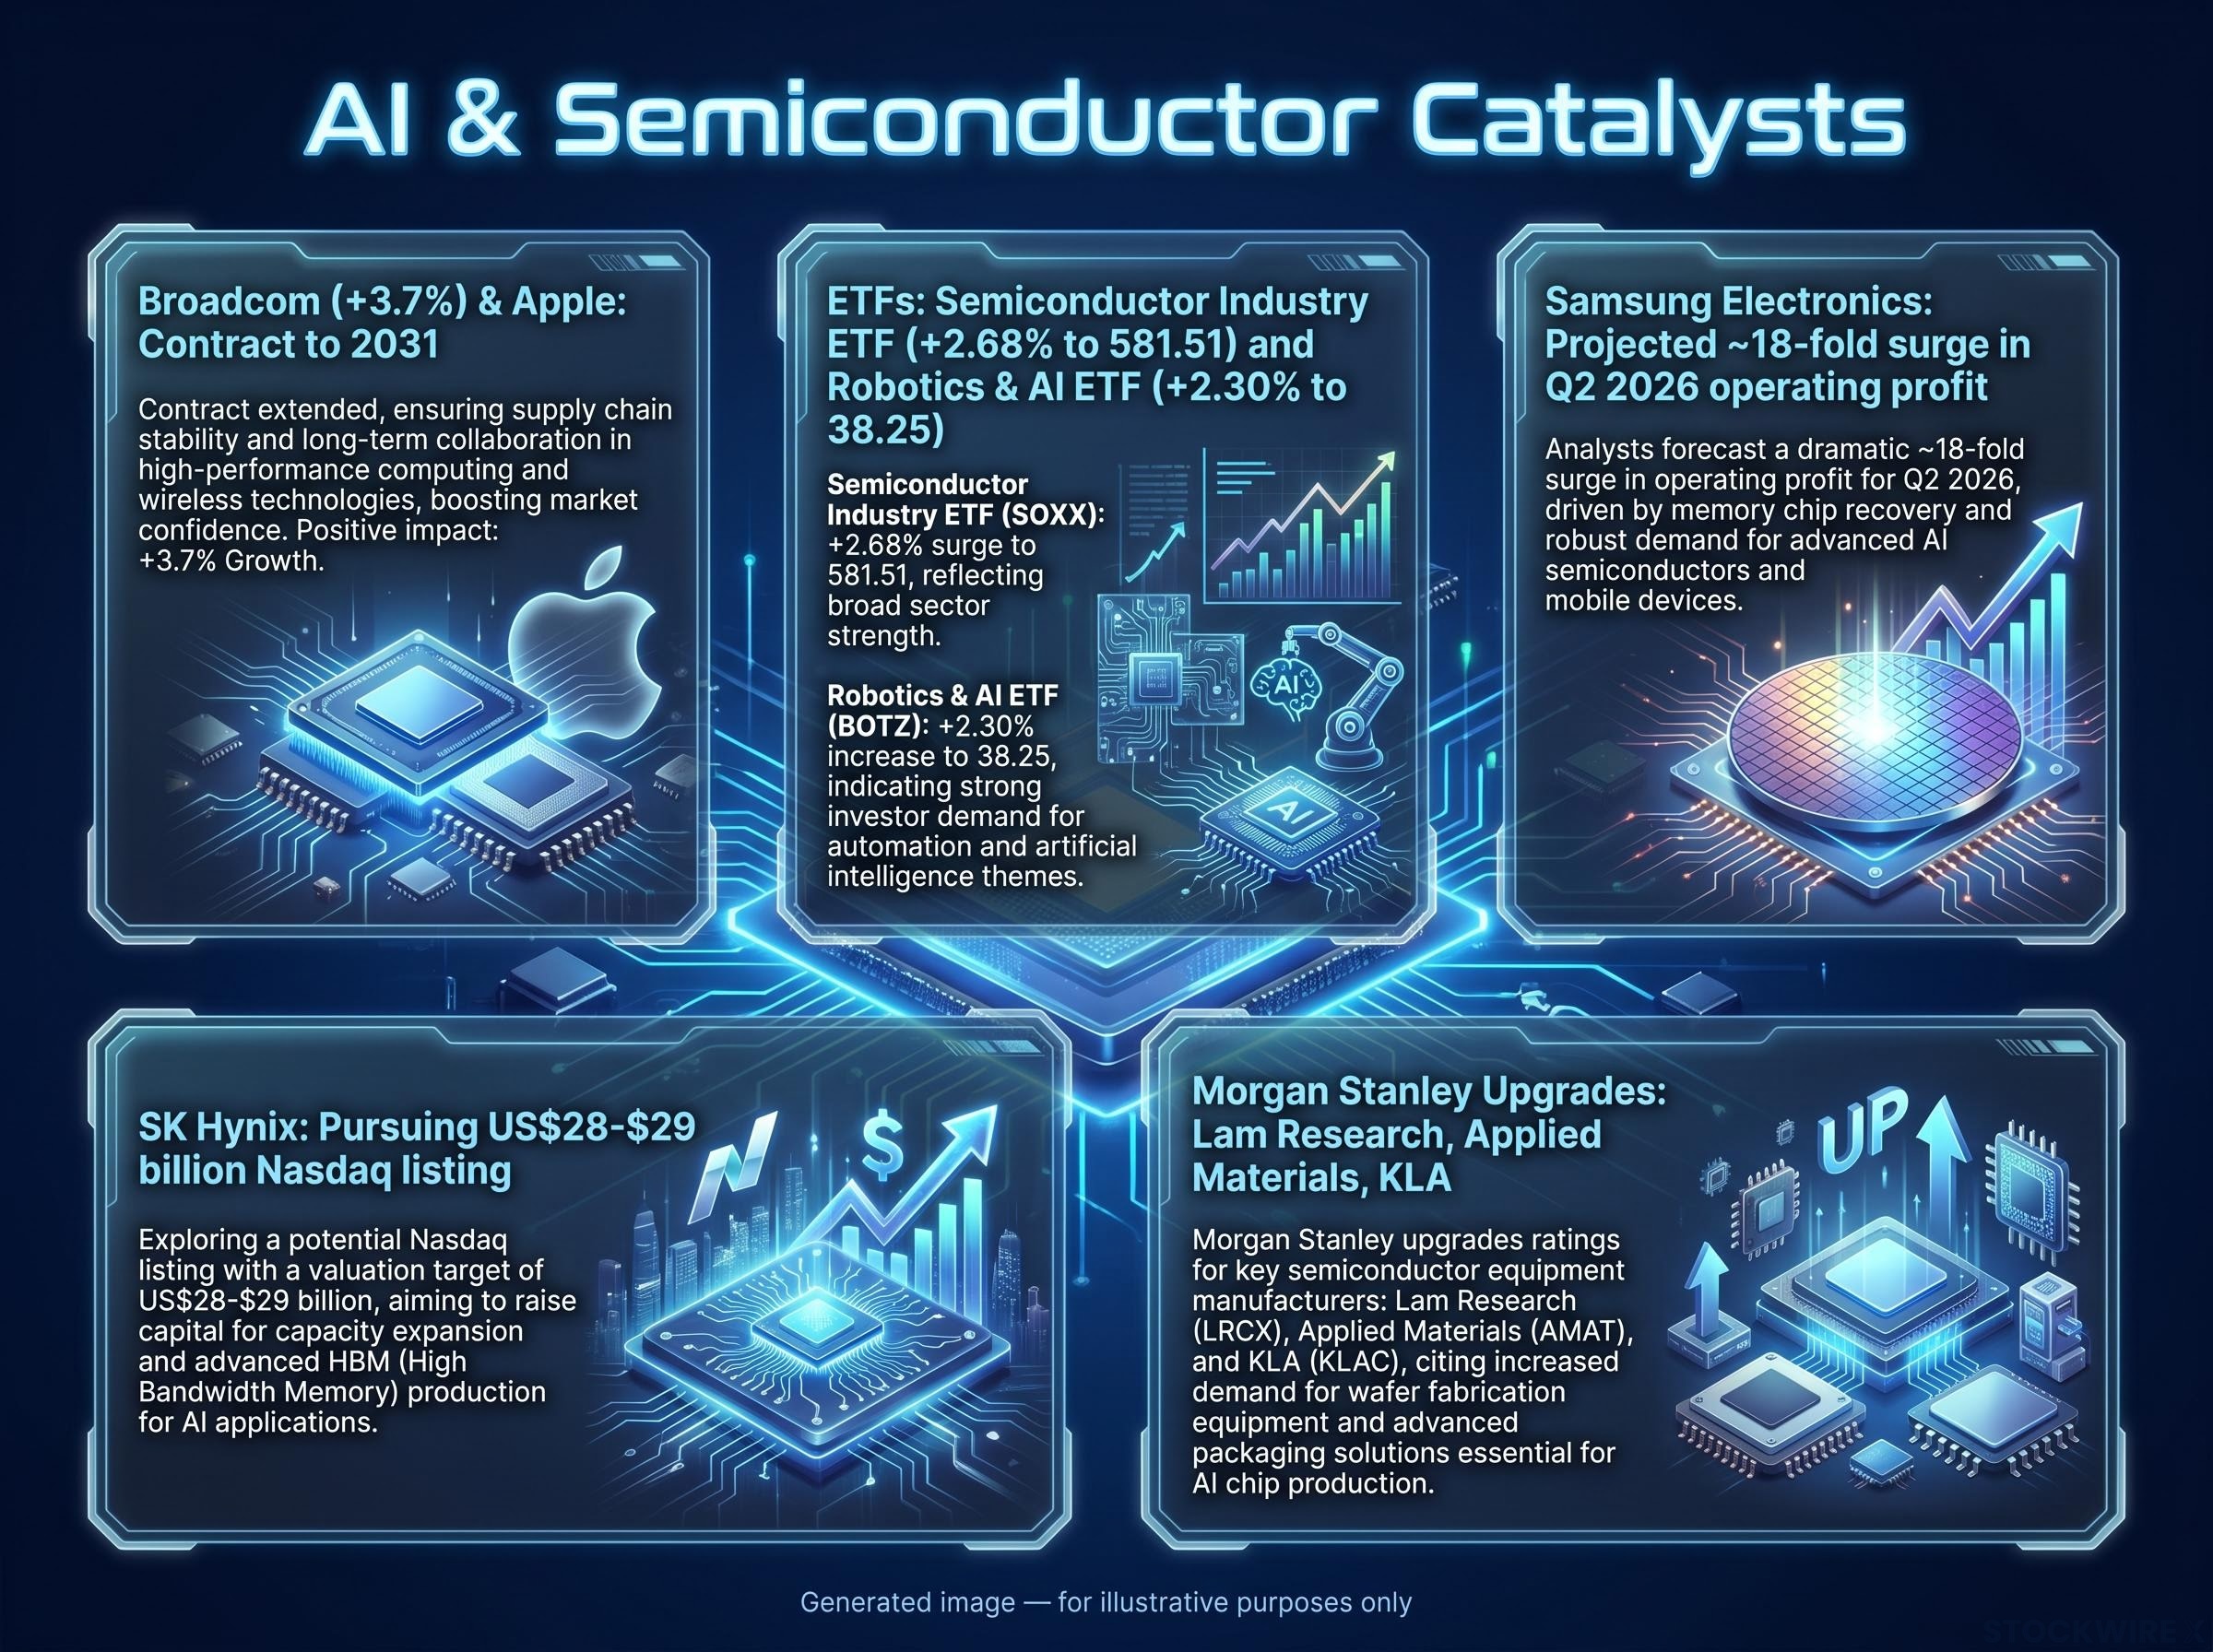
Broadcom shares climbed 3.7% after the company secured a continuation of its custom chip arrangement with Apple running to 2031, cementing a multi-year revenue stream within the AI silicon supply chain.
The news landed alongside several other catalysts that reinforced the same theme:
- Semiconductor Industry ETF: up 2.68% to 581.51, its strongest session in over a week.
- Robotics and AI ETF: up 2.30% to 38.25.
- Samsung Electronics: Bloomberg reported the company is on course to post roughly an 18-fold surge in Q2 2026 operating profit, with AI-related memory demand cited as the primary driver.
- SK Hynix: pursuing a Nasdaq listing valued at approximately US$28-$29 billion, a structural signal of how much capital is chasing US-listed chip exposure.
- Communication Services led all sectors at +1.64%, with Information Technology second at +1.34%.
Each of those developments arrived in a single session. A supplier contract extension, an earnings projection that validates the AI memory thesis, a major Korean chipmaker pursuing a US listing, and institutional price target upgrades. That combination tells you smart money is still adding to AI infrastructure positions, not exiting them.
The SOX rally extension into July follows a Q2 2026 in which the Philadelphia Semiconductor Index gained 87.8%, its strongest quarter since inception, while simultaneously trading roughly 67% above its 200-day moving average, one of the largest dislocations on record for the sector.
Institutional conviction: Morgan Stanley’s chip-equipment upgrades
Morgan Stanley raised price targets on Lam Research, Applied Materials, and KLA, the three largest US-listed semiconductor equipment makers. These are the companies that build the machines used to manufacture chips, and the upgrades signal institutional conviction not just in near-term momentum but in the durability of the semiconductor capital equipment cycle itself.
What the breadth data is actually telling you
When you see “the S&P 500 gained 0.72%,” that figure is cap-weighted, meaning the largest companies by market value have the most influence on the number. Apple, Microsoft, Nvidia, and their peers can move the index significantly even if the majority of stocks go nowhere.
The equal-weighted version gives every stock the same 0.2% slice of influence. When it gains only 0.04% on the same session, the message is clear: the average company in the index barely participated.
6 of 11 S&P 500 sectors declined on the day the Dow hit a record high.
| Sector | Change (%) |
|---|---|
| Communication Services | +1.64% |
| Information Technology | +1.34% |
| Consumer Staples | Declined |
| Real Estate | Declined |
| Utilities | -1.06% |
| Health Care | -1.17% |
S&P 500 sector performance, 6 July 2026.
Narrow leadership is not automatically a sell signal. Concentration can persist for years when a powerful structural theme, in this case AI infrastructure spending, is driving it. But the specific risk is real: a reversal in just a handful of mega-cap names can drag the major indices sharply lower even if the majority of stocks are flat or positive. The Russell 2000’s modest +0.45% gain confirms limited small-cap participation.
NBER research on market breadth finds that narrow leadership rallies concentrated in a small number of large-cap names have historically been associated with elevated index-level drawdown risk when those leaders reverse, a dynamic directly relevant to the 68-basis-point gap between the cap-weighted and equal-weighted S&P 500 on Monday.
When six sectors fall on the same day as a record Dow close, you are not looking at a broad economic rally. You are looking at a tech-and-communications-led momentum trade that leaves the rest of the market behind.
Two strategists, two reads on where this goes
- John Stoltzfus, Oppenheimer: In commentary reported by CNBC, Stoltzfus argued that US equities can continue advancing through H2 2026 provided domestic economic conditions remain supportive, while acknowledging that bouts of volatility are likely along the way.
- Mike Wilson, Morgan Stanley: Wilson’s view, reported by Bloomberg, is that US equities could find it hard to push further into record territory, with investors potentially shifting capital out of semiconductor names and into hyperscalers, the large cloud and AI platform operators that have recently underperformed.
Stoltzfus’s view, reported by CNBC, is essentially that the market can keep climbing as long as the economy cooperates. Wilson’s view, reported by Bloomberg, is more specific: even if the AI theme holds, the names carrying it may change, and that transition creates choppiness.
Wilson’s rotation thesis: capital may shift from chipmakers toward hyperscalers, the companies building and monetising AI at scale, that have recently lagged semiconductor stocks in market performance.
According to a Bloomberg Markets Pulse survey, 53% of respondents indicated they intend to add to positions in conventional equities, a result that points to broadening doubts about a rally concentrated solely in AI names, though this survey finding has not been independently verified.
The honest takeaway when two credible institutional voices look at the same record high and reach opposite conclusions is that the directional call for H2 2026 is genuinely uncertain. Any position should be held with that uncertainty in mind.
Inside the AI trade: chips leading, hyperscalers lagging
Wilson’s rotation thesis deserves closer examination because it describes a shift that could happen within the AI trade rather than away from it.
Hyperscalers are the large cloud and AI platform operators, the companies that buy the chips, build the data centres, and sell AI services at scale. They have recently lagged chipmakers in market performance despite being the end-customers of the semiconductor build-out.
The logic runs as follows: if hyperscalers are seen as undervalued relative to chip suppliers, capital can rotate from one to the other without abandoning the AI theme entirely. But the index-level path becomes choppier as sector leadership changes. Broadcom’s 3.7% gain and the semiconductor ETF’s 2.68% advance show chips are still the current leaders. SK Hynix’s pursuit of a US listing confirms how much capital is still chasing chip exposure specifically.
The AI capex-to-revenue lag identified by Morningstar analyst Dennis Li, running approximately 18-24 months between hyperscaler investment commitments and measurable revenue returns, is one structural reason the rotation from chipmakers to cloud platform operators may be less straightforward than the valuation gap implies.
If rotation materialises, here are the markers to watch:
- Semiconductor ETF underperformance relative to hyperscaler names over consecutive sessions.
- Hyperscaler stocks outperforming on earnings or guidance beats.
- The gap between equal-weighted and cap-weighted S&P 500 performance narrowing as leadership broadens.
For readers in passively managed large-cap tech funds, a rotation of this kind would not necessarily be bearish. But it would mean more volatility and less semiconductor-driven momentum than the first half of 2026 delivered.
What the second half of 2026 needs to prove
The Dow above 53,000 is a milestone. Whether it holds is a question the market’s internals will answer more honestly than the headline number.
A healthier advance in H2 2026 would require meaningfully better participation from cyclicals, defensives, and small and mid caps. The Russell 2000 at 3,009.54, up just 0.45%, shows tentative interest outside mega-cap tech, but nothing close to a genuine broadening signal.
Market leadership rotation away from US tech names carries a long historical shadow: the Nifty Fifty, Japan Inc., and the dot-com era each saw the dominant cohort deliver annualised returns roughly 3-5 percentage points below the broad global market over the subsequent decade, according to BlackRock Investment Institute research.
Three forward-looking signals worth tracking:
- Equal-weighted vs cap-weighted S&P 500 convergence: the 0.04% vs 0.72% gap needs to narrow for the rally to be considered broad-based.
- Russell 2000 sustained outperformance: small caps leading over multiple sessions, not just participating modestly on a record day.
- Sector leadership broadening beyond Communication Services and Information Technology: at least three or four sectors consistently positive on up-days.
Stoltzfus at Oppenheimer sees conditional upside if fundamentals cooperate. Wilson at Morgan Stanley expects choppiness and higher sector dispersion. Both views are plausible. For anyone holding broad US equity exposure, the second half of the year will be defined not by whether the Dow stays above 53,000 but by whether the rest of the market catches up to the companies that got it there.
This article is for informational purposes only and should not be considered financial advice. Investors should conduct their own research and consult with financial professionals before making investment decisions. These forward-looking assessments are speculative and subject to change based on market developments and company performance.