What the Broadcom Drop Reveals About AI Stock Valuations Now
8 hrs ago

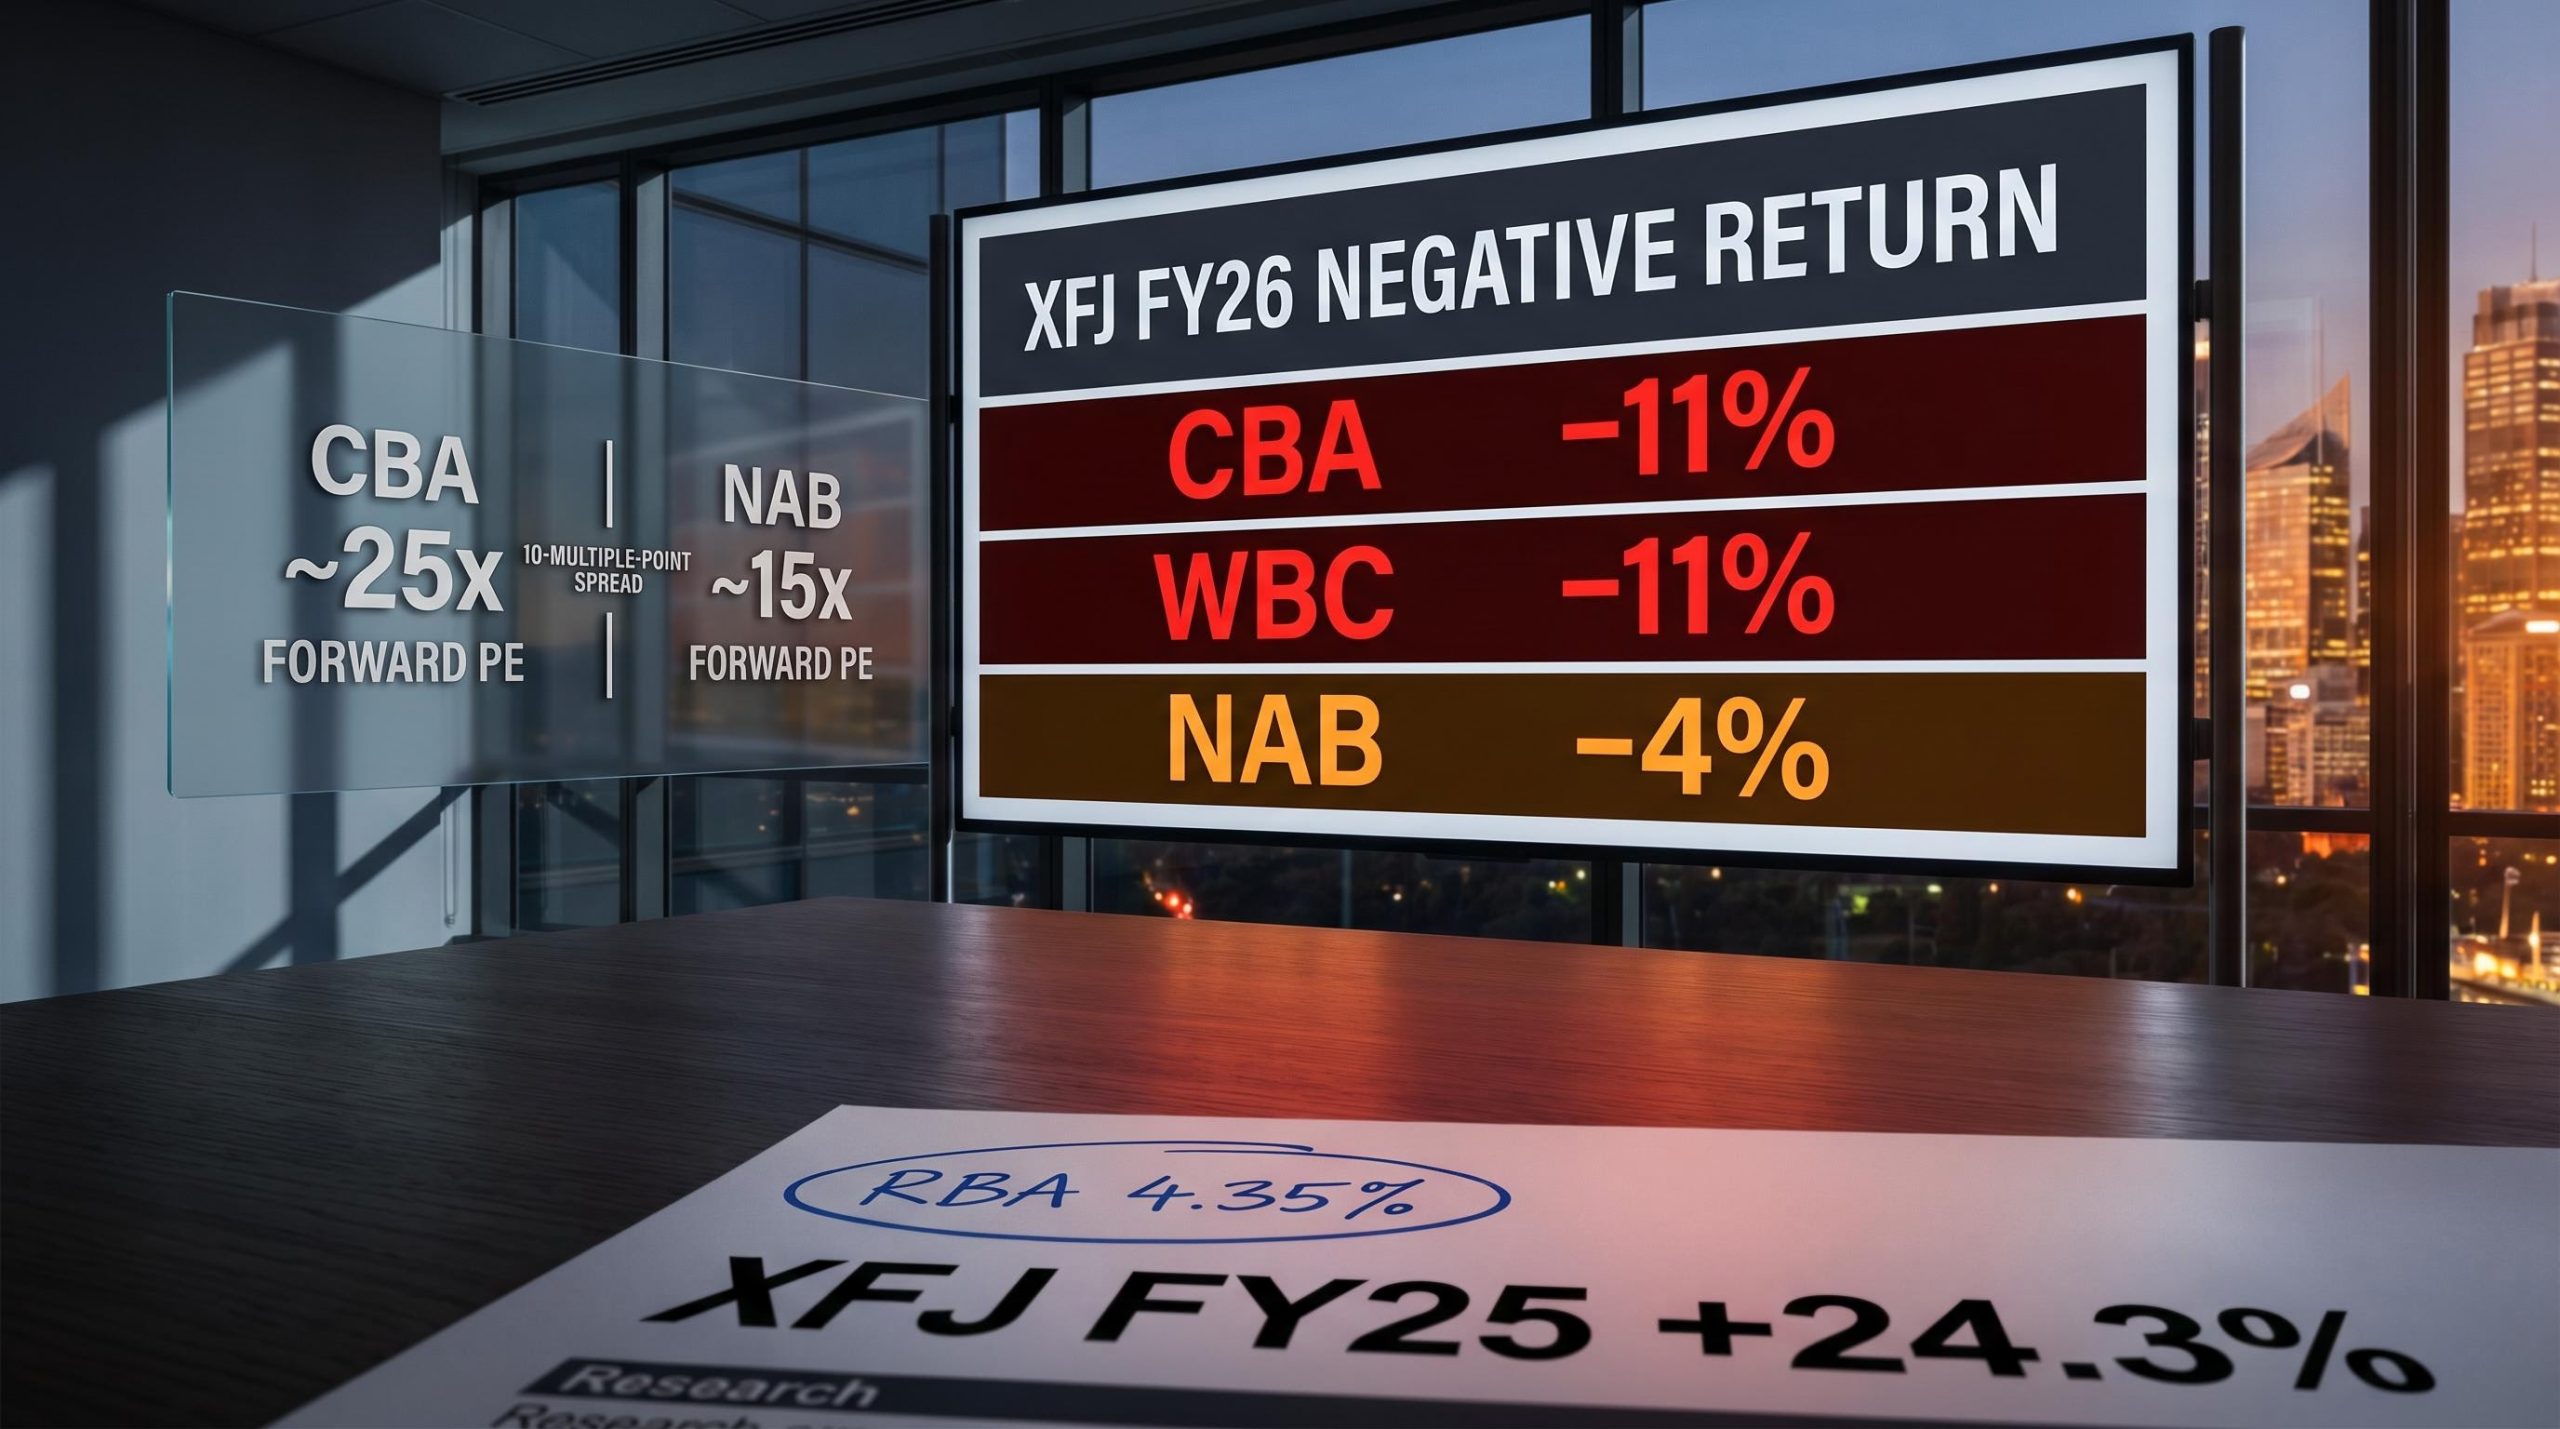
The sector that topped the ASX 200 in FY25 with a 24.3% gain became one of its worst performers in FY26. The XFJ closed the financial year in the red, with Commonwealth Bank of Australia shares surrendering around 11% of the 45% advance that had pushed the stock to a record $192 only months before.
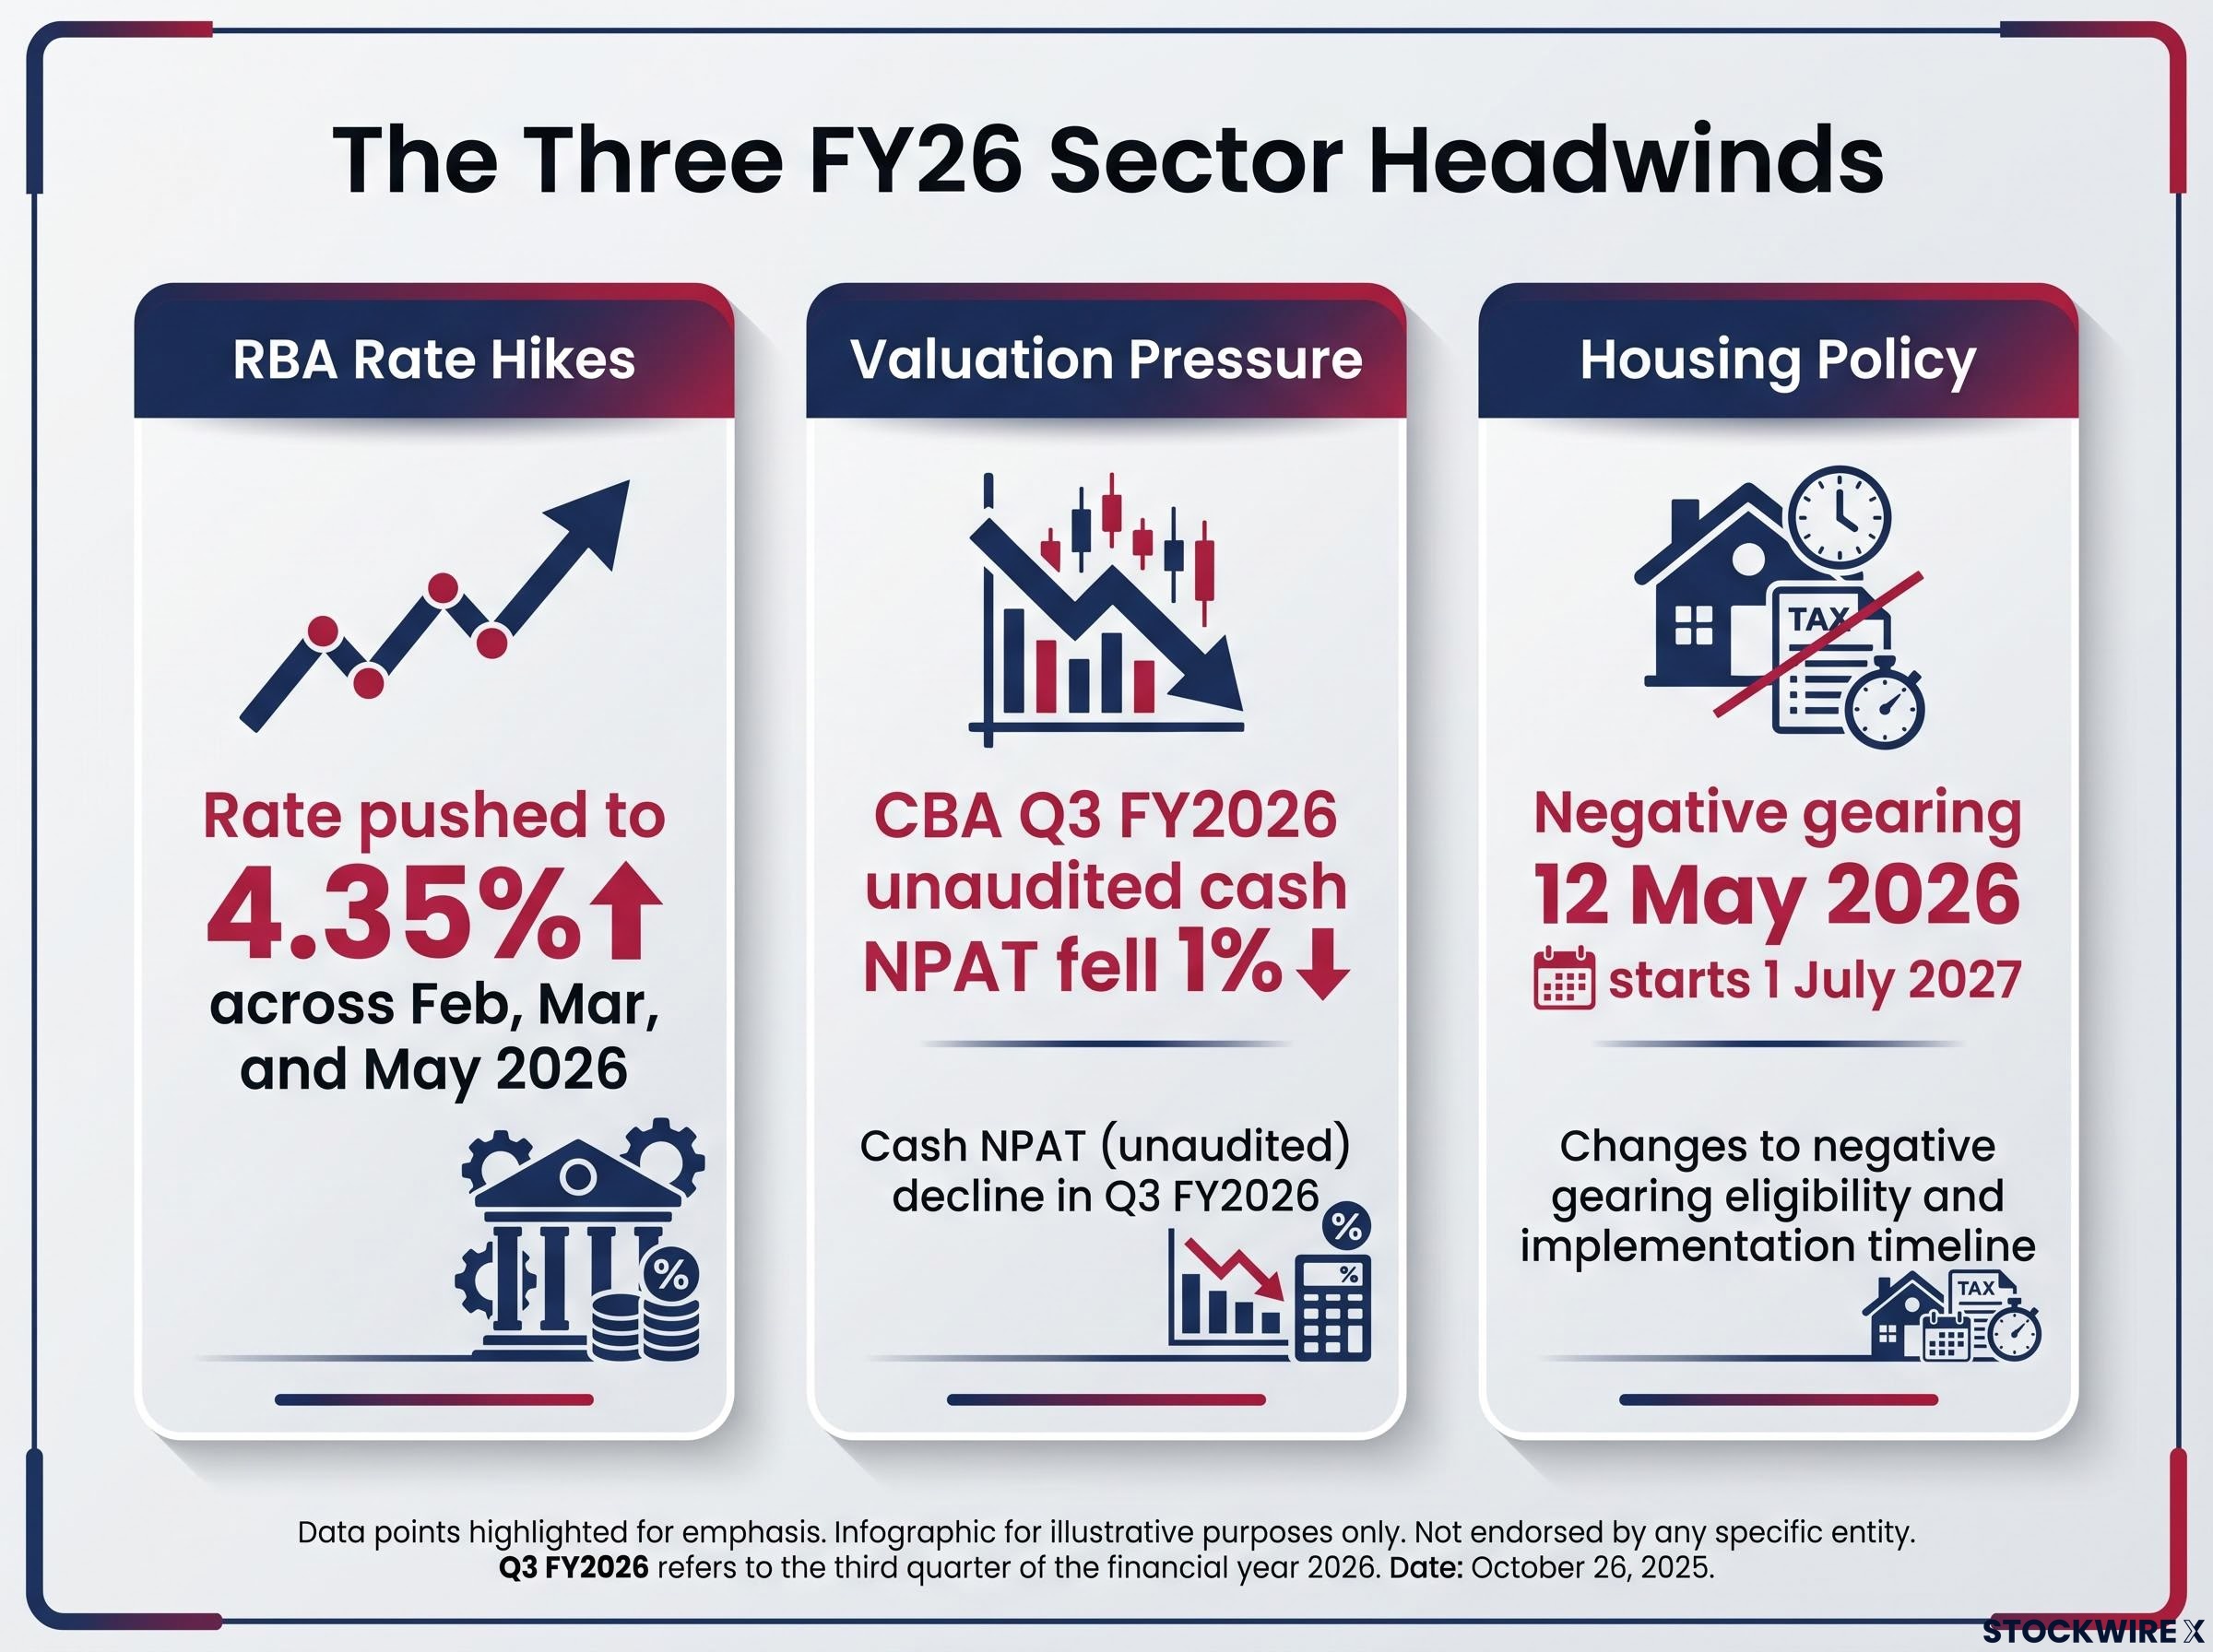
That reversal was not random, and it was not driven by a single bad quarter. Three structural forces converged at once: an RBA tightening cycle that restarted when most investors assumed it was over, valuations that had priced in perfection on the back of FY25 gains, and a federal housing-policy change that targeted the banks’ most profitable lending segment.
Here is a framework for assessing whether those same headwinds persist into FY27 or whether conditions are shifting enough to warrant a fresh look at your financials exposure. The answer depends on which bank you hold, and the difference is larger than most retail investors realise.
In FY25, the XFJ rose 24.3% to claim top spot across all eleven ASX 200 sectors. CBA was the standout performer, surging 45% over the year to close at $185 after briefly touching a record $192. By any measure, it was the trade of the financial year.
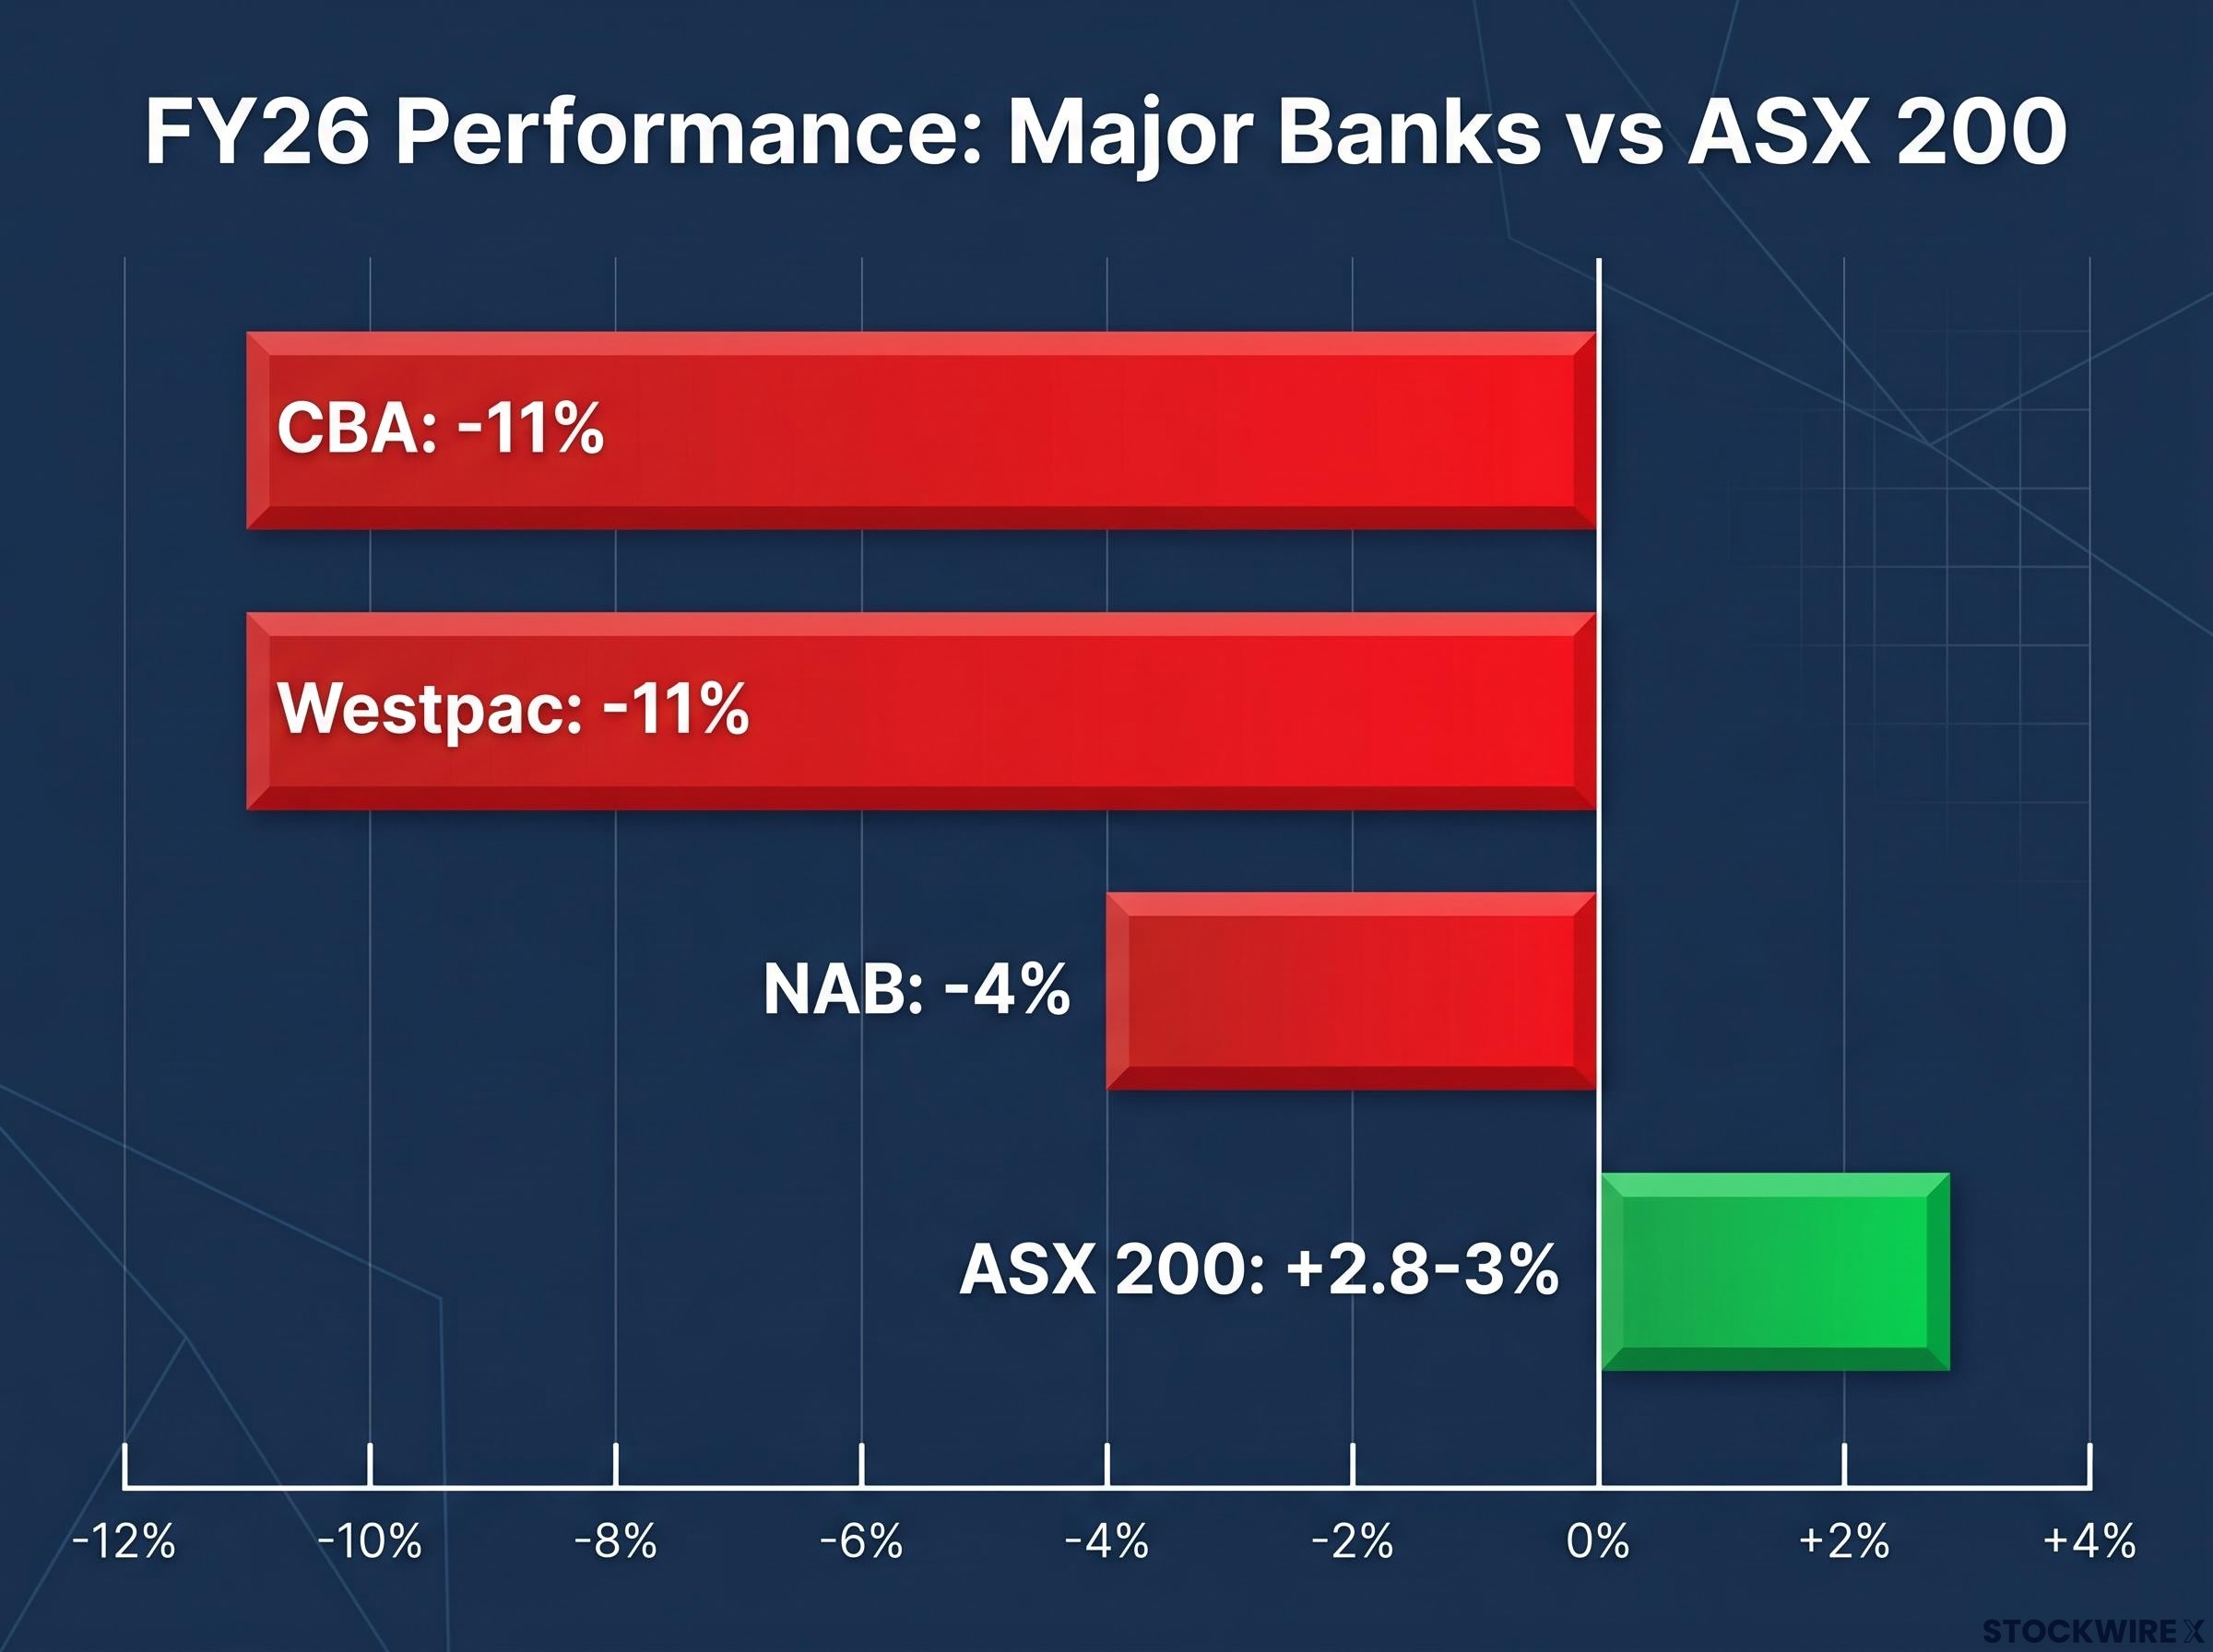
FY26 dismantled that trade. The XFJ ended the year with a negative return while the broader ASX 200 eked out a gain of around 2.8-3%, with resources stocks doing the heavy lifting rather than the banks. The three major banks all posted declines:
The financials index went from first among eleven ASX 200 sectors in FY25 to a negative-return laggard in FY26.
This was not a routine sector rotation. It was the structural unwinding of a valuation premium that had become disconnected from underlying conditions, and understanding why it happened is the precondition for judging whether it is over.
Each of the three headwinds was damaging on its own. Their simultaneous arrival is what converted a correction into a sector-wide derating.
| Headwind | What happened | Market impact |
|---|---|---|
| RBA rate hikes | The RBA moved rates higher at three successive meetings in February, March, and May 2026, pushing the cash rate to 4.35%, a level not seen since late 2011. The June 2026 meeting delivered no change. | Heightened mortgage stress, suppressed credit demand, analyst focus shifted from margin expansion to credit losses. |
| Valuation overextension | CBA began FY26 trading at close to 26 times forward earnings, leaving almost no margin for earnings to disappoint. Its Q3 FY2026 trading update then reported flat operating income alongside a 1% fall in unaudited cash NPAT. | Stocks priced for perfection that then miss elevated expectations tend to correct sharply. Morgan Stanley applied underweight or sell recommendations to several majors. |
| Negative gearing changes | Tax benefit abolished for newly purchased established properties after the 12 May 2026 cut-off, with implementation from 1 July 2027. | Targeted investor borrowers, a key profit pool. Uncertainty injected into housing investment and bank credit growth. |
The rate hikes arrived when banks were already carrying stretched multiples. Then the negative gearing announcement landed on top, removing a growth driver that had been priced into earnings forecasts.
Jarden analyst Matthew Wilson estimated the negative gearing restrictions could reduce housing credit growth by as much as 25%.
According to CBA’s own internal economics team, the policy was expected to push dwelling prices around 3% below the level they would otherwise have reached, prompting a revision to their December 2026 price growth forecast from 5% down to 3%.
The negative gearing quarantine on established residential properties took effect immediately for purchases after the 12 May 2026 cut-off, with no transition window, meaning investor loan pipelines were already divided into protected and exposed positions before a single piece of enabling legislation had been tabled.
No single headwind was fatal in isolation. But their overlap meant there was no offsetting tailwind available, which explains why the derating was sharper and more sustained than most forecasters anticipated. For investors assessing whether those forces are abating in FY27, the critical question is whether any of the three has decisively reversed. So far, none had by the start of the new financial year.
Most retail investors operate on a simple model: higher rates mean bigger profits for banks. The FY26 evidence dismantled that assumption.
Net interest margin (NIM) is the difference between what a bank earns on loans and what it pays on deposits. When rates rise, loan repricing typically happens faster than deposit repricing, which temporarily widens the spread. That is the theory, and it held for the early stages of the rate cycle.
In practice, three countervailing forces dominated as FY26 progressed:
Rate hikes arrived faster than banks could reprice deposits. Then deposit competition intensified as customers shifted to higher-rate savings products. Analysts flagged this dynamic explicitly, shifting from buy to hold or underweight on multiple majors as the year progressed. The focus moved from NIM expansion to credit-quality risk.
Any investor thesis built on “rates are high, therefore buy banks” is incomplete and potentially dangerous in a late-cycle environment. Banks are not simple beneficiaries of higher rates, and FY26 proved it.
The RBA Bulletin analysis of bank funding costs during the tightening cycle documented that funding costs rose faster than lending rates in several periods, providing empirical grounding for why the simple assumption that higher rates uniformly benefit bank margins failed to hold in practice.
“Buying banks” is not a single decision. It is three separate risk-reward assessments, and the differences are material.
CBA trades at approximately 25 times forward earnings entering FY27. NAB trades at roughly 15 times. That 10-multiple-point gap is not a valuation curiosity; it signals which macro scenario each bank is priced for.
CBA carries the premium multiple, justified by its dominant retail and mortgage franchise. It also carries the greatest exposure to the negative gearing policy shift due to its concentration in investor home loans. At 25 times forward earnings, steady, not spectacular, results are required simply to justify the price. Any sustained rise in mortgage arrears or a sharper-than-expected slowdown in investor lending would challenge that multiple directly.
The bank valuation metrics professionals apply first, net interest margin, return on equity, and CET1 capital adequacy, tell a different story about CBA’s premium than a forward PE ratio alone: NAB’s H1 2026 ROE of 15.2% sits above CBA’s 13.1% on that measure, yet NAB trades at nearly a 10-multiple discount, a gap that requires examining all three metrics together to explain.
NAB sits at the opposite end of the valuation spectrum. Its heavier skew to business and SME lending means its risk profile is tied to corporate cash flows rather than housing. Fairmont Equities’ Michael Gable held a sell rating on NAB shares, with his view being that the stock’s valuation remained stretched even after a considerable share price fall, leaving meaningful downside exposure. If tight monetary policy feeds through to weaker business revenues, NAB could see rising impairments in its commercial book even if housing arrears stay contained.
According to its 1H26 results, Westpac had residential mortgage assets accounting for roughly 69% of its total loan book, giving it the heaviest concentration among the majors and the greatest direct sensitivity to shifts in housing market conditions. That concentration offers leverage to any housing recovery, but also the greatest sensitivity to any deterioration in arrears or house-price expectations.
| Bank | Forward PE | Primary lending exposure | Key FY27 risk | Broker stance |
|---|---|---|---|---|
| CBA | ~25x | Retail mortgages, investor home loans | Mortgage arrears, negative gearing impact on investor lending | Multiple underweight/sell ratings |
| NAB | ~15x | Business and SME lending | Corporate and SME arrears in a slowing economy | Sell (Fairmont Equities); cautious broker consensus |
| WBC | Mid-range | Residential mortgages (69% of loan book) | Housing cycle deterioration, forced sales in metro markets | Mixed; housing-cycle dependent |
The 10-multiple-point gap between CBA and NAB is a signal about which macro scenario each bank is priced for. If you hold undifferentiated “financials exposure,” you are carrying very different underlying risks depending on the mix.
The diagnosis is clear. The forward question is whether the same forces persist. These five signals form a structured monitoring framework rather than a vague “watch this space.”
For investors who want to stress-test the credit quality signal in more detail, our full explainer on CBA’s Q3 arrears data covers the $200 million provision top-up, the 30-basis-point spike in personal loan arrears, and how the RBA’s own unemployment projections map onto the deterioration already visible in May 2026.
The RBA rate path and negative gearing data are macro-level signals that affect the entire sector simultaneously. Arrears data, dividend guidance, and competitive positioning are bank-specific signals that differentiate outcomes between CBA, NAB, and Westpac.
At the start of FY27, all three headwinds that weighed on the sector through FY26 remained unresolved. That tells you this is not yet a “value buy” setup requiring only patience. It is an active monitoring situation where the timing of recovery is genuinely uncertain and position sizing matters.
Across FY26, CBA lost around 11%, NAB gave back roughly 4%, and Westpac fell approximately 11%, with the XFJ finishing in negative territory as the ASX 200 posted a modest gain of around 2.8-3%. The question is what comes next, and the honest answer is that it depends on three conditions, none of which had been met at the start of FY27.
A durable sector recovery requires:
Until at least one of these shifts decisively, caution on sector valuations remains warranted. The valuation divergence between CBA at 25 times forward earnings and NAB at roughly 15 times means the risk-reward calculus is different depending on which bank you hold and which macro scenario you assign higher probability to.
Your job as an investor is not to make a single directional call on “banks.” It is to track the five signals from the previous section, assess which scenario is unfolding, and size your exposure accordingly. The answer for someone holding CBA at 25 times earnings is fundamentally different from the answer for someone considering NAB at 15 times.
This article is for informational purposes only and should not be considered financial advice. Investors should conduct their own research and consult with financial professionals before making investment decisions. Past performance does not guarantee future results. Financial projections are subject to market conditions and various risk factors.
Three forces hit simultaneously: the RBA hiked rates to 4.35% across three successive meetings, bank valuations had been stretched to unsustainable multiples after FY25 gains, and the federal government abolished negative gearing for newly purchased established properties after 12 May 2026, targeting a key profit pool for lenders.
Net interest margin is the difference between what a bank earns on loans and what it pays on deposits; while rising rates initially widen that spread, in FY26 deposit competition intensified, credit demand slowed, and impairment risk grew, meaning the theoretical margin benefit was offset by these countervailing forces.
CBA enters FY27 trading at approximately 25 times forward earnings while NAB trades at roughly 15 times, a 10-multiple-point gap that reflects different macro scenarios being priced in and means the risk-reward calculus for each stock is fundamentally different.
Jarden analyst Matthew Wilson estimated the restrictions could reduce housing credit growth by as much as 25%, and CBA's own economics team forecast dwelling prices would be around 3% lower than they would otherwise have reached, with the policy taking full effect from 1 July 2027 for properties acquired after the 12 May 2026 cut-off.
The five key signals are the RBA rate path from the 11 August 2026 meeting onward, quarterly arrears and credit quality data, investor loan approvals and housing market activity tracking the negative gearing implementation, FY27 dividend guidance on payout ratios, and any shifts in regulatory or competitive conditions affecting bank margins.