
The US Dollar Index has climbed roughly 6% in two weeks, running from a September low near 95.60 on 9 September 2026 to almost 101.40 by 24 September. Then it stopped. Sitting near 101.62 at the 29 September close, the index has stalled just short of a cluster of resistance running from 101.97 to 102.86, and the question facing traders now is whether the move has one more leg in it or whether the easy gains are already banked.
That move matters well beyond the currency desk. A dollar surge of this scale compresses EUR/USD and GBP/USD, reprices commodity-linked currencies like the Canadian dollar, and reshapes the risk maths for anyone holding cross-border assets. This is not an abstract charting exercise; it touches real portfolios.
Here is what the chart structure actually tells you about where these pairs sit, and where the signals hit hard limits you need to understand before acting on them. Across the dollar index and three major pairs, this is a structured, honest read on each setup, not a prediction dressed up as certainty.
How far the dollar has run, and where the walls are
The rally that took the index here was fast and policy-driven. The Federal Reserve raised rates by a quarter point on 16 September 2026, and DXY responded by climbing from around 98.61 to near 101.0 within roughly two weeks. That single scheduled decision did most of the heavy lifting.
The DXY breakout above 100 in mid-September was driven by three forces arriving simultaneously: a unanimous Fed hike to 3.75-4.00%, a 30-basis-point upward revision to the dot-plot median, and Middle East geopolitical risk that layered safe-haven demand on top of an already yield-differential-driven move.
The structural setup behind the move goes back further. According to technical analysis from Drew Dusik at Verified Investing, DXY broke out of a rising parallel channel that had contained price since August 2024, with the breakout landing in June 2025. Price paused briefly at the channel boundary, then pushed higher, which is the pattern that eventually delivered the September surge.
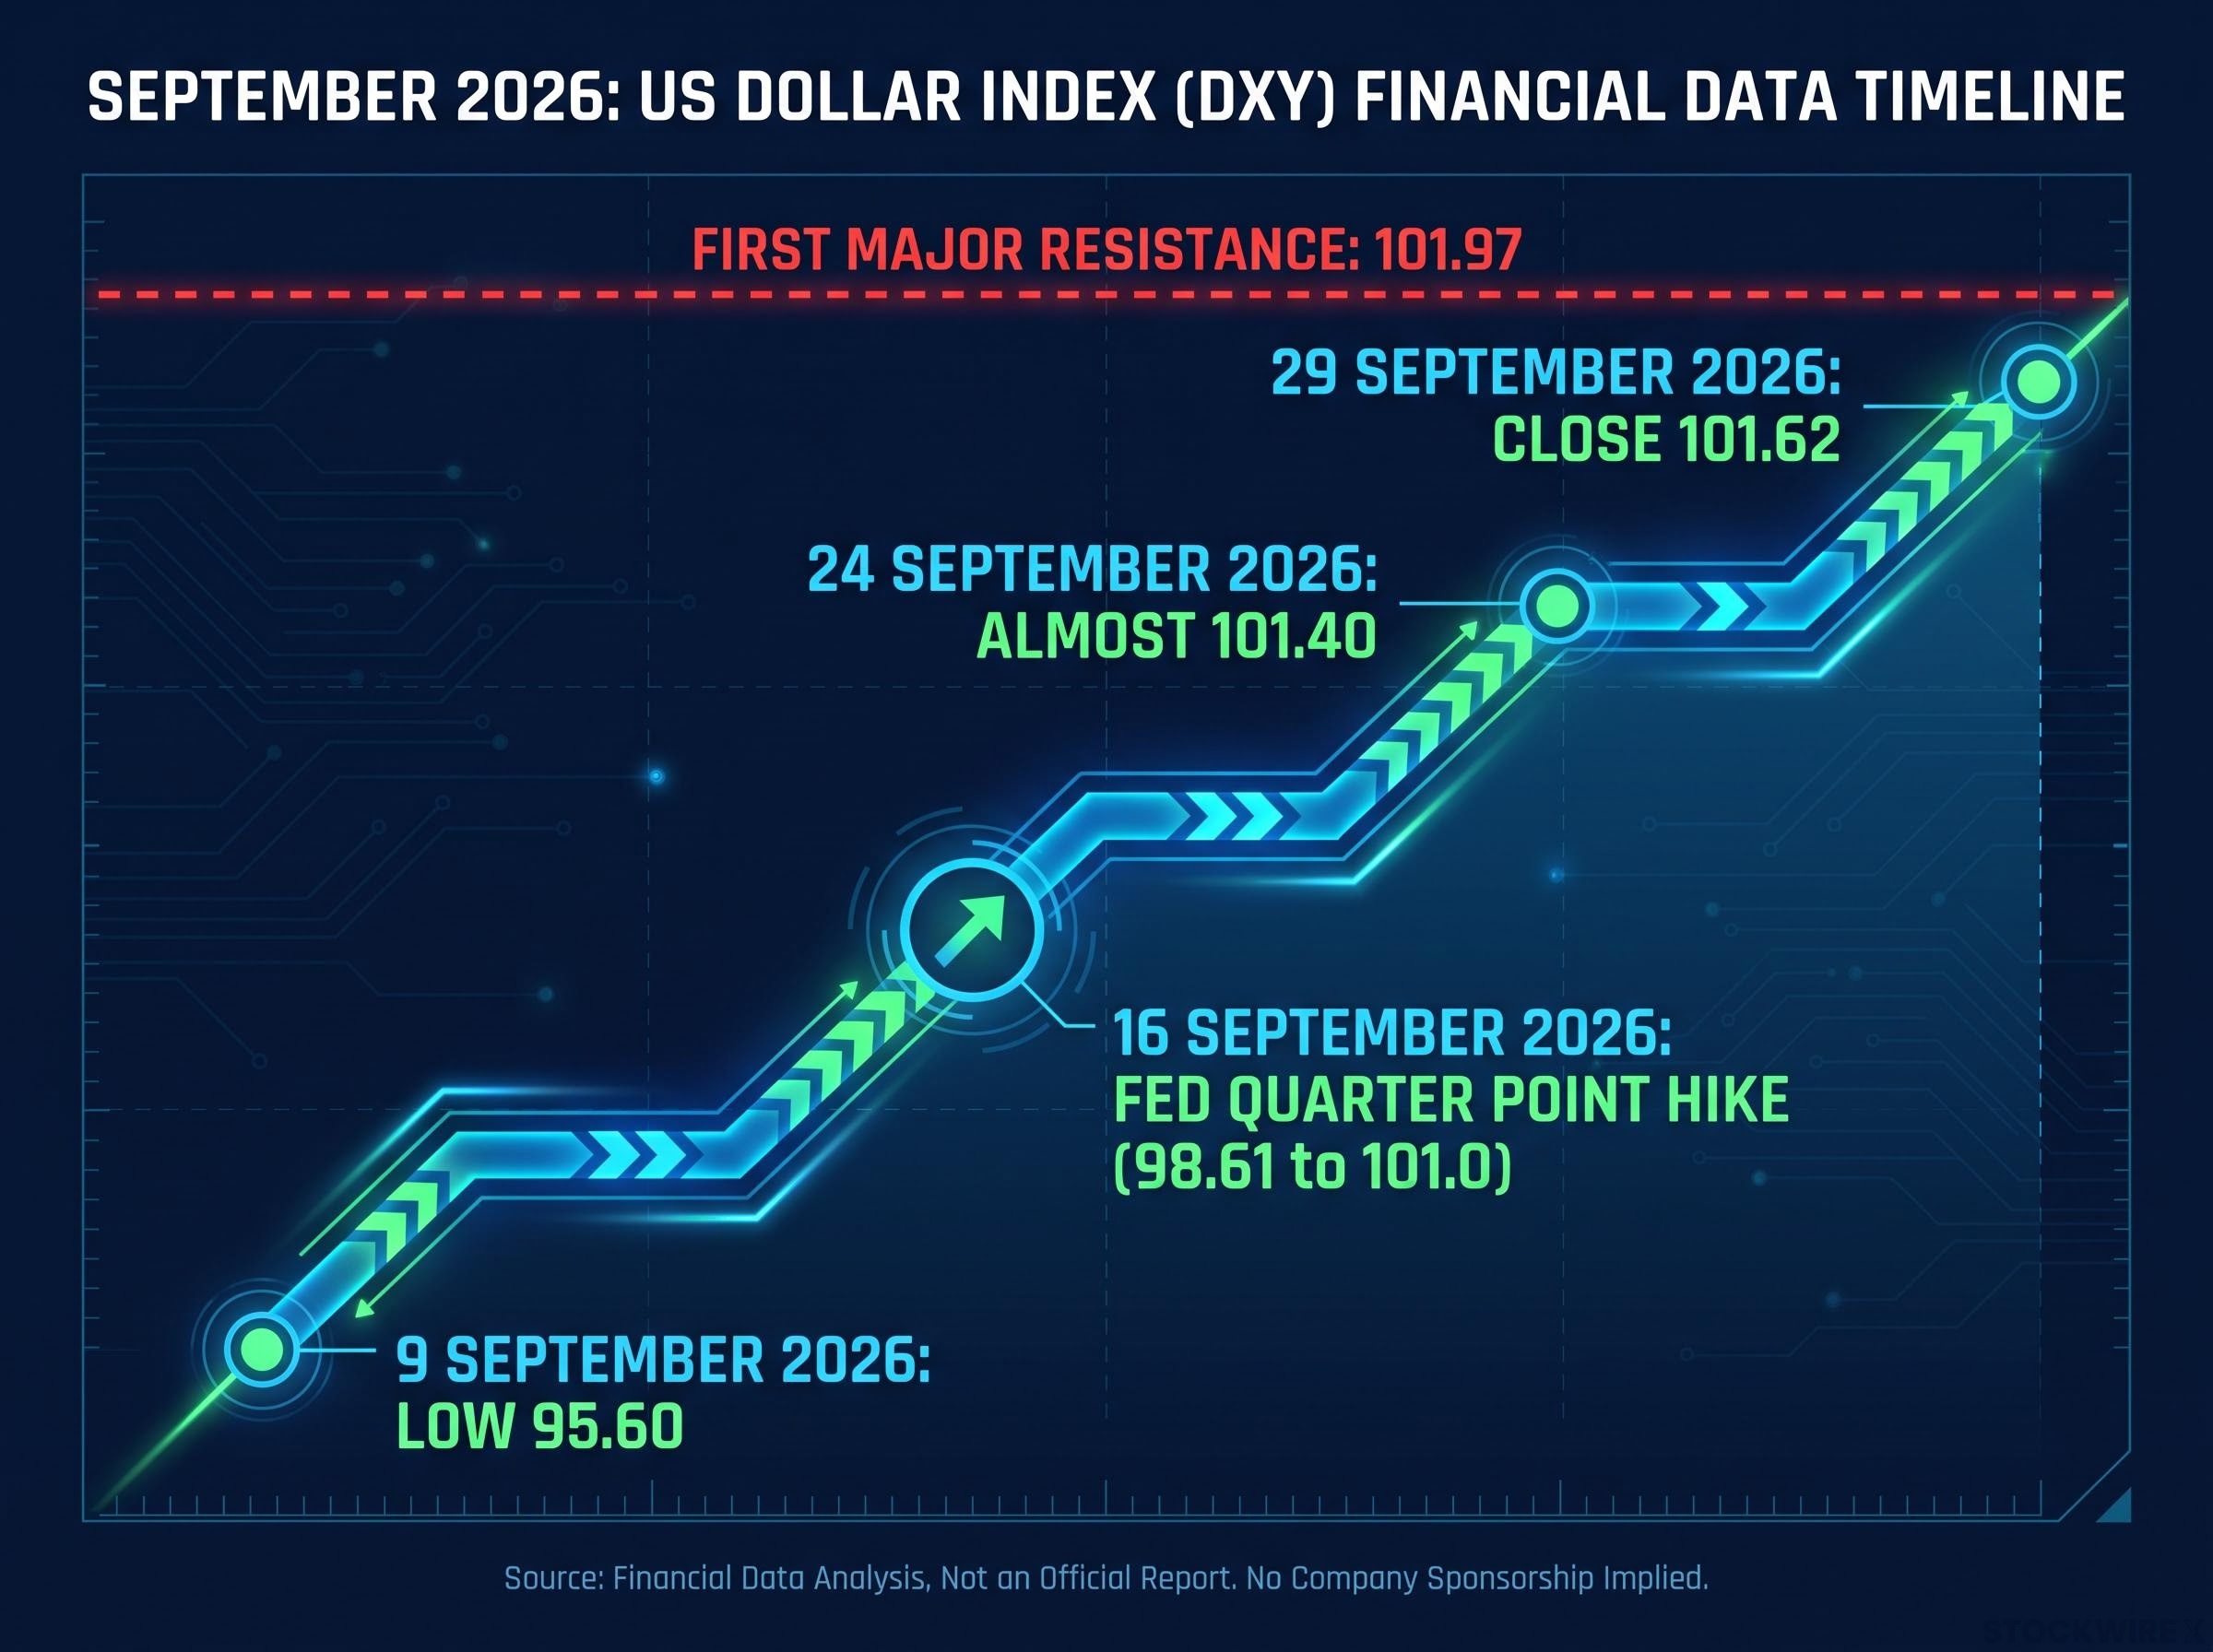
Here is the interpretive point. The double-bottom measuring objective near 101.20 has already been met as of late September, and the index is stalling below its first major resistance. That tells you the easy part of this rally is done: the next move higher needs a genuine catalyst, not just continuation of existing momentum.
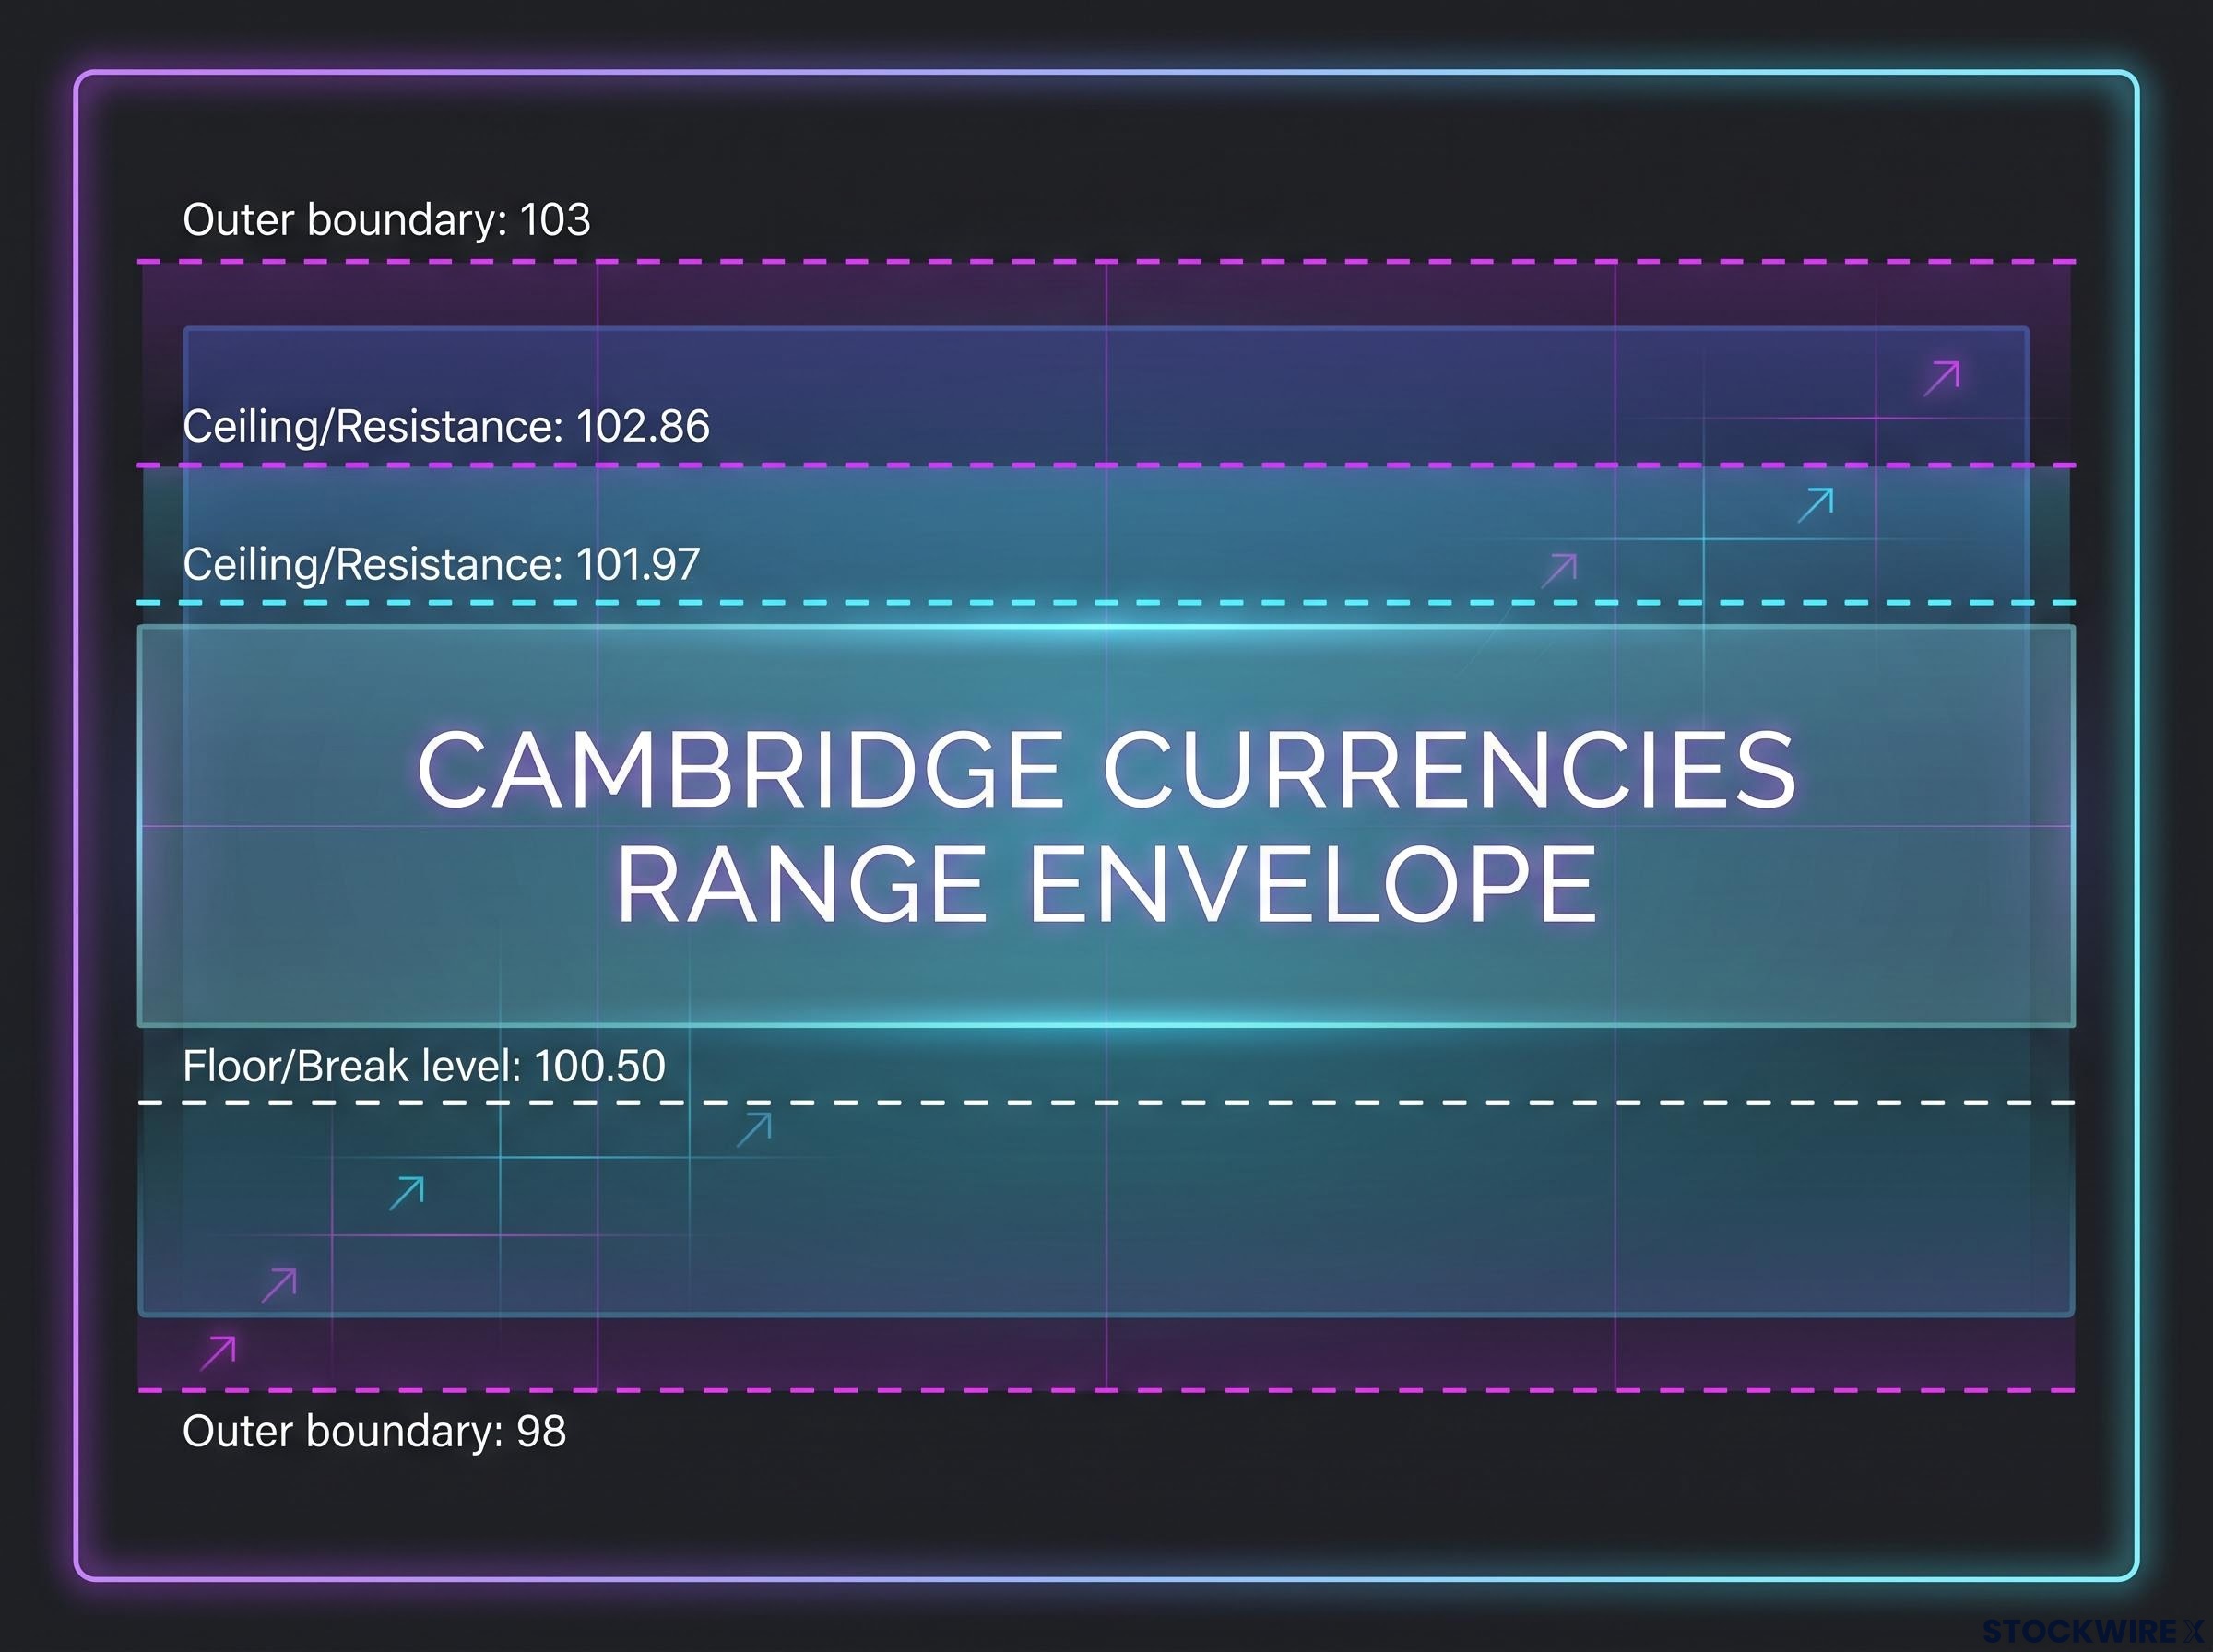
The likely trading envelope Cambridge Currencies forecasts DXY to oscillate in a 98 to 103 range over the next six months. Treat those figures as the outer boundaries of the environment, not a directional call.
The resistance cluster that matters now
The two levels directly ahead are worth understanding as a zone rather than isolated lines:
- 101.97: a pivotal level matching the prior swing high from May 2025, the first real ceiling.
- 102.86: secondary resistance aligning with a major Fibonacci retracement zone, the level a breakout would test next.
Because the swing high and the Fibonacci retracement converge in a narrow band, any push through the first invites a test of the second in quick succession. There is precedent for interruption, though. Dusik noted an earlier breakout attempt failed following Japanese carry trade unwinding, a reminder that non-technical forces can stall dollar strength without warning.
When big ASX news breaks, our subscribers know first
EUR/USD and GBP/USD: reading two pairs under pressure
The euro and sterling are variations on the same dollar story, but they are not behaving identically, and the differences do the analytical work here.
| Pair | Current Level | Key Support Target | RSI Signal at Analysis |
|---|---|---|---|
| EUR/USD | ~1.1355 (29 Sep 2026) | ~$1.11 (Fibonacci) | 24.63 (oversold) |
| GBP/USD | ~1.32 (late Sep 2026) | $1.30 (chart bottom) | Near-term oversold, holding |
The original Verified Investing analysis anticipated EUR/USD consolidating in a bearish flag before the next leg toward Fibonacci support near $1.11. The daily RSI had hit an extreme reading of 24.63, deep in oversold territory.
EUR/USD oversold conditions in late September drew convergent analysis from three separate institutional frameworks, all identifying the 1.1353-1.1365 zone as the floor, yet all three simultaneously flagged that a 14-day RSI of 36 alongside all-SELL moving average configurations means the oversold reading itself carries no standalone reversal signal.
What 24.63 actually signals An RSI this low points to short-term selling exhaustion, not a durable floor. It marks a pause, not a buy signal.
Sterling was holding up better. At the time of Dusik’s analysis, GBP/USD sat above its equivalent pivot lows, with $1.30 identified as the key support, a level that coincides with a prior chart bottom and the upper boundary of the 2024 consolidation range. That level carries weight across multiple cycles, from the 2016 Brexit era through the 2018 and 2022 dollar phases.
Both pairs currently trade above those targets: EUR/USD around 1.1355 per the ECB reference rate on 29 September 2026, and GBP/USD near 1.32 per Financial Times data. That tells you the dollar’s pressure on these pairs has not fully played out. Those supports at $1.11 and $1.30 remain live downside references for any renewed dollar strength, not levels already tested and cleared.
What RSI and Fibonacci levels actually tell you in a dollar cycle
The intuitive read is that oversold means a bounce is coming. In a sustained dollar bull cycle, that instinct is often wrong. Two definitions clear the ground first:
- RSI (Relative Strength Index): a momentum indicator that measures the speed and size of recent price changes. Readings below 30 are conventionally called oversold; above 70, overbought.
- Fibonacci retracement: price levels derived from the Fibonacci number sequence that chartists use to identify where a pair may find support or resistance after a large move.
Fibonacci retracement levels work in part because collective trader recognition creates self-reinforcing price behaviour at key zones, which is why the 61.8% level carries particular weight as both a support threshold and a stop-loss anchor in sustained trend environments like the current dollar cycle.
History complicates the simple reading. During the 2014 to 2015 dollar bull cycle, EUR/USD fell from around 1.40 to near 1.05. RSI repeatedly entered oversold territory, and Fibonacci supports acted as temporary pauses rather than reversal triggers, because Fed tightening and ECB quantitative easing dominated the fundamentals.
Sterling told the same story after 2016. GBP/USD dipped into oversold readings across the 1.30 to 1.20 range without producing durable reversals, as political and UK-specific risks kept the trend biased lower.
What that tells you is straightforward. An RSI below 30 or a Fibonacci support is a reason to watch carefully, not a reason to act automatically. The macro environment decides whether those signals produce a bounce or merely a pause before the next leg down, which is exactly why Cambridge Currencies frames the current DXY setup as range-bound within 98 to 103 rather than cleanly trending.
USD/CAD: the bullish outlier with a ceiling to clear
The Canadian dollar pair is where the original bullish thesis stays most structurally intact. At the time of Dusik’s analysis, USD/CAD had posted a series of consecutive bullish candles driven by broad dollar strength.
The RSI readings are the tell. Daily RSI sat at 75.2, firmly overbought, but weekly RSI had not yet reached 70. That split matters: a near-term pause is overdue and healthy, but the medium-term structure has not yet exhausted its bullish momentum.
The ideal path from here runs through consolidation:
- Current position: near $1.42, sitting at the identified consolidation zone.
- Consolidation requirement: sideways price action allowing daily RSI to normalise before the next push.
- Next target: approximately $1.45, the level that marks the next meaningful step higher.
Reading an RSI of 75.2 Overbought does not mean reversal. It signals a pause is likely, which is precisely why the consolidation scenario, not an immediate turn lower, is the constructive setup for the bulls.
One honesty note on the current level. No directly published USD/CAD spot quote from a named outlet was located for late September 2026. The $1.42 figure is a derived cross-rate, calculated from ECB data showing EUR/USD at 1.1355 and EUR/CAD at 1.6101 on 29 September 2026. It aligns neatly with the consolidation zone, but treat it as an estimate.
This matters beyond the forex desk. A stronger US dollar against the loonie has direct implications for Canadian exporters and for corporate earnings reported in Canadian dollars, so the $1.45 target is a level worth watching if you hold Canadian equities or commodity exposure.
Where technical analysis stops and macro risk begins
Here is the honest reckoning the chart levels demand. The biggest dollar moves in this cycle came from macro events, not from Fibonacci lines resolving.
Three forces can override any technical setup:
- Fed policy: rate decisions and forward guidance can shift the dollar’s trajectory regardless of RSI or Fibonacci readings, as the 16 September decision demonstrated.
- Inflation and labour data surprises: an unexpected print can reverse dollar strength even from an overbought position.
- Carry trade dynamics: the earlier DXY breakout attempt failed when yen stabilisation flows converted dollars into euros, undermining the move entirely.
The practical implication is direct. The September rally from 95.60 to 101.40 was triggered by a rate decision, not by a chart pattern resolving. That means the next major move is more likely to be event-driven than technically telegraphed, and holding large directional dollar positions without watching the macro calendar is a risk management problem, not just a chart-reading one.
The clearest top signal A sustained break below the 100.50 area would suggest a DXY top is forming. Above it, the range holds.
So the sensible stance for retail exposure is to use technical levels as entry and exit refinement tools inside a macro-aware framework. For genuine currency exposure, partial hedging via forwards or options is more reliable than trying to time exact tops and bottoms, and holding multiple highly correlated short-dollar positions at once concentrates risk unnecessarily.
This article is for informational purposes only and should not be considered financial advice. Investors should conduct their own research and consult with financial professionals before making investment decisions. Past performance does not guarantee future results. Financial projections are subject to market conditions and various risk factors.
Trading the range, not the breakout
Pull the evidence together and the picture sharpens. Resistance at 101.97 and 102.86 sets the ceiling. The 100.50 break level marks the floor of the current range. Cambridge Currencies’ 98 to 103 band is the outer envelope. This is a market built for range trading, not a simple continuation trade with the trend.
Three variables would change that view:
- A sustained DXY close above 101.97: shifts the bias toward continuation and opens the path to 102.86.
- A Fed pivot signal or soft inflation print: shifts the bias toward reversal, with 100.50 as the confirmation level.
- A renewed yen carry trade unwind: a wildcard that can move the dollar fast and without technical warning.
Treat the pair-specific levels the same way. EUR/USD at $1.11, GBP/USD at $1.30, and USD/CAD at $1.45 are conditional targets, not inevitable destinations. Structure positions with defined risk around them.
A market that has already met its double-bottom objective and stalled at first resistance is telling you to trade the boundaries, not chase the momentum. The information edge now lies in watching whether 101.97 holds or breaks.
For investors wanting to see how these dollar-cycle dynamics manifest simultaneously across EUR/USD, GBP/USD, USD/JPY, and USD/CNY, our full explainer on forex chart compression signals examines how four major pairs compressing at the same time points to a shared macro inflection rather than four separate chart stories.