#
USD/CAD has crossed 1.4200 for the first time since early July, pulled back twice from that level in a single session, and is now sitting on a six-day rally base with momentum indicators at near-historic overbought extremes. That is not a stable position. Something is about to give, and the catalyst is already on the calendar.
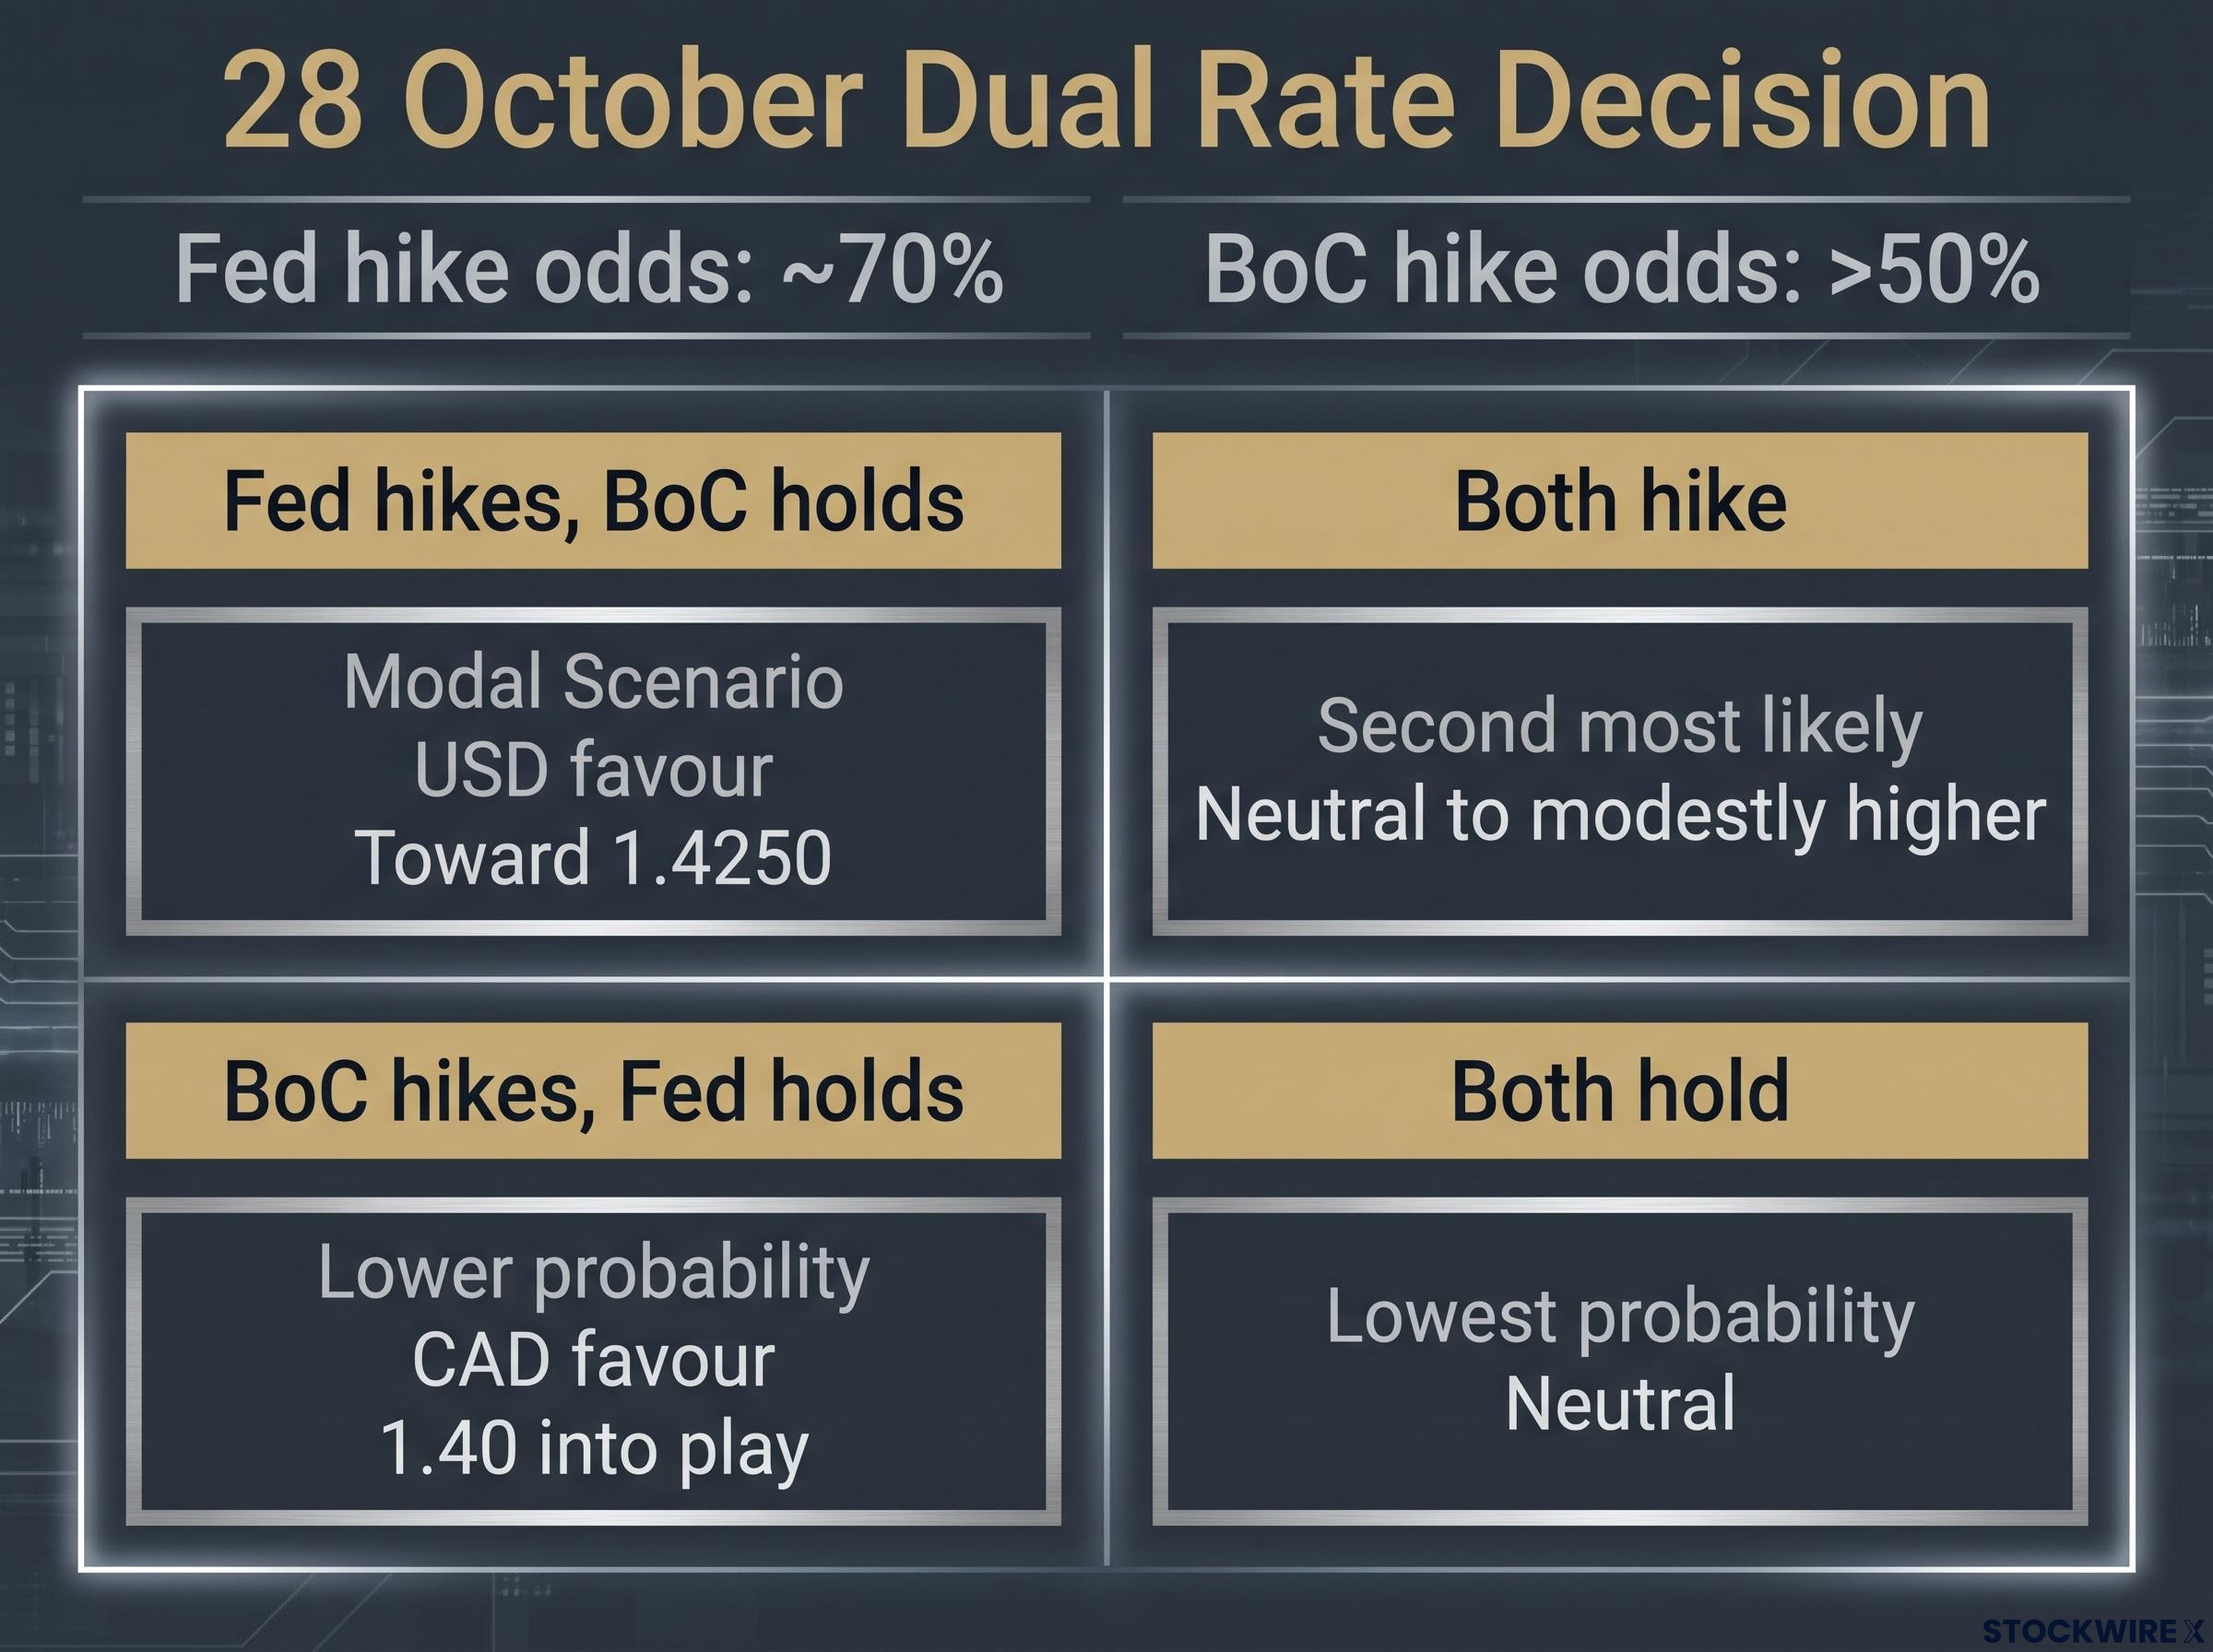
Two central banks are announcing rate decisions on the same day, 28 October, and the market has assigned meaningfully different odds to each. The Federal Reserve is priced at roughly 70% for a hike; the Bank of Canada sits at just above 50%. This week’s core PCE print and Friday’s payrolls report will reprice both of those numbers before 28 October arrives.
Why 1.4200 is proving so difficult to hold
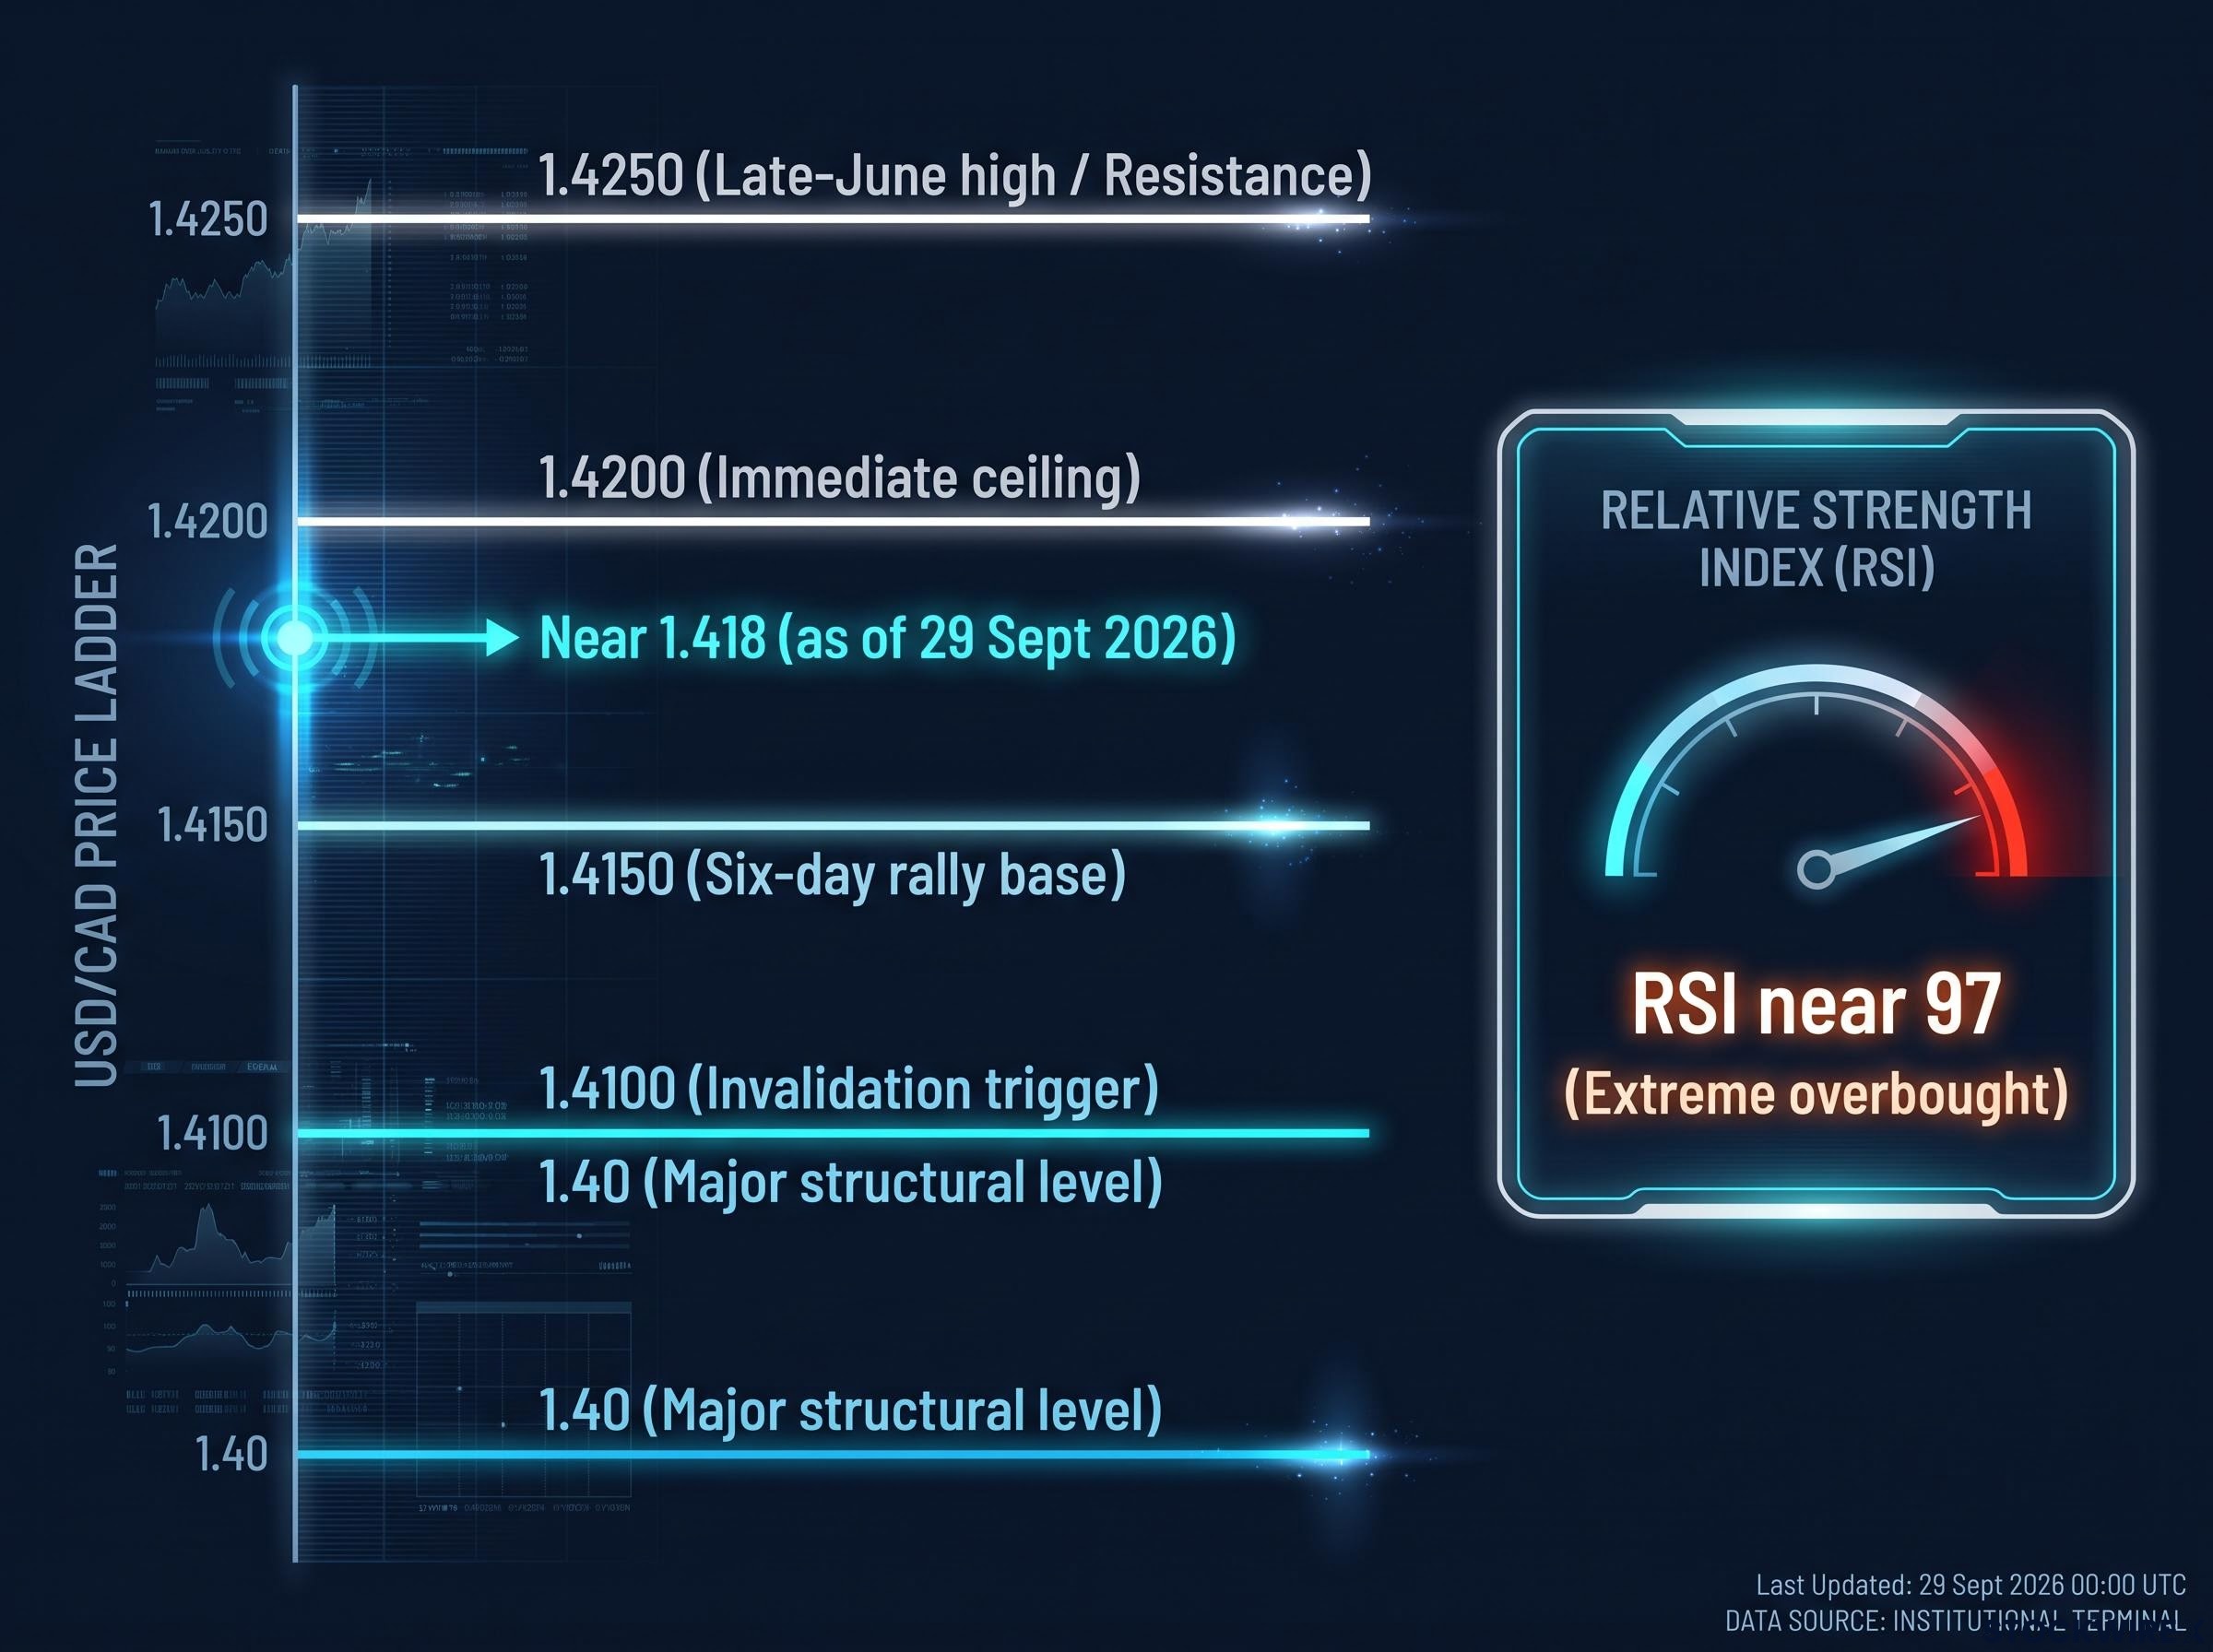
The price action reads like a puzzle. USD/CAD punched fractionally above 1.4200 in Tuesday’s session, its first trade at that level since 8 July, then rejected the level not once but twice inside the same session. It now sits near 1.418 as of 29 September 2026, according to Clearank, with Rabobank quoting 1.414 a day earlier. Six consecutive daily gains built the platform, establishing 1.4150 as the initial support floor.
The technical readings resolve the puzzle. This is not random hesitation. It is a pair running well ahead of the momentum that can sustain it.
According to Clearank’s 29 September reading, the Relative Strength Index (a momentum gauge that runs from 0 to 100, where anything above 70 signals overbought conditions) sits near 97. The Stochastic RSI is near 98. Those are not simply elevated numbers; they are close to the ceiling the indicators can register. The pair is also trading above its 20-, 50-, and 200-day moving averages.
RSI overbought readings above 70 are context rather than commands: in a persistent uptrend, RSI can remain elevated while price continues higher, and the signal gains actionable weight only when paired with moving average configuration and a macro direction cross-check that either confirms or contradicts the momentum read.
Clearank Describes USD/CAD as being in “extreme overbought conditions” and warns of a likely “short-lived pullback” even within its sideways base case.
What this tells you is straightforward. Even without a fundamental trigger for a reversal, the pair is statistically vulnerable to a sharp pullback from here. That makes the 1.4100 daily close level more important to watch right now than 1.4200 itself, because 1.4100 is the line separating a temporary dip from a genuine shift in directional bias.
Context sharpens the point. During Q3, USD/CAD traced a full round trip: near 1.42 at end-June, down to roughly 1.377 by 21 August on stronger Canadian data and firmer commodities, then back to current levels. The pair has proven it can move fast in both directions.
The key levels that define the trade
- 1.4250 (resistance): the late-June high and the upper bound of the range abandoned in mid-July.
- 1.4200 (resistance): the immediate ceiling that capped Tuesday’s advance twice.
- 1.4150 (support): the six-day rally base and first floor.
- 1.4100 (support): the invalidation trigger. A daily close below this breaks the long bias.
- 1.40 (support): the major structural level. A break here signals a more significant downturn.
When big ASX news breaks, our subscribers know first
What the Fed’s next move actually depends on
The starting point is the 16 September decision. The Fed raised its benchmark by 25 basis points to a target range of 3.75%-4.00%, and its post-meeting signals explicitly conditioned any further tightening on incoming data. New York Fed President John Williams saw no immediate need to tighten again. Governor Barr pointed to elevated energy costs and rising artificial intelligence investment as reasons a further hike may still be warranted.
FOMC structure explains why public comments from non-voting regional presidents like Williams and Barr carry different weight than formal decisions: only 12 members vote at each meeting, and detecting real policy shifts requires comparing current language against the most recent Summary of Economic Projections rather than treating every speech as a binding signal.
That leaves two releases to settle the argument, and they arrive as a sequence, not a scatter. Core PCE on Wednesday feeds directly into how the market prices payrolls on Friday, and both feed into the 70% October probability now embedded in Fed funds futures.
Core PCE (the inflation measure the Fed watches most closely, stripping out volatile food and energy) is the first domino. Consensus puts the August month-on-month figure at 0.3%, up from 0.2% prior, with the year-on-year holding at 3.3%. Personal spending is forecast to jump 0.8% after just 0.2% previously. A print at or above 0.3% reinforces the hike case; a reading below 0.2% would reprice it materially.
The BEA Personal Income and Outlays data provides the official monthly PCE and core PCE readings that the Fed explicitly references in its policy deliberations, making Wednesday’s August release the single most direct input into whether the October hike probability moves materially from its current 70% level.
| Release | Time (GMT) | Consensus | Prior | Signal for 28 Oct hike |
|---|---|---|---|---|
| US Core PCE (Aug) | Wed, 12:30 | 0.3% MoM | 0.2% MoM | Firm print locks in hike; soft print reprices lower |
| ISM Manufacturing PMI | Thu, 14:00 | 55 (prices 72.3) | n/a | Prices sub-index a secondary inflation read |
| US Nonfarm Payrolls (Sep) | Fri | 90,000 | +162,000 (Aug) | At or above consensus keeps trajectory intact |
Payrolls close the sequence. The September consensus is 90,000, with unemployment forecast at 4.1% and average hourly earnings up 0.3% month-on-month. For calibration, August delivered +162,000 against a +56,000 consensus, nearly triple. August job openings, by contrast, softened to 7.079 million versus 7.23 million expected.
Two views inside the Fed Williams: no immediate urgency to tighten, and inflation not expected back at the 2% target until 2028. Barr: elevated energy costs and AI-related investment warrant further hikes.
Here is what to hold onto. A core PCE print at or above 0.3% month-on-month combined with payrolls near or above 90,000 would push the October hike close to certainty, removing the data ambiguity that is currently the only credible basis for a USD/CAD pullback this week. And the 70% figure is not fixed: history shows how fast it moves. Around the August Fed minutes, implied September odds fell from over 70% to roughly 32% in a matter of weeks.
How the Bank of Canada changes the equation
Most coverage frames USD/CAD purely through the Fed. That is a mistake this month, because the Bank of Canada decides on the very same day.
Start with the mechanism. The interest-rate differential is simply the gap between what each central bank pays on its currency. When the Fed tightens while the BoC holds, US assets earn a wider yield advantage, capital rotates toward the dollar, and CAD weakens. TradingEconomics attributes September’s move toward 1.41 directly to this expected widening gap, and it has been the dominant structural driver of CAD weakness through 2026.
The complication is that both banks decide on 28 October. Swap markets price the BoC at slightly above 50% for a hike, against the Fed’s 70%. Governor Macklem signalled on 2 September a willingness to raise rates more than once if inflation stayed elevated. That turns 28 October into a genuinely bilateral event, where the combination of outcomes matters as much as either decision alone.
| Scenario | Rate differential | USD/CAD implication | Approx. combined odds |
|---|---|---|---|
| Fed hikes, BoC holds | Widens (USD favour) | Higher; extends range toward 1.4250 | Modal (~70% x ~50%) |
| Both hike | Unchanged | Neutral to modestly higher | Second most likely |
| BoC hikes, Fed holds | Narrows (CAD favour) | Lower; 1.40 into play | Lower probability |
| Both hold | Unchanged | Neutral; technicals dominate | Lowest probability |
CAD-specific forces can override the differential story entirely, and Q3 proved it. According to National Bank of Canada, positive domestic surprises, firmer commodities, and trade optimism drove USD/CAD as low as 1.377 by 21 August, with CAD logging roughly 2.5% quarter-to-date gains by early September. Then Ottawa-Washington trade talks broke down, and the gains reversed.
The BoC rate outlook carries a structural complication for the modal scenario: TD Securities projects no change through all of 2026 and flags November as the earliest point at which trade-related data would be available for BoC assessment, a timeline that sits well beyond the 28 October decision and limits how much Macklem’s September hawkish signal can actually be acted on.
The variables capable of doing that again:
- Commodity and oil prices, through Canada’s terms of trade.
- Domestic data surprises, particularly Thursday’s Canadian S&P Global Manufacturing PMI at 13:30 GMT.
- Trade negotiations, which can reverse CAD strength even when other inputs are supportive.
What this tells you is that the modal outcome, a Fed hike against a BoC hold, still favours a widening differential and a firmer pair. But the second-order scenario, a BoC hike paired with a Fed pause, would flip the near-term bias and put 1.40 squarely into play to the downside. Rabobank, for its part, still projects only a sideways 1.41-1.42 range through year-end even under continued Fed hawkishness.
Reading this week’s data as a currency signal
The pair is currently priced for a Fed hike that has not yet happened, on data that has not yet printed, from a technical level that most strategists call unsustainable. That combination means the information content of Wednesday’s core PCE is unusually high relative to where USD/CAD actually trades right now.
Here are the three releases to watch, in calendar order:
- Wednesday, core PCE (August): watch for a month-on-month print at or above 0.3% (hawkish, hike-supportive) versus below 0.2% (dovish, repricing lower).
- Thursday, Canadian Manufacturing PMI: watch for a strong reading that strengthens the case for a BoC hike, narrowing the differential.
- Friday, US payrolls (September): watch for a result at or above 90,000 (trajectory intact) versus a miss below 60,000 (echoing the August minutes repricing).
| Scenario | Data condition | 28 Oct probability shift | USD/CAD direction | Level to watch |
|---|---|---|---|---|
| Softer US data | Core PCE below 0.2% | Fed hike odds fall | Lower, toward 1.40 | 1.4100 close |
| Strong US data | PCE 0.3%+ and payrolls 90k+ | Fed hike near certain | Higher | 1.4250 |
| BoC hikes, Fed holds | Firm Canadian PMI | Differential narrows | Lower | 1.40 |
| Oil surge | Terms of trade improve | Neutral to Fed | Lower (CAD gains) | 1.4100 |
| Technical correction | Overbought unwinds | No policy shift | Lower, near-term | 1.41 or below |
The risk setup is asymmetric, and that asymmetry is the read to take. With RSI near 97 and Stochastic near 99, upside is technically constrained toward 1.4250, while the downside from a soft print has far more room to run. A soft data surprise would likely produce a sharper pullback than a firm print produces an additional advance. Rabobank’s 1.41-1.42 base case already places the current 1.418 at the top of the consensus range.
DXY momentum heading into the October decision was sitting near 67 on a 14-period RSI in late September 2026, below the 70 exhaustion threshold the USD/CAD chart has already breached, suggesting the broader dollar index had room to run while the bilateral pair was statistically overextended relative to the index that contains it.
Do not overlook the oil channel. Higher crude typically supports CAD through Canada’s terms of trade, but it can simultaneously stoke US inflation fears and Fed hawkishness, a partially offsetting dynamic. National Bank’s scenario for a retest of 1.40 hinges on favourable trade developments or continued Canadian strength, not on oil alone.
What the 28 October outcome means for where USD/CAD goes next
The modal scenario is clear enough. A Fed hike combined with a BoC hold extends the current range, with 1.4250 as the ceiling and 1.4100 as the floor, consistent with Rabobank’s sideways forecast through year-end. That is the outcome the combined probabilities point toward, but it is not the outcome that produces a clean breakout.
Rabobank year-end range A sideways 1.41-1.42 even under continued Fed hawkishness, positioning that band as the professional consensus ceiling for the modal scenario.
Two conditions would break the pair out of that range:
- A sustained daily close above 1.4250: the breakout case. It requires clear Fed hawkishness paired with BoC inaction, with Clearank flagging 1.4300 as the next upside target only while the pair holds above 1.4100.
- A daily close below 1.4100: the breakdown case. It requires either softer US data or a BoC hike against a Fed hold, opening the door to National Bank’s 1.40 retest.
One honest caveat. The research contains no documented precedent for how USD/CAD behaves when the Fed and BoC decide on the same day, so the market’s behavioural response to a simultaneous dual announcement is an empirical unknown. Even the bull case, on Rabobank’s numbers, does not deliver a clean run above 1.43, so anyone positioned for continuation should be realistic about the ceiling the market’s own strategists see overhead.