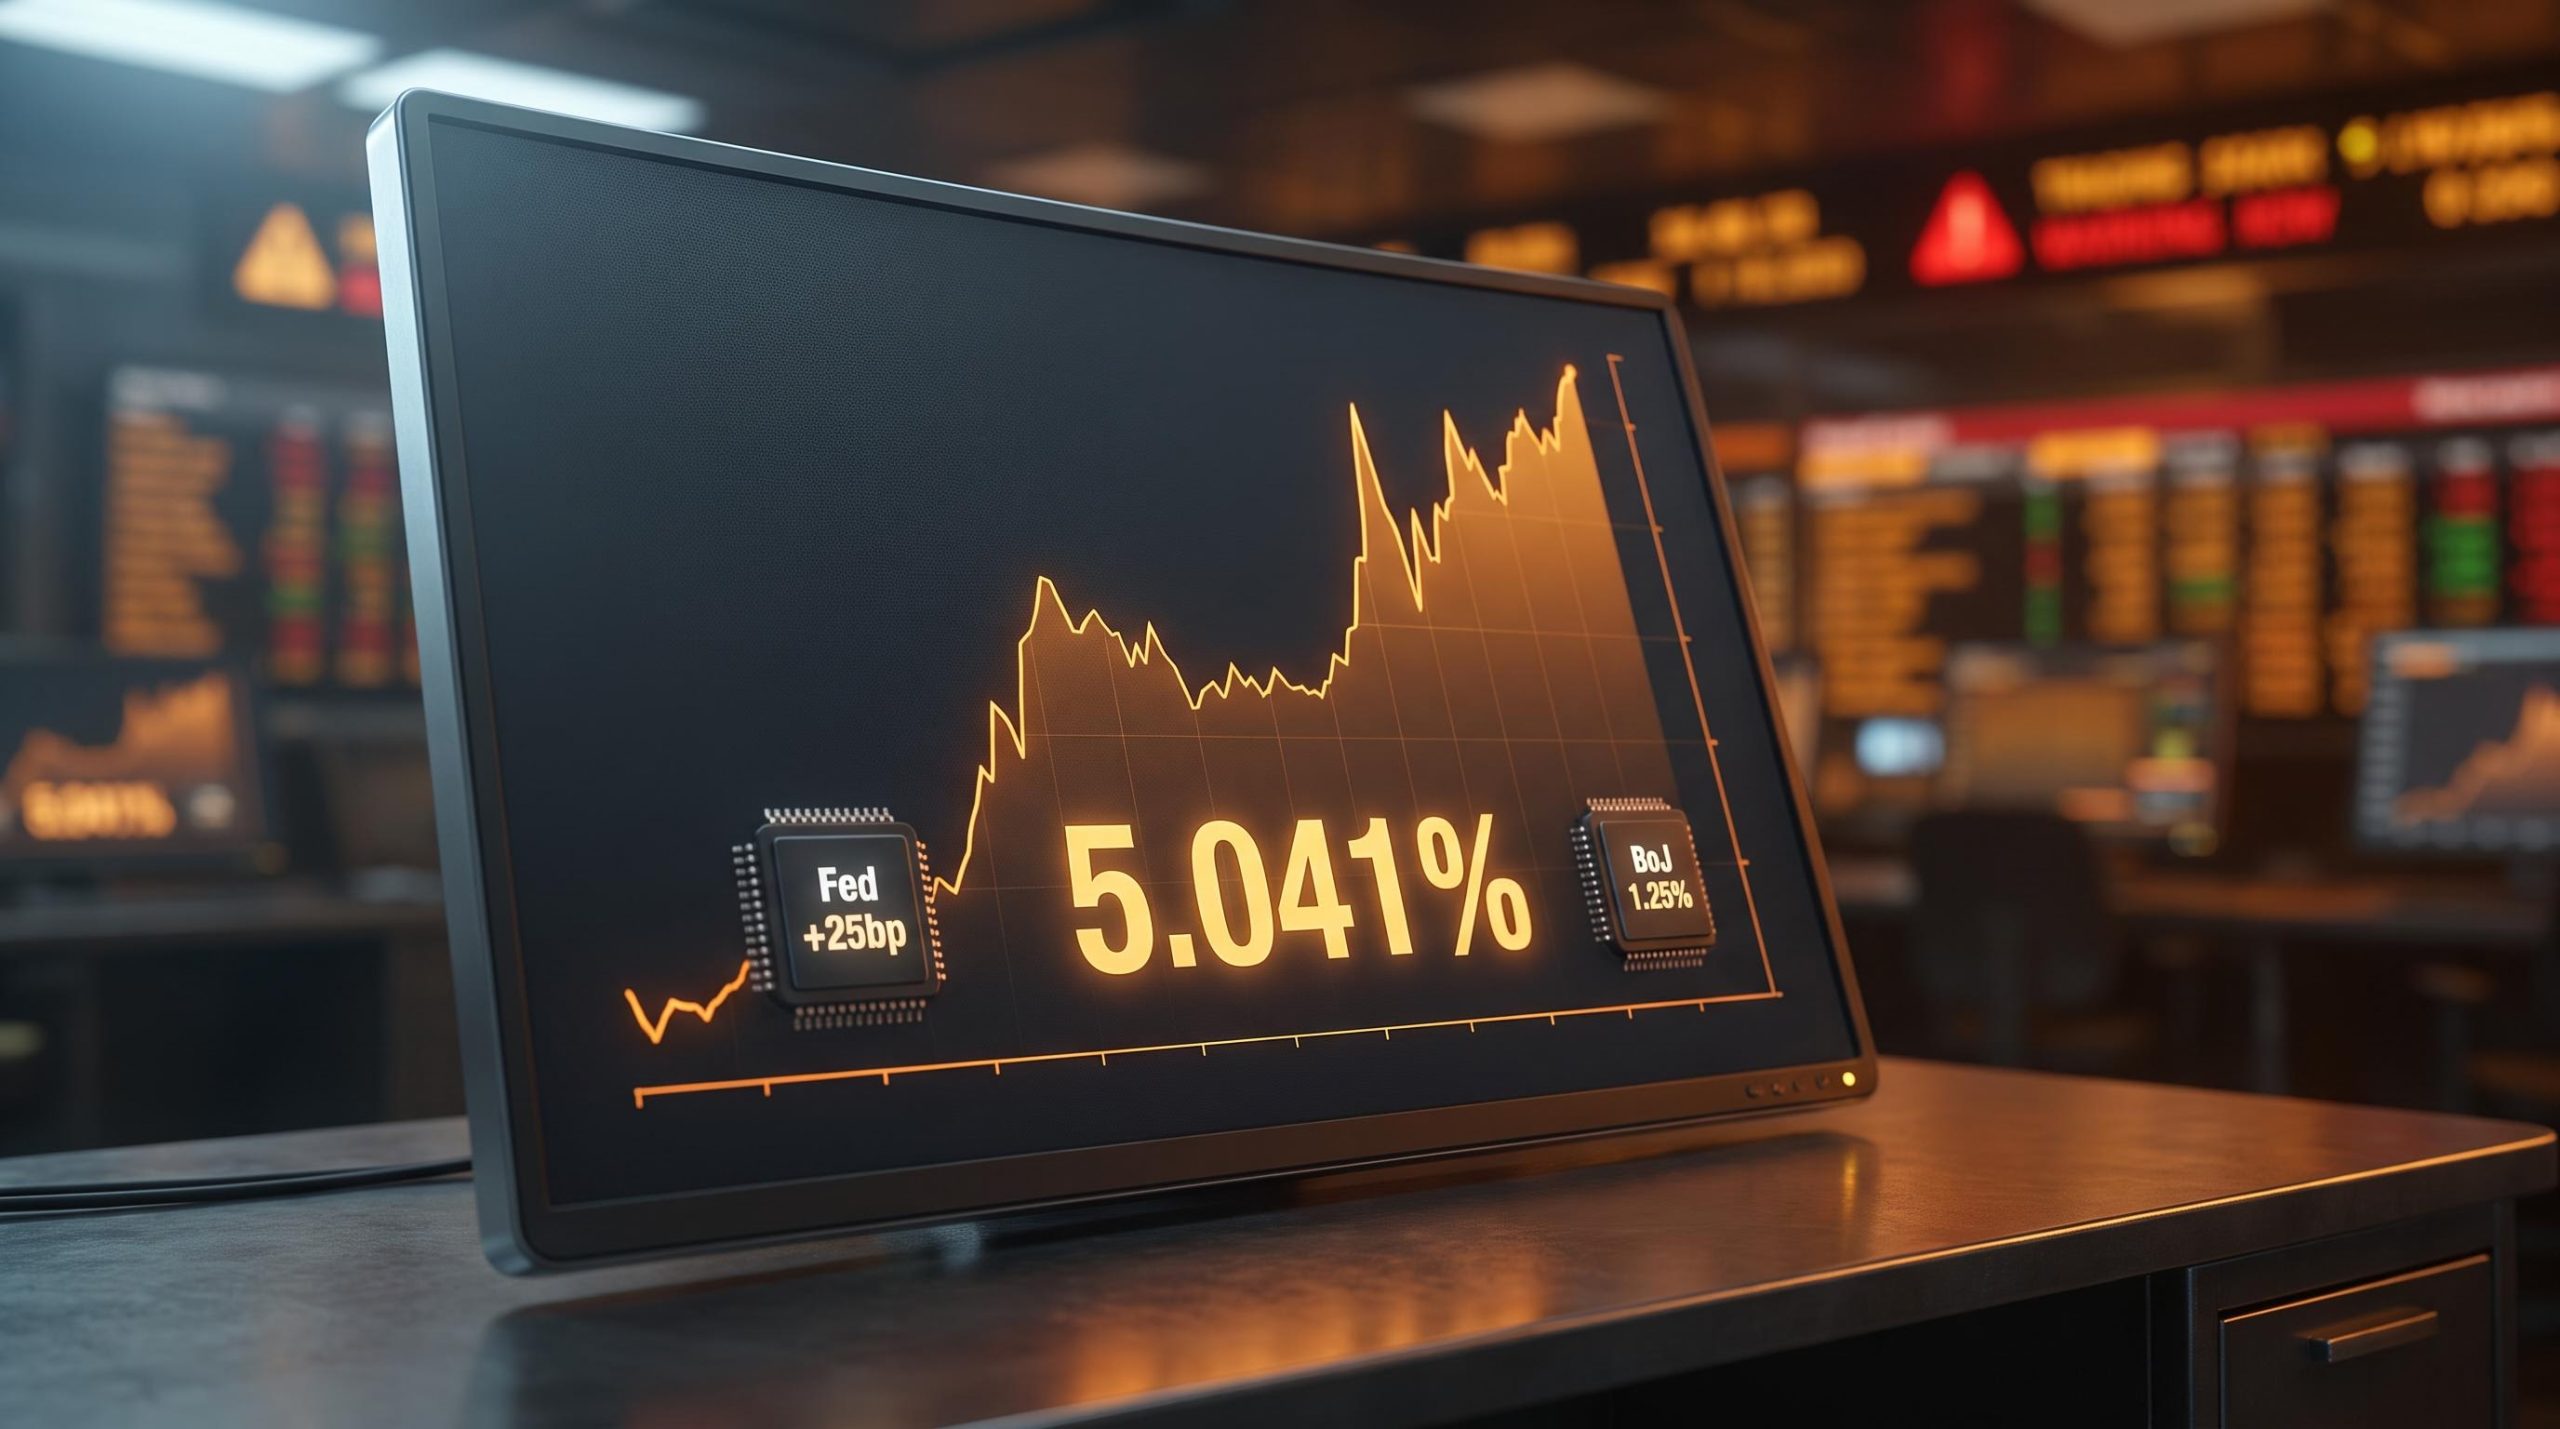
The U.S. 10-year Treasury yield touched 5.041% this week, its highest point since 2007, and the two central bank decisions that drove it there landed within days of each other.
The synchronisation is the story. The Federal Reserve delivered its first rate hike in three years, decided unanimously, at almost the same moment the Bank of Japan lifted its policy rate to 1.25%, a 31-year high for Japanese borrowing costs. Together, these are not two separate calendar entries. They are a shared signal that the era of suppressed global borrowing costs is being actively unwound, and it is happening while Middle East escalation pushes oil into triple digits and feeds inflation expectations at the worst possible moment for both central banks.
Here is what the dual decisions mean for bond markets, borrowing costs, and where the Fed goes next as 2026 heads into its final quarter.
The 10-year yield hits a 19-year high, and it did not happen by accident
The benchmark peaked at 5.041% on Tuesday, its highest reading in roughly two decades, according to Al Jazeera. That single number carries a lot of weight, because the 10-year Treasury is where the market prices its collective bet on where interest rates and inflation will sit over the next ten years.
A 19-year high The 10-year Treasury yield’s intraday peak of 5.041% is the highest level since 2007, the last period before the global financial crisis when yields consistently traded above 5%.
This was not a one-day spike. The move built over months, and the trajectory tells the fuller story:
- The yield has climbed roughly 25 basis points since Fed Chair Kevin Warsh’s Jackson Hole remarks in late August.
- It is up approximately 1 full percentage point since its February 2026 low.
- On Friday, the benchmark opened near 4.94% before easing to around 4.947% in the immediate aftermath of the Fed decision.
That Friday range matters. The yield is not piercing 5% and retreating cleanly. It is oscillating at or just below the threshold, testing it repeatedly rather than rejecting it.
For a generation of investors, a 5% 10-year is unfamiliar territory. Portfolios built on the assumption that long-term rates stay below 3%, a reasonable bet for most of the post-2008 period, now sit against a market that is pricing something structurally different. The 19-year high is not a technical artefact. It is a verdict on the durability of the tightening cycle, and it reaches into every asset priced off the risk-free rate.
The 10-year yield oscillating at or just below 5% reflects what several major institutions now characterise as a structural rate shift rather than a cyclical overshoot, driven by the withdrawal of price-insensitive central bank buyers and a persistent fiscal deficit that forces private investors to demand genuine real compensation for holding government debt.
When big ASX news breaks, our subscribers know first
Two central banks, one week, and a combined policy signal that markets cannot ignore
The Fed moved first. Its 25 basis point hike passed with a unanimous vote, the central bank’s first increase in three years, framed as an acknowledgement that inflation remains substantially above the 2% target rather than a reaction to any acute shock.
Days later, the Bank of Japan followed. Its board voted 7-2 to lift the overnight call rate to 1.25%, effective 24 September 2026, taking Japanese policy to its highest level since 1995.
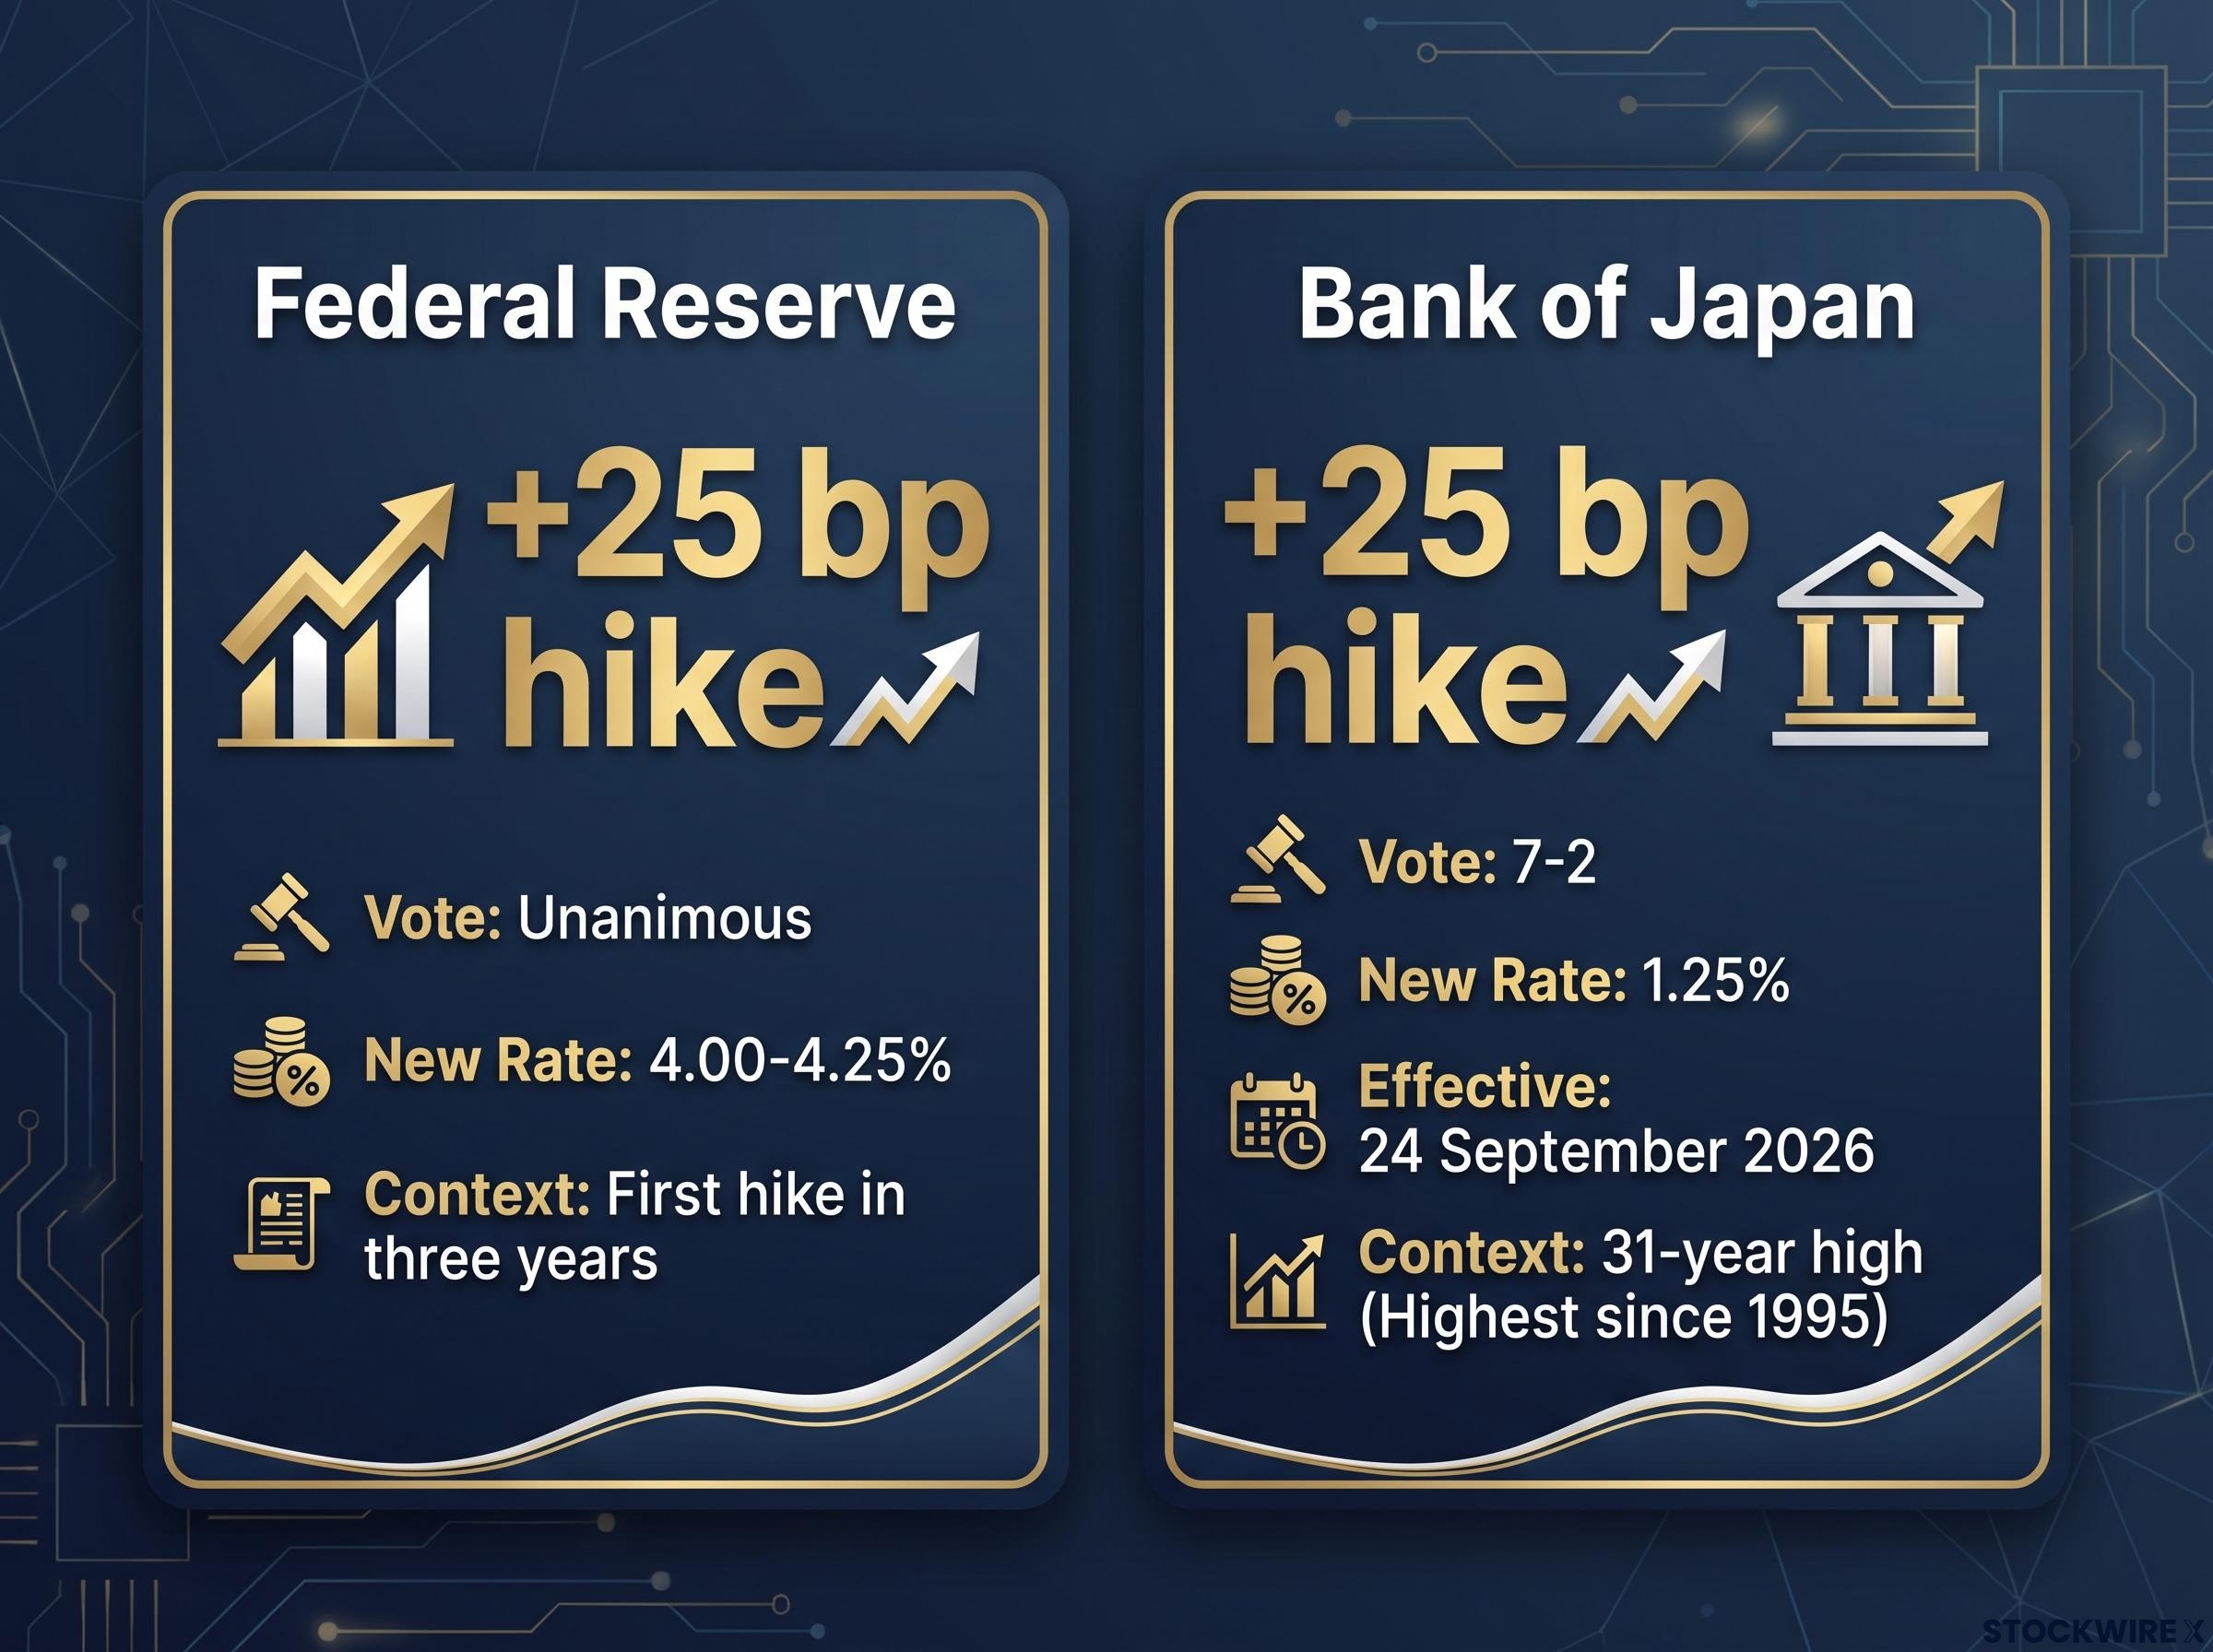
| Central Bank | Decision | Vote | New Rate | Historical Context |
|---|---|---|---|---|
| Federal Reserve | +25 bp hike | Unanimous | 4.00-4.25% | First hike in three years |
| Bank of Japan | +25 bp hike | 7-2 | 1.25% | 31-year high, highest since 1995 |
The coincidence of timing is not the whole point. What matters is the mechanism that connects the two.
For years, Japanese institutional investors were among the largest buyers of U.S. Treasuries, and they bought at almost any yield because domestic Japanese returns were near zero. That is now changing. As the BoJ raises rates and domestic Japanese yields climb, those same institutions have a growing incentive to keep their money at home or demand higher compensation for taking on currency risk.
Governor Kazuo Ueda has indicated that policy has shifted into a new phase. Economists surveyed by Reuters expect the tightening to continue, projecting 1.50% by end-March 2027 and 1.75% in the second quarter of 2027.
That forward path removes Japan as a structural anchor of ultra-low global rates. For a U.S. investor, this is not a foreign story you can ignore. Japan is one of the largest holders of U.S. government debt, and as its buyers step back or demand more, the term premium on long-dated Treasuries has to rise. That is a direct upward pressure on U.S. long-term borrowing costs, and it is now baked into the market.
Oil above $94, inflation still elevated, and a borrowing-cost squeeze taking shape across the economy
The rate story does not sit in isolation. Oil jumped more than $4 a barrel on 1 September 2026 as fears of renewed conflict between the U.S. and Iran intensified, with Brent reaching approximately $94.65 and WTI around $90.22.
Subsequent fighting, including U.S. strikes, Israeli threats against Tehran, and Houthi attacks on Saudi energy facilities, has pushed Brent repeatedly toward and beyond the $97-100 range, with WTI holding in the low-to-mid $90s.
This is where the Fed’s problem sharpens. Sustained energy prices in the high $90s risk reigniting goods-price inflation at the precise moment the central bank is trying to consolidate its progress toward 2%. That strengthens the case for continued tightening rather than a pause, regardless of what policymakers might otherwise prefer.
Rate hikes are a demand-side instrument applied to a cost driven by supply disruption, and supply-side inflation limits the effectiveness of monetary tightening when the underlying price pressure originates in energy markets rather than excess domestic demand, a constraint the IMF has warned could push the return to 2% PCE as far out as end-2027.
The 10-year Treasury is the benchmark against which household and business borrowing is priced. A sustained move to 5% flows through several channels at once:
- Mortgage rates, which track the 10-year directly, push higher for anyone buying a home.
- Auto loan costs rise for new car buyers.
- Corporate borrowing becomes more expensive, squeezing margins.
- Federal debt-service costs climb, adding pressure to the fiscal picture over time.
Yet the growth backdrop is not uniformly strong, which complicates the whole calculation.
A softening signal U.S. Industrial Production registered 0.0% month-over-month growth in August 2026, below the 0.3% expected and down from 0.2% the prior month, a reading that cuts against the argument that a strong economy can comfortably absorb higher rates.
The Federal Reserve G.17 release confirmed that industrial production was unchanged in August 2026, verifying the 0.0% monthly reading that fell below the 0.3% consensus estimate and the prior month’s 0.2% gain.
Triple-digit oil and stagnant industrial output arriving together tell you something important. The Fed is tightening into an economy that is already showing pockets of softness, before the full weight of higher borrowing costs has even passed through. That combination has historically narrowed the margin for policy error, and it means the squeeze on real purchasing power lands on households at the worst possible time.
Markets are pricing one more Fed hike this year, with the data calendar now deciding when
The forward view is where this gets practical. Money markets have priced approximately 34 basis points of additional Fed tightening by the end of 2026, according to Prime Terminal data, and the probabilities stack up clearly:
- October hike probability: approximately 55%.
- December or year-end hike probability: approximately 90%.
- Modal year-end funds rate target: 4.00-4.25% or 4.25-4.50%.
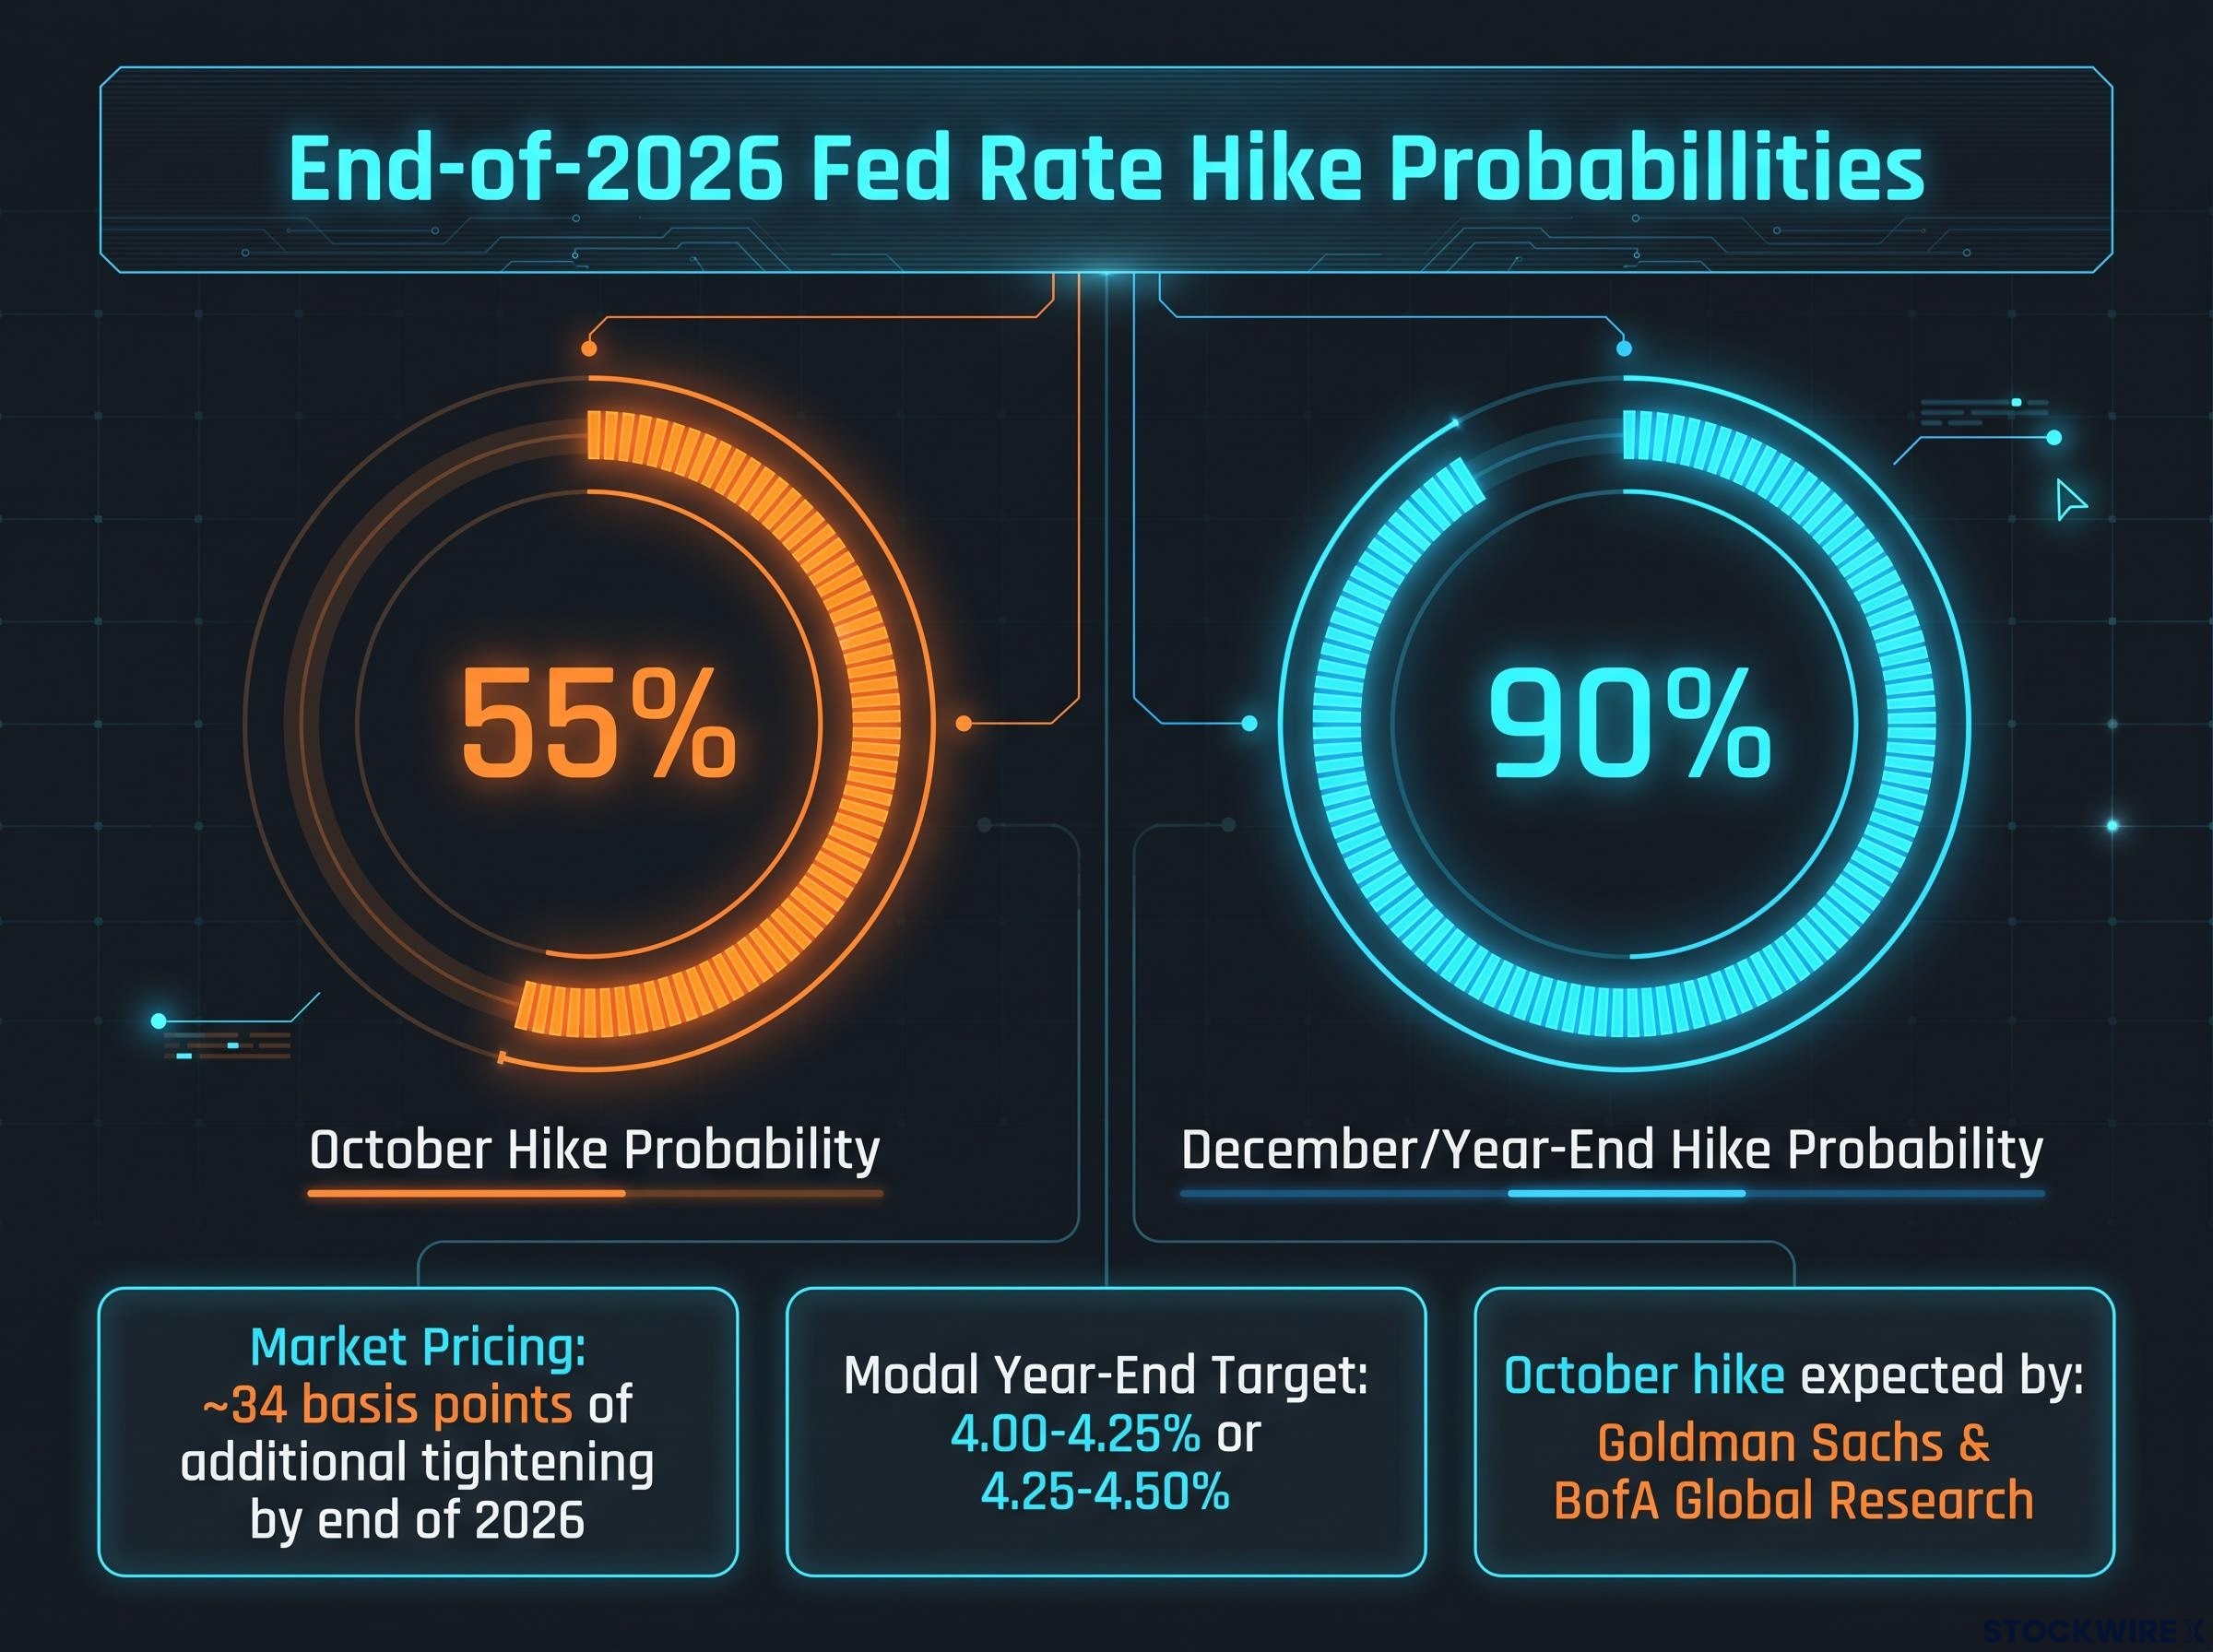
Goldman Sachs and BofA Global Research both expect the next increase as early as October, reinforcing the view that the policy rate ceiling may sit higher than previously assumed.
A 90% implied probability of another hike by December reframes the question entirely. For investors and borrowers, it is no longer whether rates go higher, but when. That answer now depends almost entirely on the next two or three data prints.
What the next data releases will decide
The upcoming data calendar is the swing factor. Labour market and manufacturing releases due in the week following the September decision will either firm up the October hike case or soften it back toward a hold.
Strong employment or resilient factory activity would push the October probability above 55% and pull the next hike forward. A weaker set of prints, echoing that flat industrial production reading, would give the Fed room to wait until December.
The practical takeaway is that the window to act before another rate increase is measured in weeks, not months. Any positioning that quietly assumes a Fed pause is running against a market that is pricing the opposite.
What a 5% yield world means heading into Q4 2026
The market is split on how much this matters, and both camps deserve a fair hearing.
Risk-focused strategists warn that sustained 5% yields could trigger a debt-service spiral as interest costs on federal debt climb, dampen housing demand, and force a repricing of credit. Fortune has described the threshold as a “wake-up call” for fiscal policy and debt hawks. The more sanguine view holds that there is little fundamental difference between a 4.9% and a 5.0% yield, and that the move simply reflects better nominal growth and a normalisation of term premia after years of ultra-low rates.
The bond market as policy lever has displaced equity markets as Washington’s primary pressure mechanism in 2026, with Wolfe Research, Bloomberg Opinion, and Apollo each concluding that sustained yield pressure forces policy pivots that S&P 500 drawdowns alone no longer reliably trigger.
The historical parallel is worth holding carefully. The last time the 10-year consistently traded above 5% was the mid-2000s cycle, which did eventually expose structural vulnerabilities in housing and credit. This is not a prediction of crisis. Today’s banking system is better capitalised and regulators are more alert to interest-rate risk. It is a reminder that the current environment is unfamiliar to a generation of investors who built their careers in a sub-3% world, and the appropriate response is recalibration, not panic.
Three variables will decide whether 5% yields prove manageable or destabilising:
- Inflation expectations remaining anchored, keeping real yields in a tolerable range.
- Credit markets absorbing higher funding costs gradually without seizing up.
- Fiscal authorities responding to rising debt-service costs over time rather than letting them compound.
Whether these yields become a headwind or a reckoning depends on decisions being made right now in bond markets, corporate boardrooms, and Washington. That makes this an actively consequential moment, not a data point to file away.
For investors wanting to understand how sustained 5% yields flow into specific holdings, our dedicated guide to rate-sensitive assets covers TLT, IEF, LQD, and XLU simultaneously declining and explains why the institutional response has centred on TIPS and barbell duration structures.
This article is for informational purposes only and should not be considered financial advice. Investors should conduct their own research and consult with financial professionals before making investment decisions. Past performance does not guarantee future results. Financial projections are subject to market conditions and various risk factors.