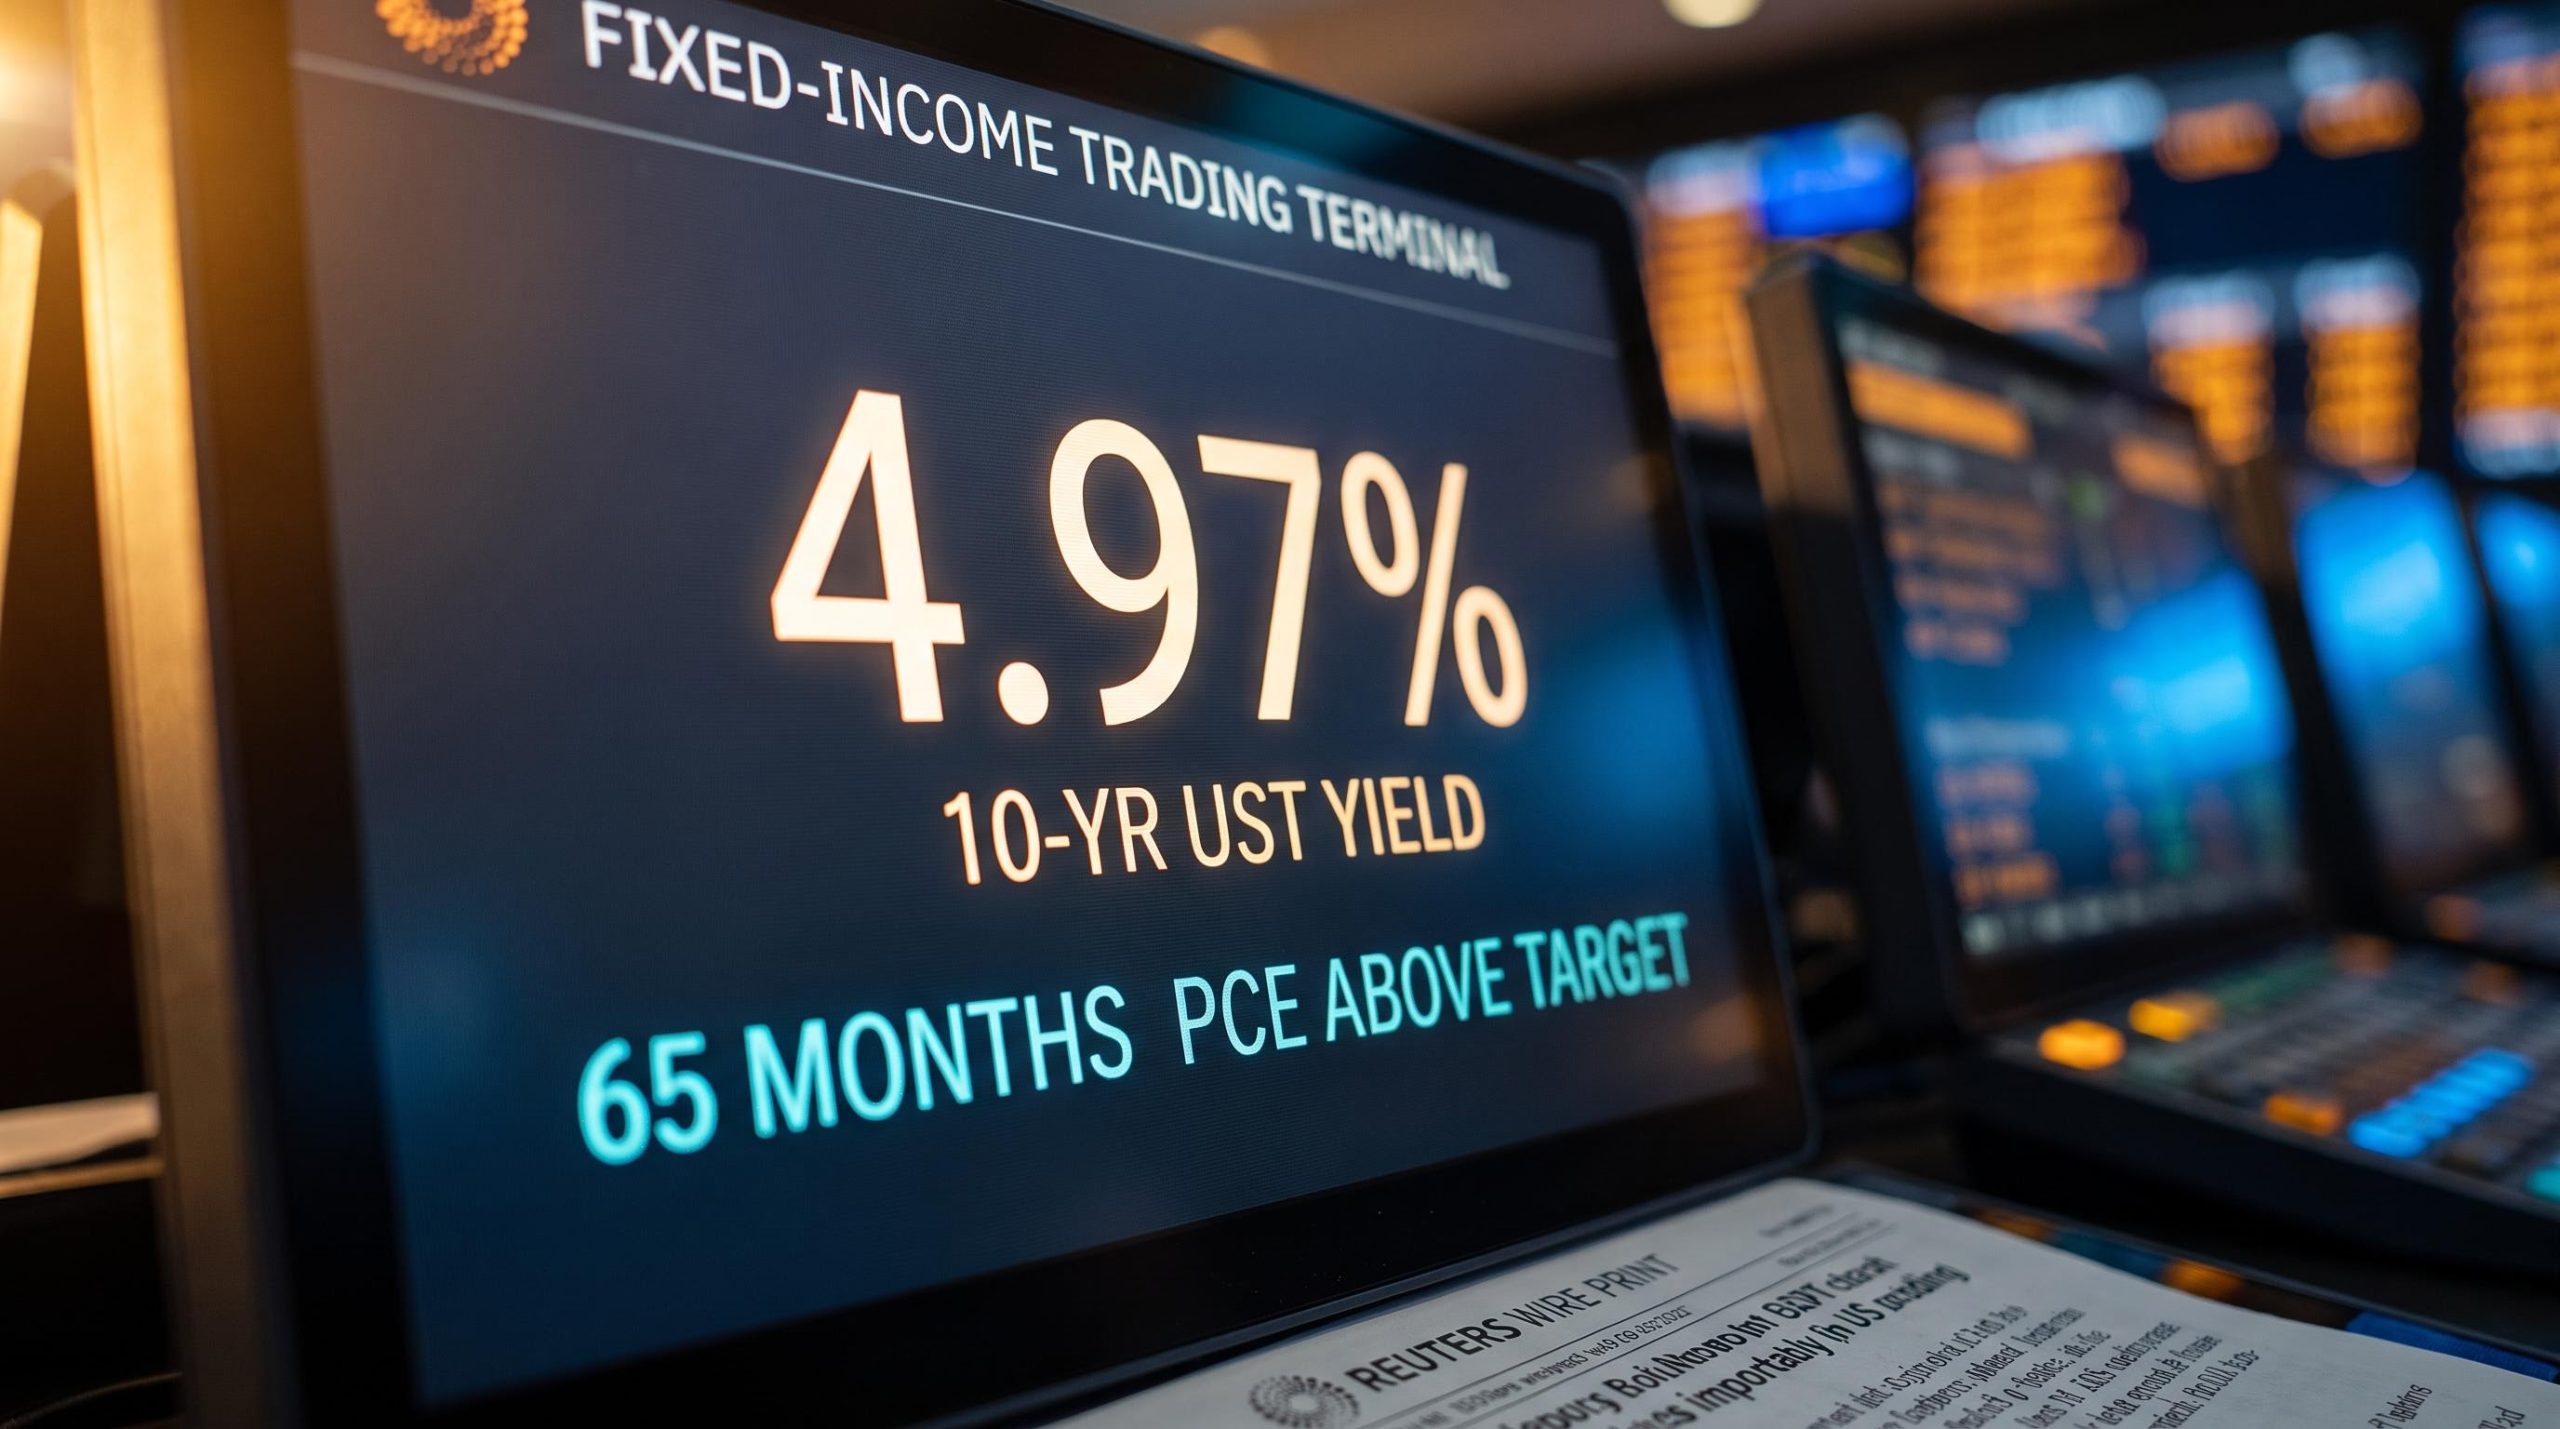
The Personal Consumption Expenditures index, the Federal Reserve’s preferred inflation gauge, has now run above its 2% target for 65 consecutive months. That is more than five years without a single reading at goal, a stretch that has quietly reframed this week’s FOMC decision. It looks less like an open question and more like a reckoning that has been building since early 2021.
That structural fact collided with a data cluster no central banker could wave away. August CPI came in at 3.4% year-over-year, PPI at 5.4%, and both landed on top of an oil shock that traces back to the U.S.-Israel military operation against Iran at the end of February 2026. Brent crude is up somewhere between 56% and 71% year-to-date depending on the source, and the CME FedWatch tool now assigns roughly a 90% probability to a 25-basis-point hike at the 15-16 September 2026 meeting.
What follows here is a decision-support map for a live Fed week. This piece traces how the oil shock transmitted into the inflation readings, reads what Treasury and equity moves reveal about investor positioning, and sits inside the genuine tension of this hike before the decision lands on Wednesday.
How a military strike in February became a September inflation problem
To understand why the Fed’s hand feels forced, start six months and several thousand miles away.
At the end of February 2026, a joint U.S.-Israel military operation against Iran triggered a sharp climb in global oil prices. That single supply-side event set the inflation trajectory for the rest of the year, and its fingerprints are all over the August data.
The subsequent Strait of Hormuz escalation removed diplomatic off-ramps over the summer, structurally embedding the risk premium into global energy markets long after the initial February strike.
Oil is the primary transmission mechanism here. Brent crude sat near $104.6 per barrel as of 11 September 2026, with year-to-date gains that the research places in a wide but unambiguous range: TradingEconomics reports 56.16%, while UBS research via economist Paul Donovan puts the figure above 71%. The exact number is contested; the direction is not. This is a dramatic rise of well over 50% in nine months.
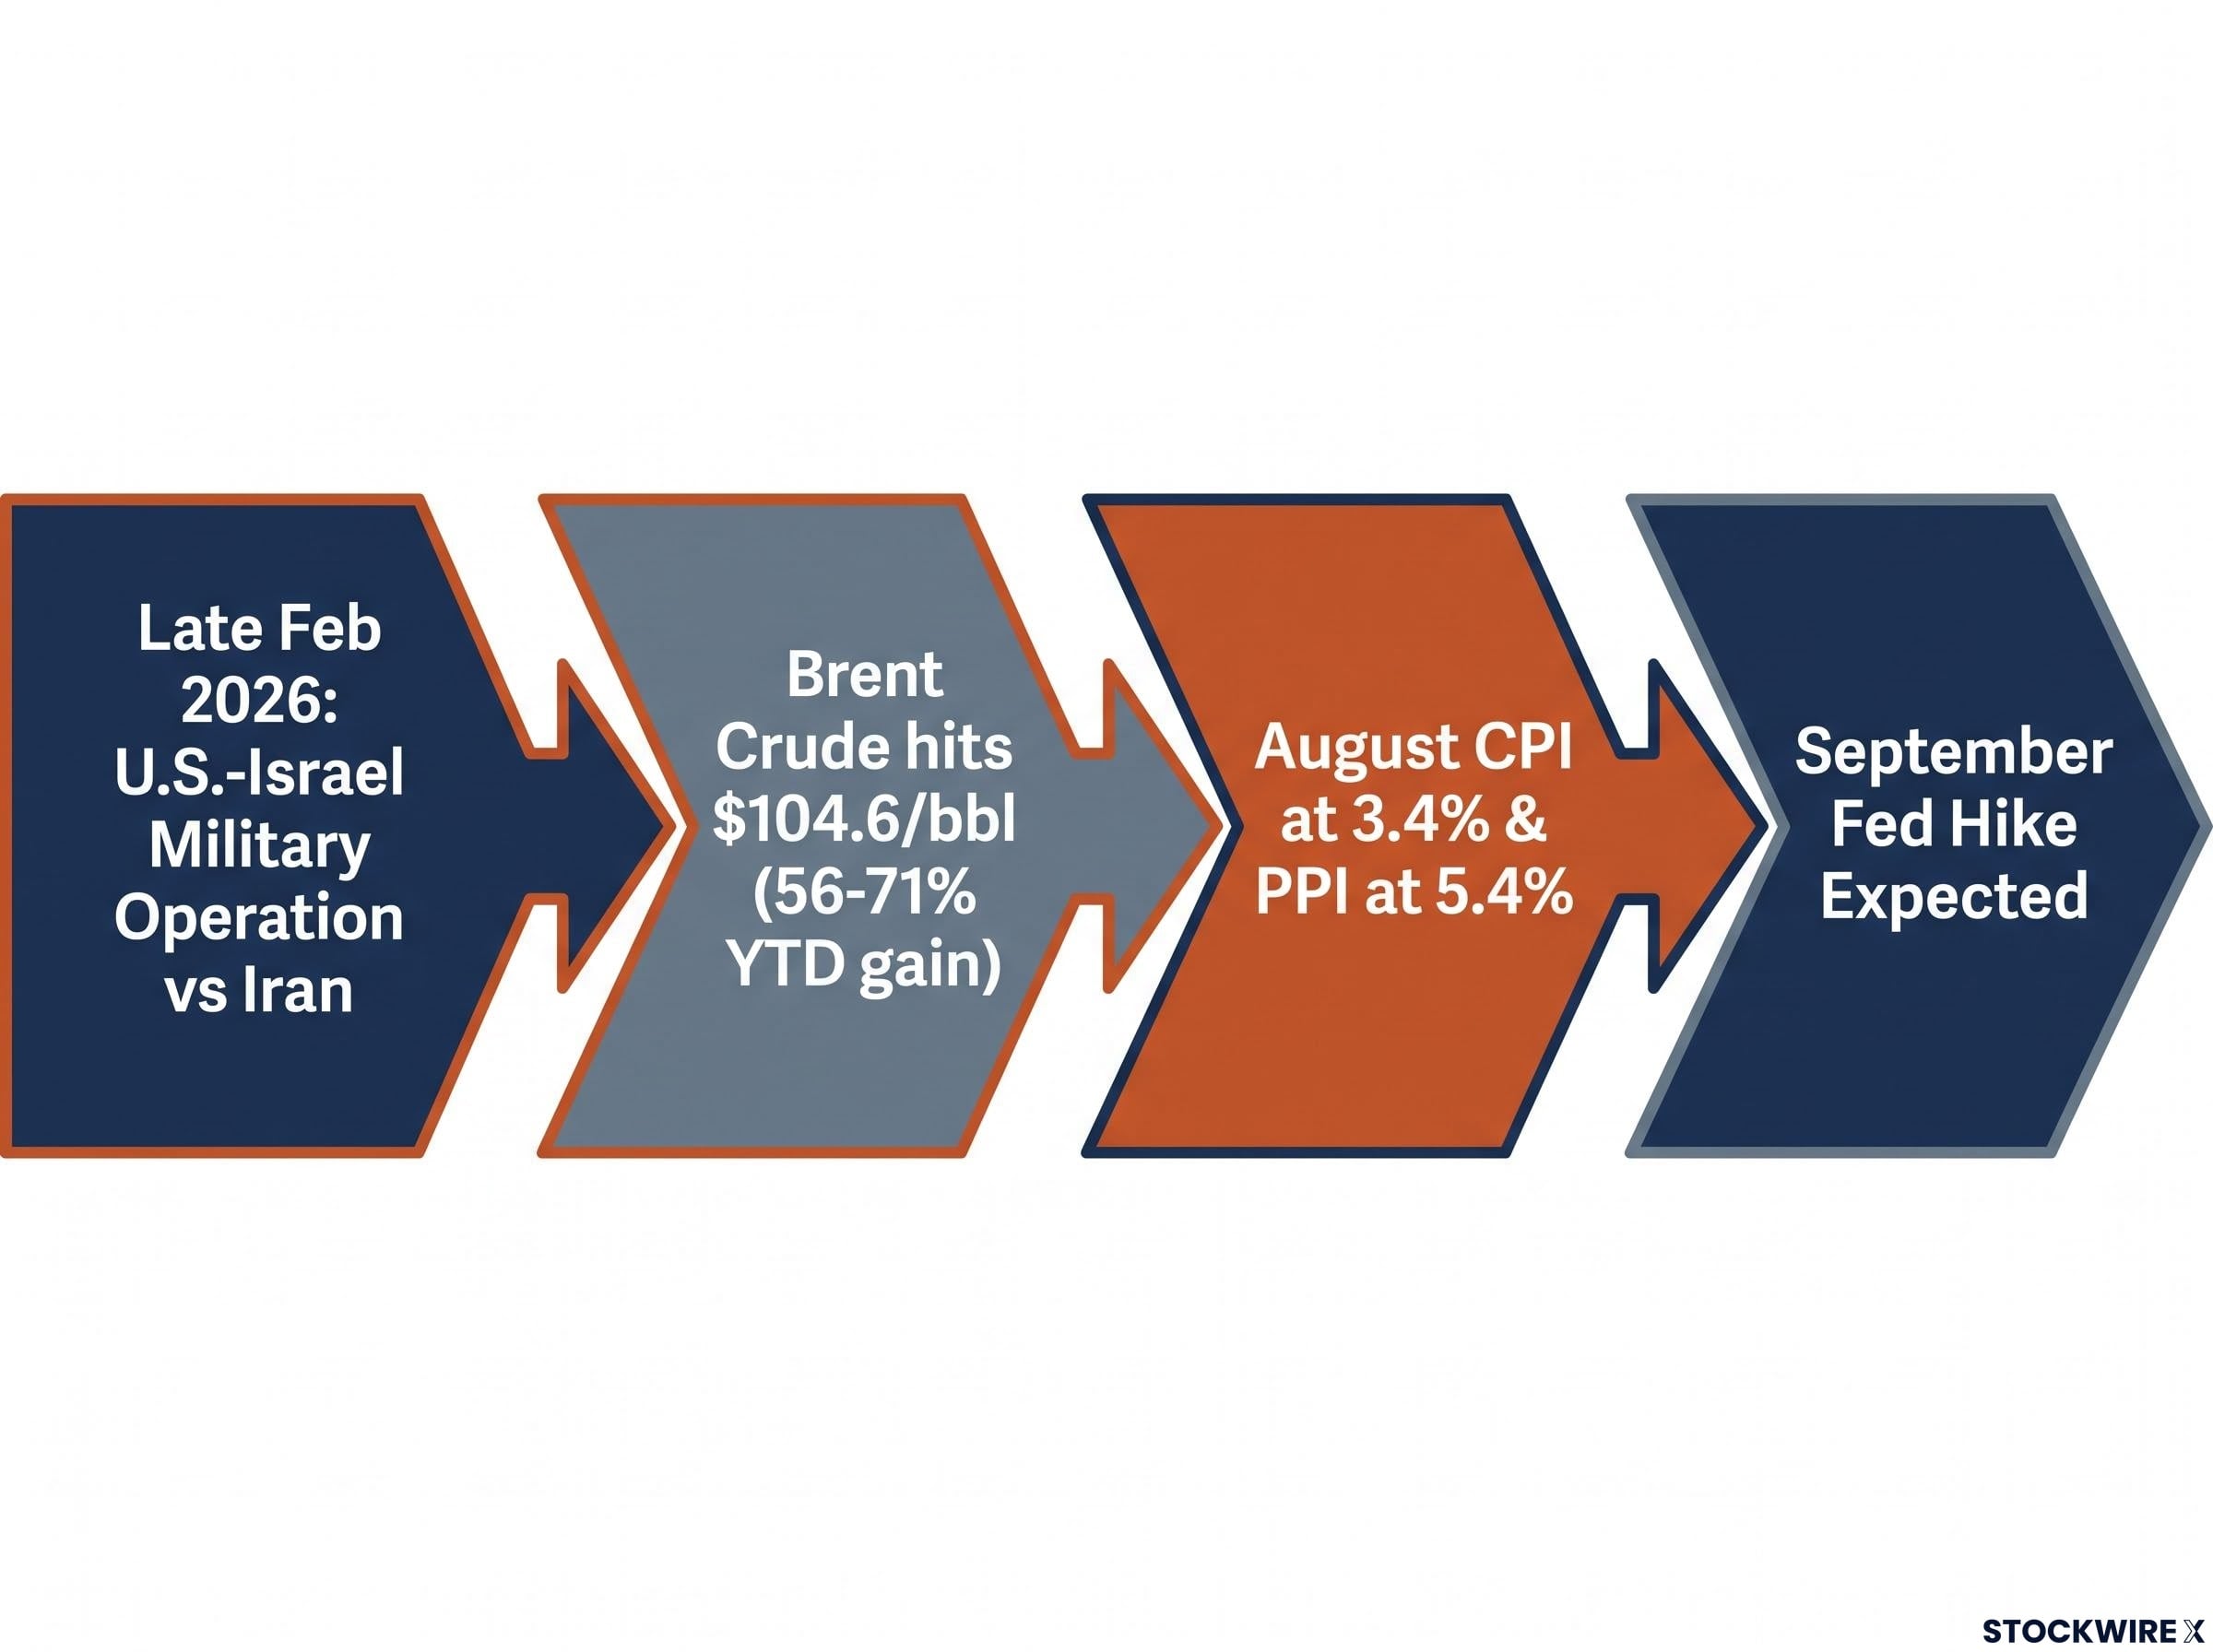
Energy prices do not stay contained in the energy aisle. When crude climbs, gasoline and transport costs rise, and those feed directly into headline CPI and PPI, which is exactly the pass-through visible in the August readings. The chain runs cleanly from a geopolitical decision to a producer price index:
- A U.S.-Israel military operation against Iran hit oil supply in late February 2026
- Brent crude spiked, gaining well over 50% year-to-date
- Higher energy costs passed through into gasoline and transport prices
- Those costs lifted headline CPI to 3.4% and PPI to 5.4%
- The Fed now faces near-certain pressure to respond with a hike
Even the public mood tracks the move. According to UBS research via Paul Donovan, Google Trends data shows online search interest in “inflation” reaching nearly twice the peak recorded during the post-pandemic inflation episode. Households are feeling it.
Reuters reports that Fed officials have warned the “ongoing U.S.-backed war with Iran is raising the risk of a sustained inflation shock, with continued high oil prices and developing concerns about problems with global supply chains.”
Here is the tension to carry into everything that follows. This is primarily a supply-side shock, which means the Fed is aiming its main tool, interest rates, at a problem that rate hikes cannot fully solve. Higher borrowing costs cool demand; they do not lower the price of a barrel of crude. Whether this week’s move proves sufficient depends less on the Fed and more on whether energy pressure persists.
When big ASX news breaks, our subscribers know first
What August’s inflation numbers actually show beneath the headlines
The headline that grabbed attention was PPI at 5.4%, a number that sounds alarming on its own. Producer prices matter because they feed forward: what manufacturers and wholesalers pay today tends to show up in retail prices tomorrow. A hot PPI print is a warning about tomorrow’s consumer inflation.
Peel back a layer, and the picture gets more nuanced. Here is the full August cluster in one place.
| Measure | Reading | Period | Significance |
|---|---|---|---|
| Headline CPI (YoY) | 3.4% | August 2026 | Well above the 2% target |
| Core CPI (YoY) | 2.4% | August 2026 | Smallest rise since the post-2021 surge began |
| PPI (YoY) | 5.4% | August 2026 | Signals future consumer price pressure |
| PCE above target | 65 months | As of Sept 2026 | Structural credibility problem |
Notice the outlier. Core CPI, which strips out volatile food and energy prices to show the underlying trend, rose just 2.4% year-over-year. Bloomberg’s recap notes this is the smallest increase since the post-2021 cost-of-living surge began. On its own, that softening core print is the single data point that could argue for a pause.
The Fed cannot treat it that way, and the reason is structural. Its preferred gauge, PCE, has not touched 2% since early 2021. The Dallas Fed confirms the streak now stands at 65 consecutive months above target. When your headline measure has overshot for more than five years, a single cooler core reading is not enough evidence to stand down.
Why consumer expectations matter more than usual right now
There is one more number the Fed watches with particular care, and it moved the wrong way.
The University of Michigan’s one-year consumer inflation expectations jumped to 4.6% in September 2026, up from 4.0% in August. That one-month move matters because expectations are not just a mood reading; they can become self-fulfilling.
A concurrent rise in long-term inflation expectations alongside this short-term jump is what historically warns policymakers that elevated price levels are becoming a permanent psychological feature.
The mechanism is direct. When households expect higher prices, they demand higher wages, businesses raise prices in anticipation, and spending decisions shift forward to beat the increase. Those behaviours feed back into actual inflation, turning an expectation into a reality.
Tie that back to the 65-month overshoot and the problem sharpens. After more than five years above target, re-anchoring expectations requires visible action, not a pause. What this tells you is that the Fed cannot credibly lean on the soft core CPI print without risking an unanchoring of long-run expectations, which is the outcome it least wants. That is why the softest number in the set is unlikely to change the decision.
What markets are pricing and where the pressure points sit
Markets have already made their call, and the speed of the shift is telling.
CME FedWatch probability of a September hike moved from 41.4% the week before 31 August 2026, to 61.9% by 31 August, to roughly 90% by 11 September 2026 via Yahoo Finance. Each step tracked a data release: the PPI report on 10 September and the CPI report on 11 September firmed consensus toward near-certainty. The decision itself is now largely priced.
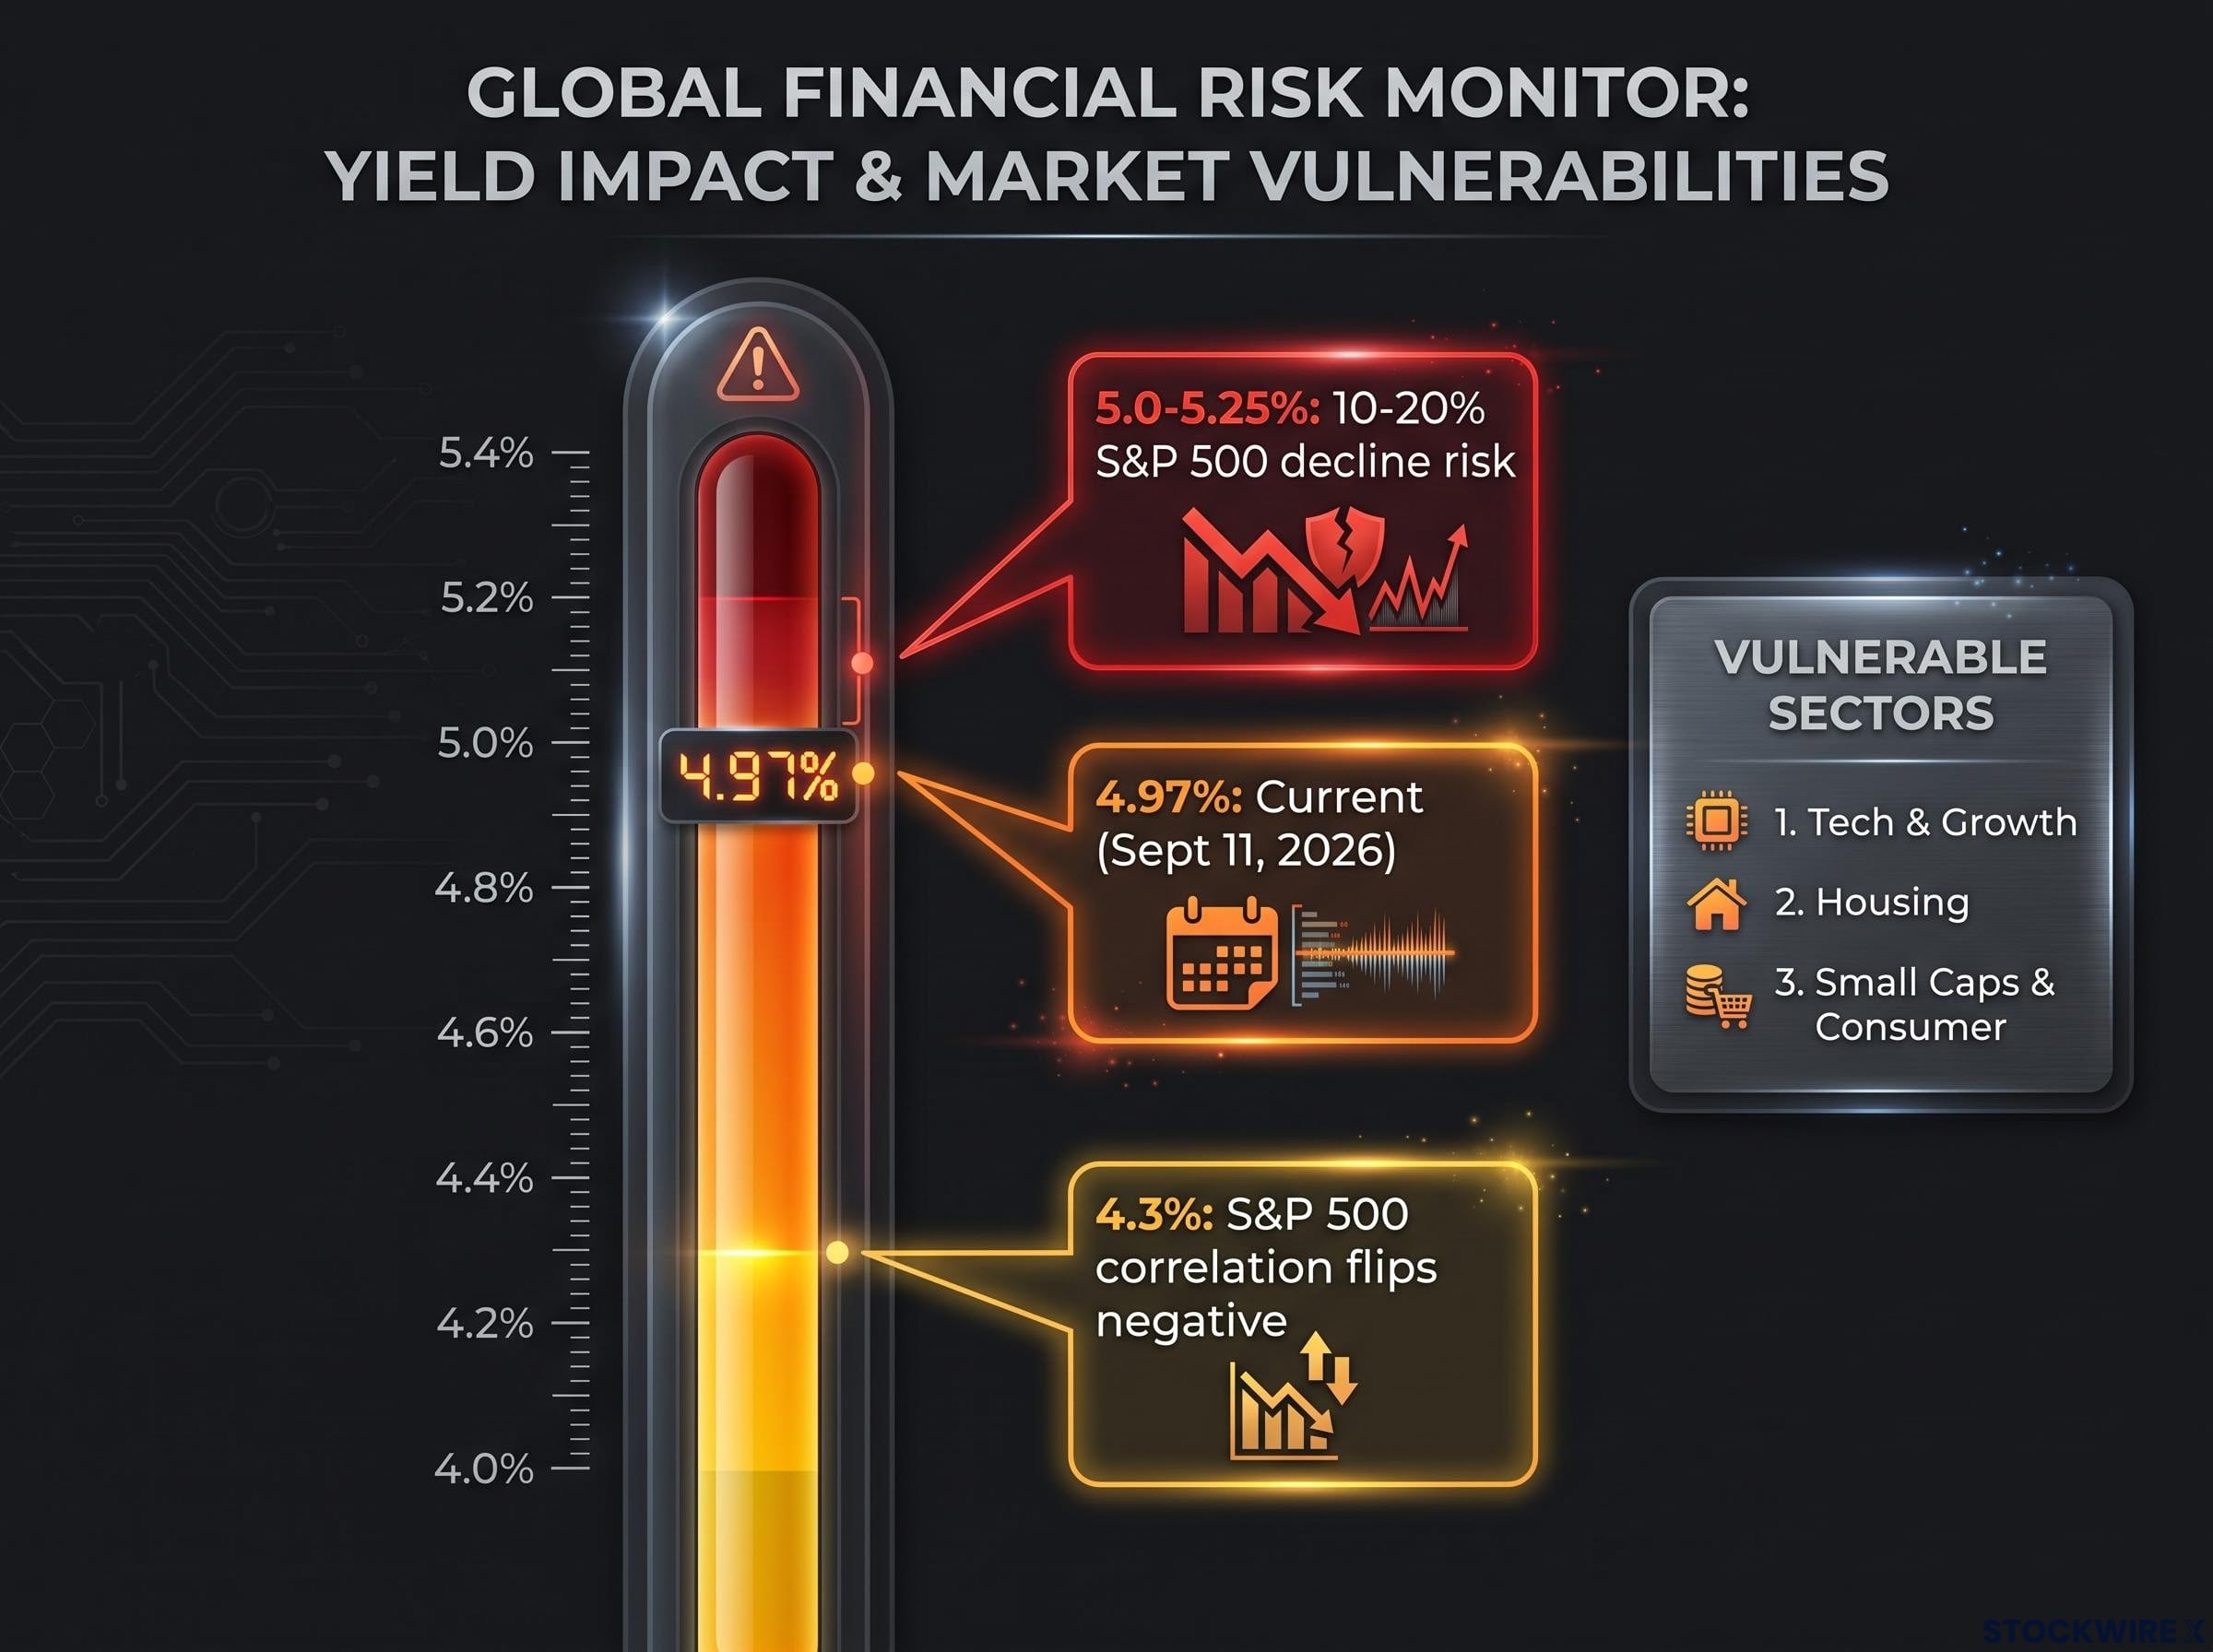
The pressure is already visible in the bond market. The 10-year U.S. Treasury yield sat at 4.97% as of 11 September 2026, per CNBC, TradingEconomics, and FRED, its highest since October 2023. In effect, bond markets are doing some of the Fed’s tightening work before the committee even meets.
That yield level is not just a number on a screen. Morningstar and MarketWatch analysis finds that when the 10-year sustains moves above roughly 4.3%, the three-month weekly correlation between the yield and the S&P 500 tends to flip negative. Stocks have historically struggled once yields hold above that threshold, and 4.97% is well past it.
Once yields breach this threshold and approach the 5% mark, equity valuation frameworks typically force institutional allocators to systematically adjust their risk premia downward, compounding the selling pressure on stocks.
Which brings the pressure to equities, ranked here by vulnerability as the research argues it:
- Technology and growth stocks: Their valuations rest on distant cash flows, which get discounted more heavily as rates rise, making them the most rate-sensitive segment.
- Housing-related shares: Directly exposed to borrowing costs, they feel yield moves fastest through mortgage demand.
- Small caps and consumer stocks: Sensitive to both borrowing costs and household demand, they tend to bear the brunt of a yield spike.
The scale of the downside risk is spelled out in survey data. A Bloomberg-based survey summarised by Yahoo Finance found that around 30% of respondents believe 10-year yields in the 5-5.25% range would be enough to trigger a 10% drop from the market peak.
A strategist cited by Business Insider argues that if the 10-year approaches around 5%, it could spark a 15-20% decline in the S&P 500, highlighting just how sensitive stretched valuations are to long-term rates.
The mortgage market as a real-time tightening indicator
For most people, the tightening is not abstract. It shows up in a mortgage quote.
CNN reports the average 30-year fixed mortgage rate at 6.71% in September 2026, the highest level since July 2025. That figure moves with bond yields, so it tightens financial conditions in real time, ahead of any Fed announcement.
The strain is measurable. The National Association of Home Builders found that the share of income needed to buy a new home rose from 32% to 34% in Q2 2026. What this means for you is concrete: if you hold a growth stock position, carry a mortgage, or own small-cap and consumer exposure, conditions are already tightening around you regardless of what the committee announces on Wednesday.
The Fed’s credibility dilemma: five years of overshoot and a supply-side shock it cannot fix
Step inside the room, and the decision is harder than the 90% probability suggests.
On one side sits the credibility obligation. Sixty-five months of PCE above target has worn institutional patience thin, and the language from senior officials shows it. Kansas City Fed President Jeffrey Schmid has characterised inflation as “persistently resistant” to the Fed’s efforts.
“Price stability should be the Fed’s predominant focus right now,” Fed Chair Kevin Warsh said at the 2026 Jackson Hole symposium, a line that reads as a clear institutional signal that tolerance for further overshoot is close to exhausted.
On the other side sits a legitimate counterargument. The IMF’s 2026 Article IV consultation projects core PCE returning to 2% in the first half of 2027 under current conditions and explicitly cautions against over-tightening into energy-driven shocks. That is a credible institution telling the Fed to be careful.
The macro risk backs the hold camp. Both U.S. Bank and a Goldman Sachs-linked analysis put the 12-month U.S. recession probability at roughly 30%, with U.S. Bank flagging that a sustained oil move above $130 per barrel could tip an already-vulnerable expansion. Hiking into that risk is not costless.
Here the two cases sit side by side:
| Case for hiking | Case for pausing |
|---|---|
| 65 months of PCE overshoot demands visible action to protect credibility | IMF projects PCE back to 2% by early 2027 without aggressive tightening |
| Consumer expectations jumped to 4.6%, risking an unanchoring | Roughly 30% recession probability makes further tightening risky |
| Officials signal tolerance for overshoot is exhausted | Rate hikes are a blunt tool against a supply-side energy shock |
The blunt-tool problem is the crux. A Wall Street strategist argued in late August 2026 that tariffs and the AI capital-spending boom are “tag-teaming” to keep inflation sticky, adding “we’re not in a wage price spiral.” Real wage growth has declined in recent months, which confirms the point: this is a supply-side problem, and rate hikes address demand.
What this leaves you with is not a clean answer. Hiking is not obviously correct, and pausing is not obviously reckless. Anyone trying to read the Fed’s next move has to hold both sides of that trade-off at once.
For readers wanting to explore why prioritizing credibility could fracture the expansion, our deep-dive into the policy error of tightening into supply shocks breaks down the historical precedents and structural employment data.
What the hike changes, and what it leaves unresolved
The data convergence has made this week’s hike a near-certainty. But with roughly 90% already priced in as of 11 September 2026, the decision itself is almost beside the point. The signal that matters is the forward guidance: the dot plot revision and the press conference language on future meetings.
Three variables will determine whether this is the last hike or the start of another leg:
- Oil prices. Whether the Iran conflict stabilises or escalates sets the inflation trajectory. Rate hikes cannot lower crude, so this remains the master variable.
- Consumer expectations. The University of Michigan reading jumped to 4.6% in September. The October print will show whether that elevation is entrenching or a one-month blip.
- The 10-year yield. At 4.97%, it sits just below the level where the yield-equity correlation historically turns hostile. Watch whether it breaks and holds above 5% after the decision.
The tension from the first section still hangs over all of it. A rate hike addresses demand; this inflation problem is substantially supply-driven. Until oil stabilises, the data will keep the Fed in an uncomfortable spot no matter what it decides on Wednesday, and the IMF’s own upside scenario warns the return to 2% could slip to end-2027 if energy and tariff risks materialise.
The hike resolves the immediate decision. It does not resolve the underlying problem.
This article is for informational purposes only and should not be considered financial advice. Investors should conduct their own research and consult with financial professionals before making investment decisions.
Past performance does not guarantee future results. Financial projections are subject to market conditions and various risk factors. These statements are speculative and subject to change based on market developments and central bank decisions.