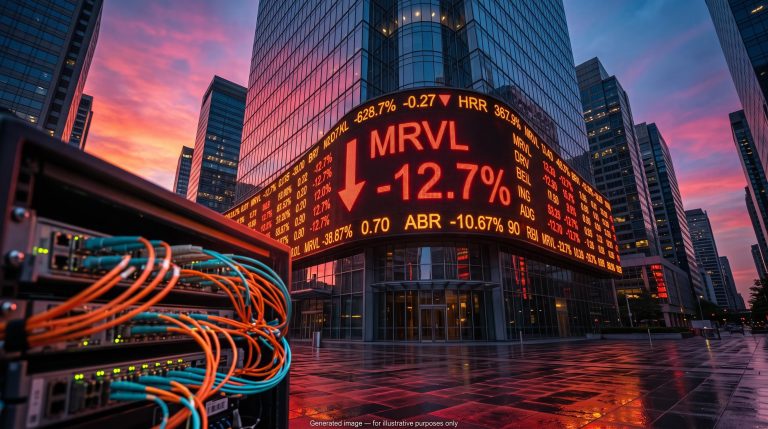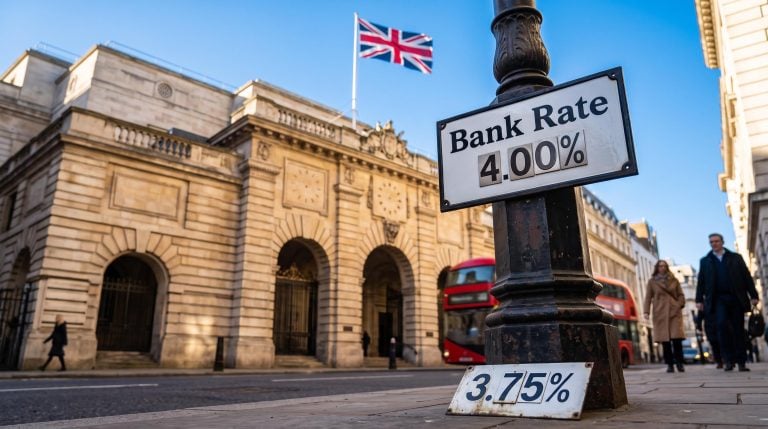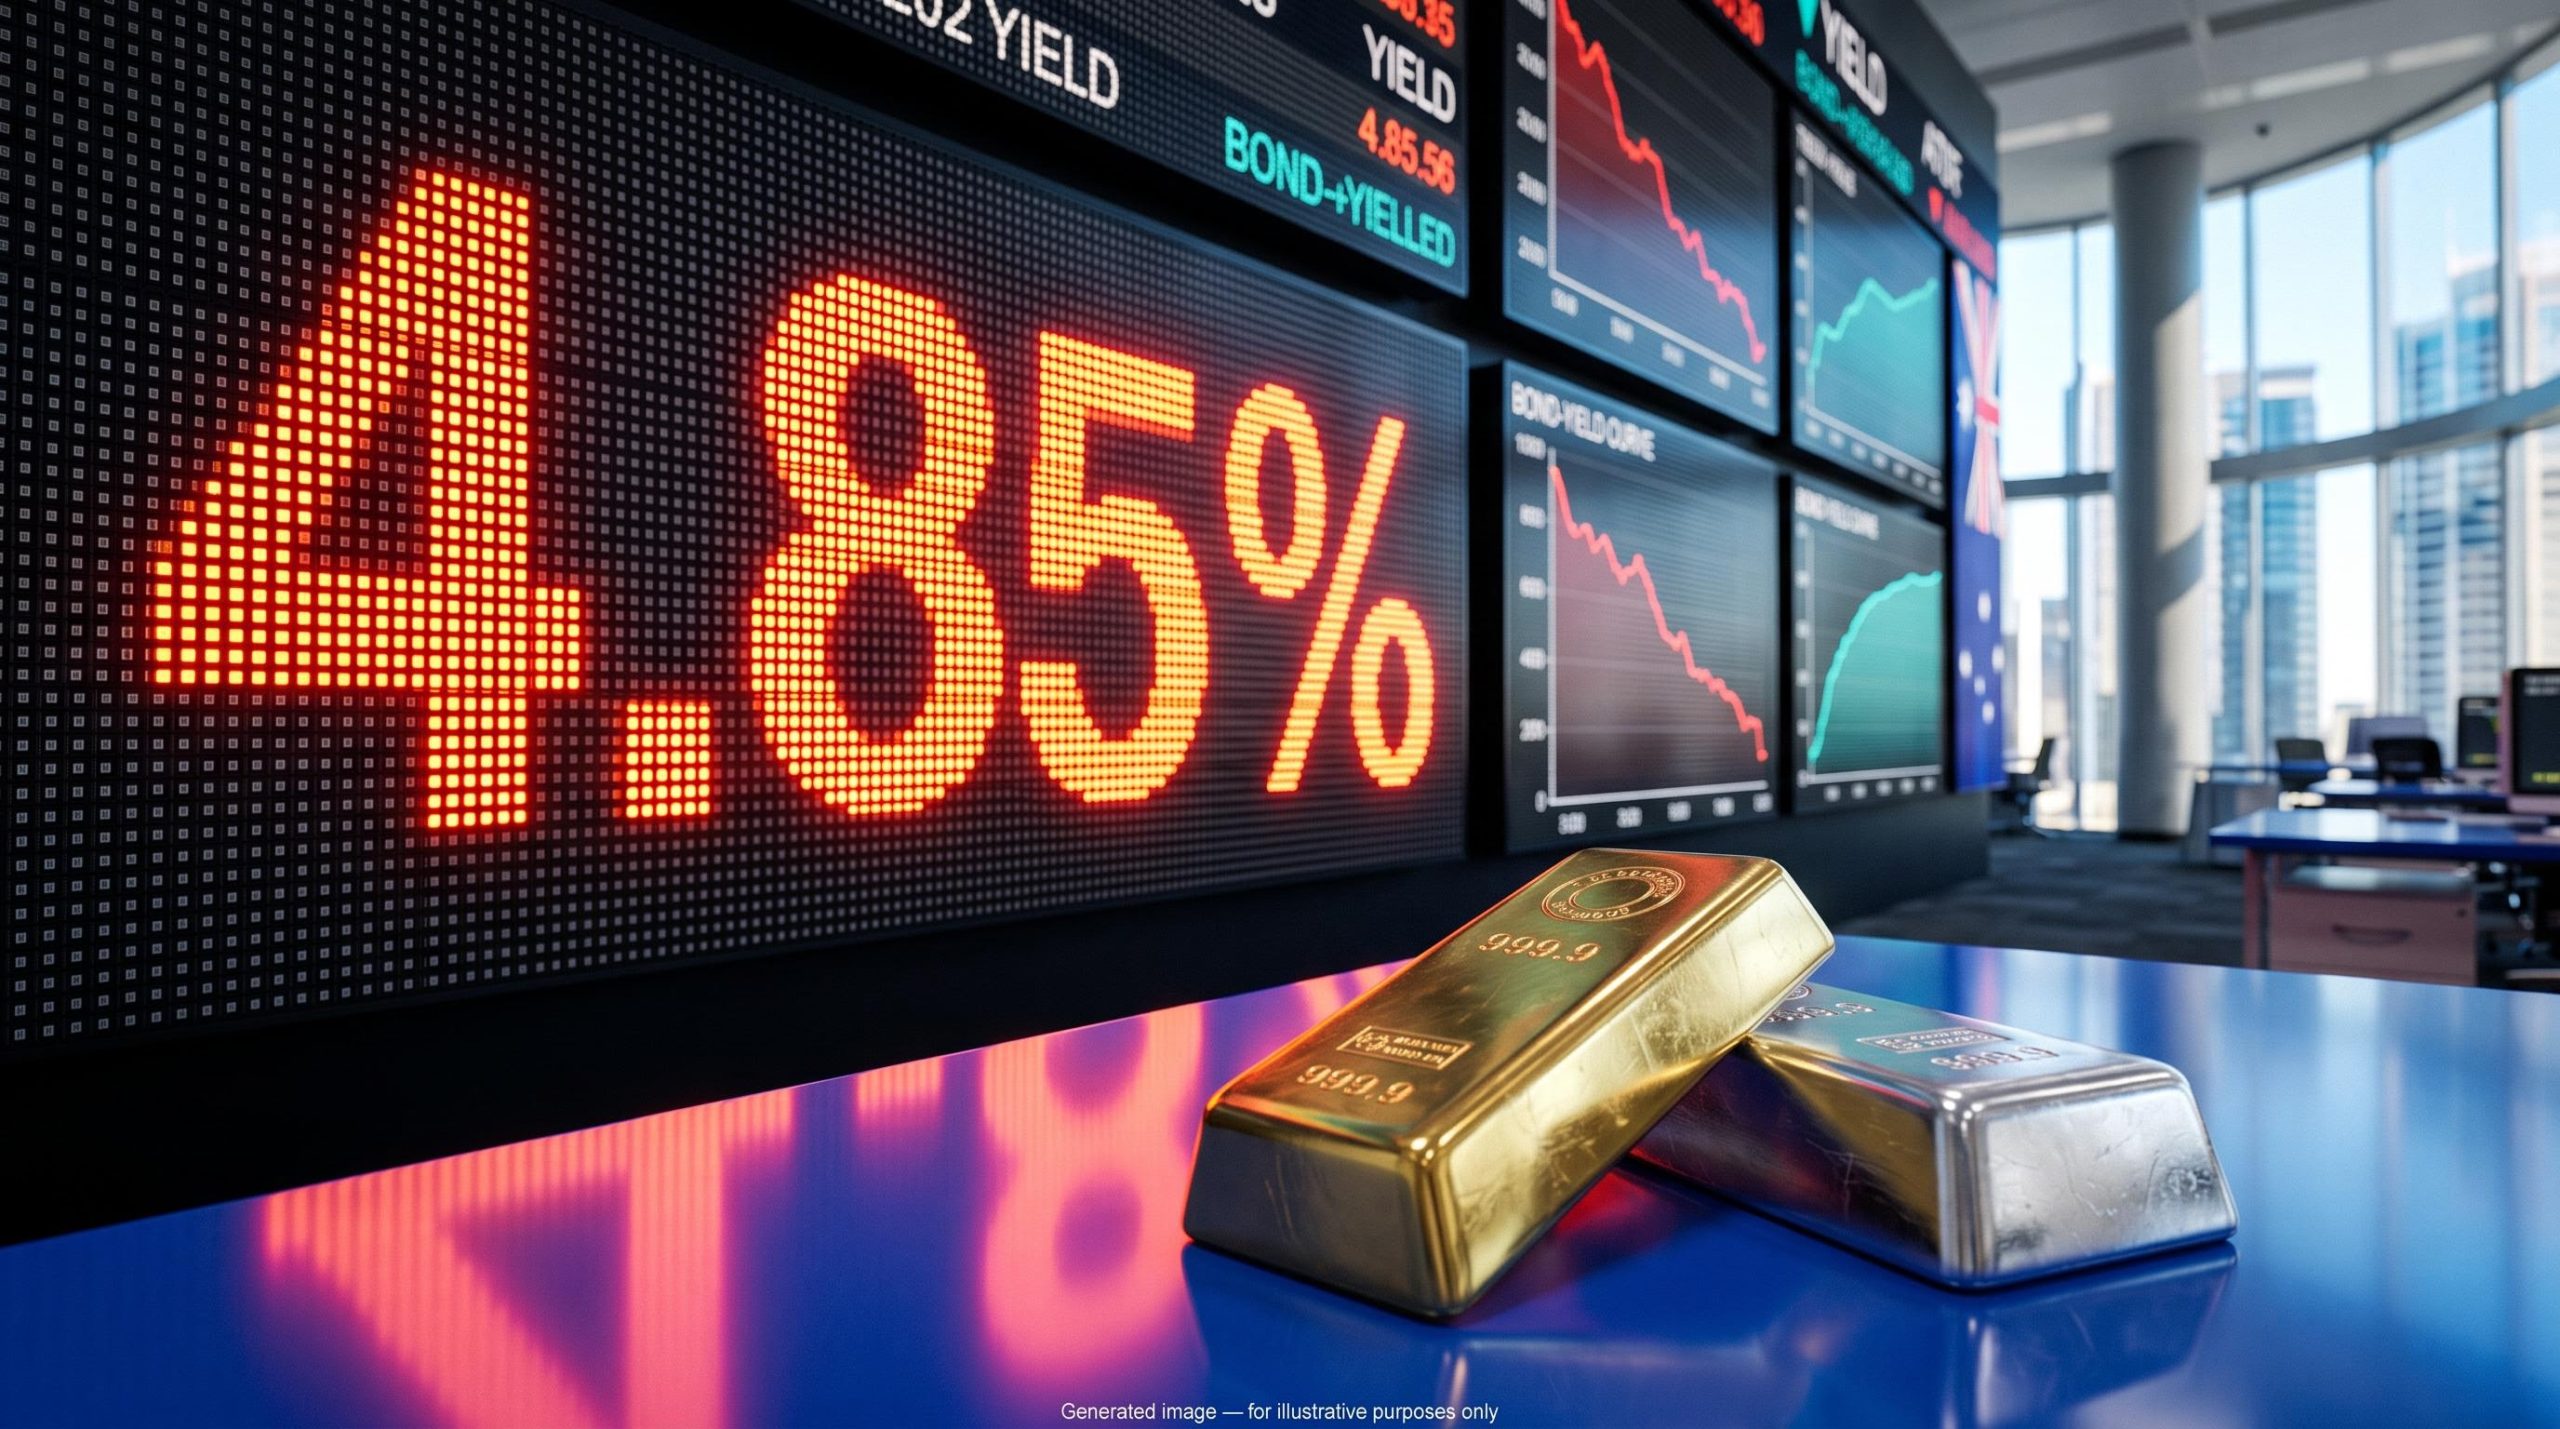
Stocks could not hold a bounce, gold and silver sagged, and Treasuries rallied, all while US data stayed firm and the Reserve Bank of Australia (RBA) lifted its cash rate to 4.85%. That mix runs against the usual script, and this cross-asset market wrap traces why yields, not headline growth, set the direction across markets.
The moves came on Monday 2 November and Tuesday 3 November, the first two sessions of US midterm election week. The S&P 500 fell 0.51% and then gained 0.36%, while the Nasdaq Composite dropped 1.07% before recovering 0.83%.
Neither rebound changed the picture. Earnings were tracking ahead, the US economy grew at a 3.4% annualised pace last quarter, and manufacturing strengthened.
Here is what those two sessions suggest about where rates, the dollar and risk assets may head next, and which dated events could test that read before the week is out.
Why did stocks stall and metals slip while oil held firm?
The failed equity rebound was the clearest signal. The S&P 500 tried to recover from the prior Friday’s selloff, gave way on Monday, bounced again on Tuesday and finished close to where it started. On the 4-hour chart, the index was turned back at a resistance zone where it had stalled before.
The Nasdaq looked weaker. Its Monday close of 25,164.32 was its lowest since late July. Earnings did not lift sentiment either: blended growth stood at 30% as of the prior Friday, up from 29% a month earlier.
Higher yields hit equities through the discount-rate channel, which lowers the present value of future cash flows and compresses price-to-earnings multiples even when earnings are unchanged, a mechanism that hits long-duration technology shares hardest.
IA Spievac, head of global macro at Tasty Live, said rallies were being treated as chances to set up better short entries, not as buying opportunities. That tells you dip buyers are absent on current data, so a single bounce is not confirmation that the selling is over.
| Market | Monday 2 Nov | Tuesday 3 Nov | Move or note |
|---|---|---|---|
| S&P 500 | 7,541.40 | 7,568.92 | -0.51%, then +0.36% |
| Nasdaq | 25,164.32 | 25,372.01 | -1.07%, then +0.83% |
| Gold | ~US$3,900-3,950/oz | ~US$3,930/oz | Downtrend, weak bounces |
| Silver | ~US$50.50-51.00/oz | ~US$49.7/oz | Consolidating, trend lower |
| WTI | ~US$96.62 settle | ~US$96.75/bbl | Diplomacy drop, partial rebound |
| Brent | ~US$104.96 settle | ~US$104.26/bbl | Slightly lower |
Sources conflict on some intraday and closing figures, so treat the commodity levels as approximate.
Metals and crude
Gold and silver traded the same way as stocks: weak bounces inside downtrends. Gold was rejected again beneath last week’s breakdown level, after falling nearly 7% in October. Higher yields raised the cost of holding metals that pay no income, resilient US spending trimmed safe-haven demand, diplomacy reduced the geopolitical premium, and post-October profit-taking added pressure.
ANZ analysts reportedly see gold consolidating around US$4,000 or below before a more lasting recovery, though that view has not been independently confirmed.
Crude whipsawed. Oil fell early in the week on reports that Washington would try diplomacy again, then recovered part of the drop as traders reassessed the odds of a deal. The midterms add two channels to watch: a Congress willing to challenge the president on war powers, and shifts in fiscal policy.
What did the RBA hike and mixed US data tell bond markets?
The RBA’s decision was firm on the level and cautious on the signal.
RBA decision, 3 November 2026 Cash rate raised 25bp to 4.85%, the fifth hike this year and an 18-year high. The vote split 6-3, with three members preferring to hold.
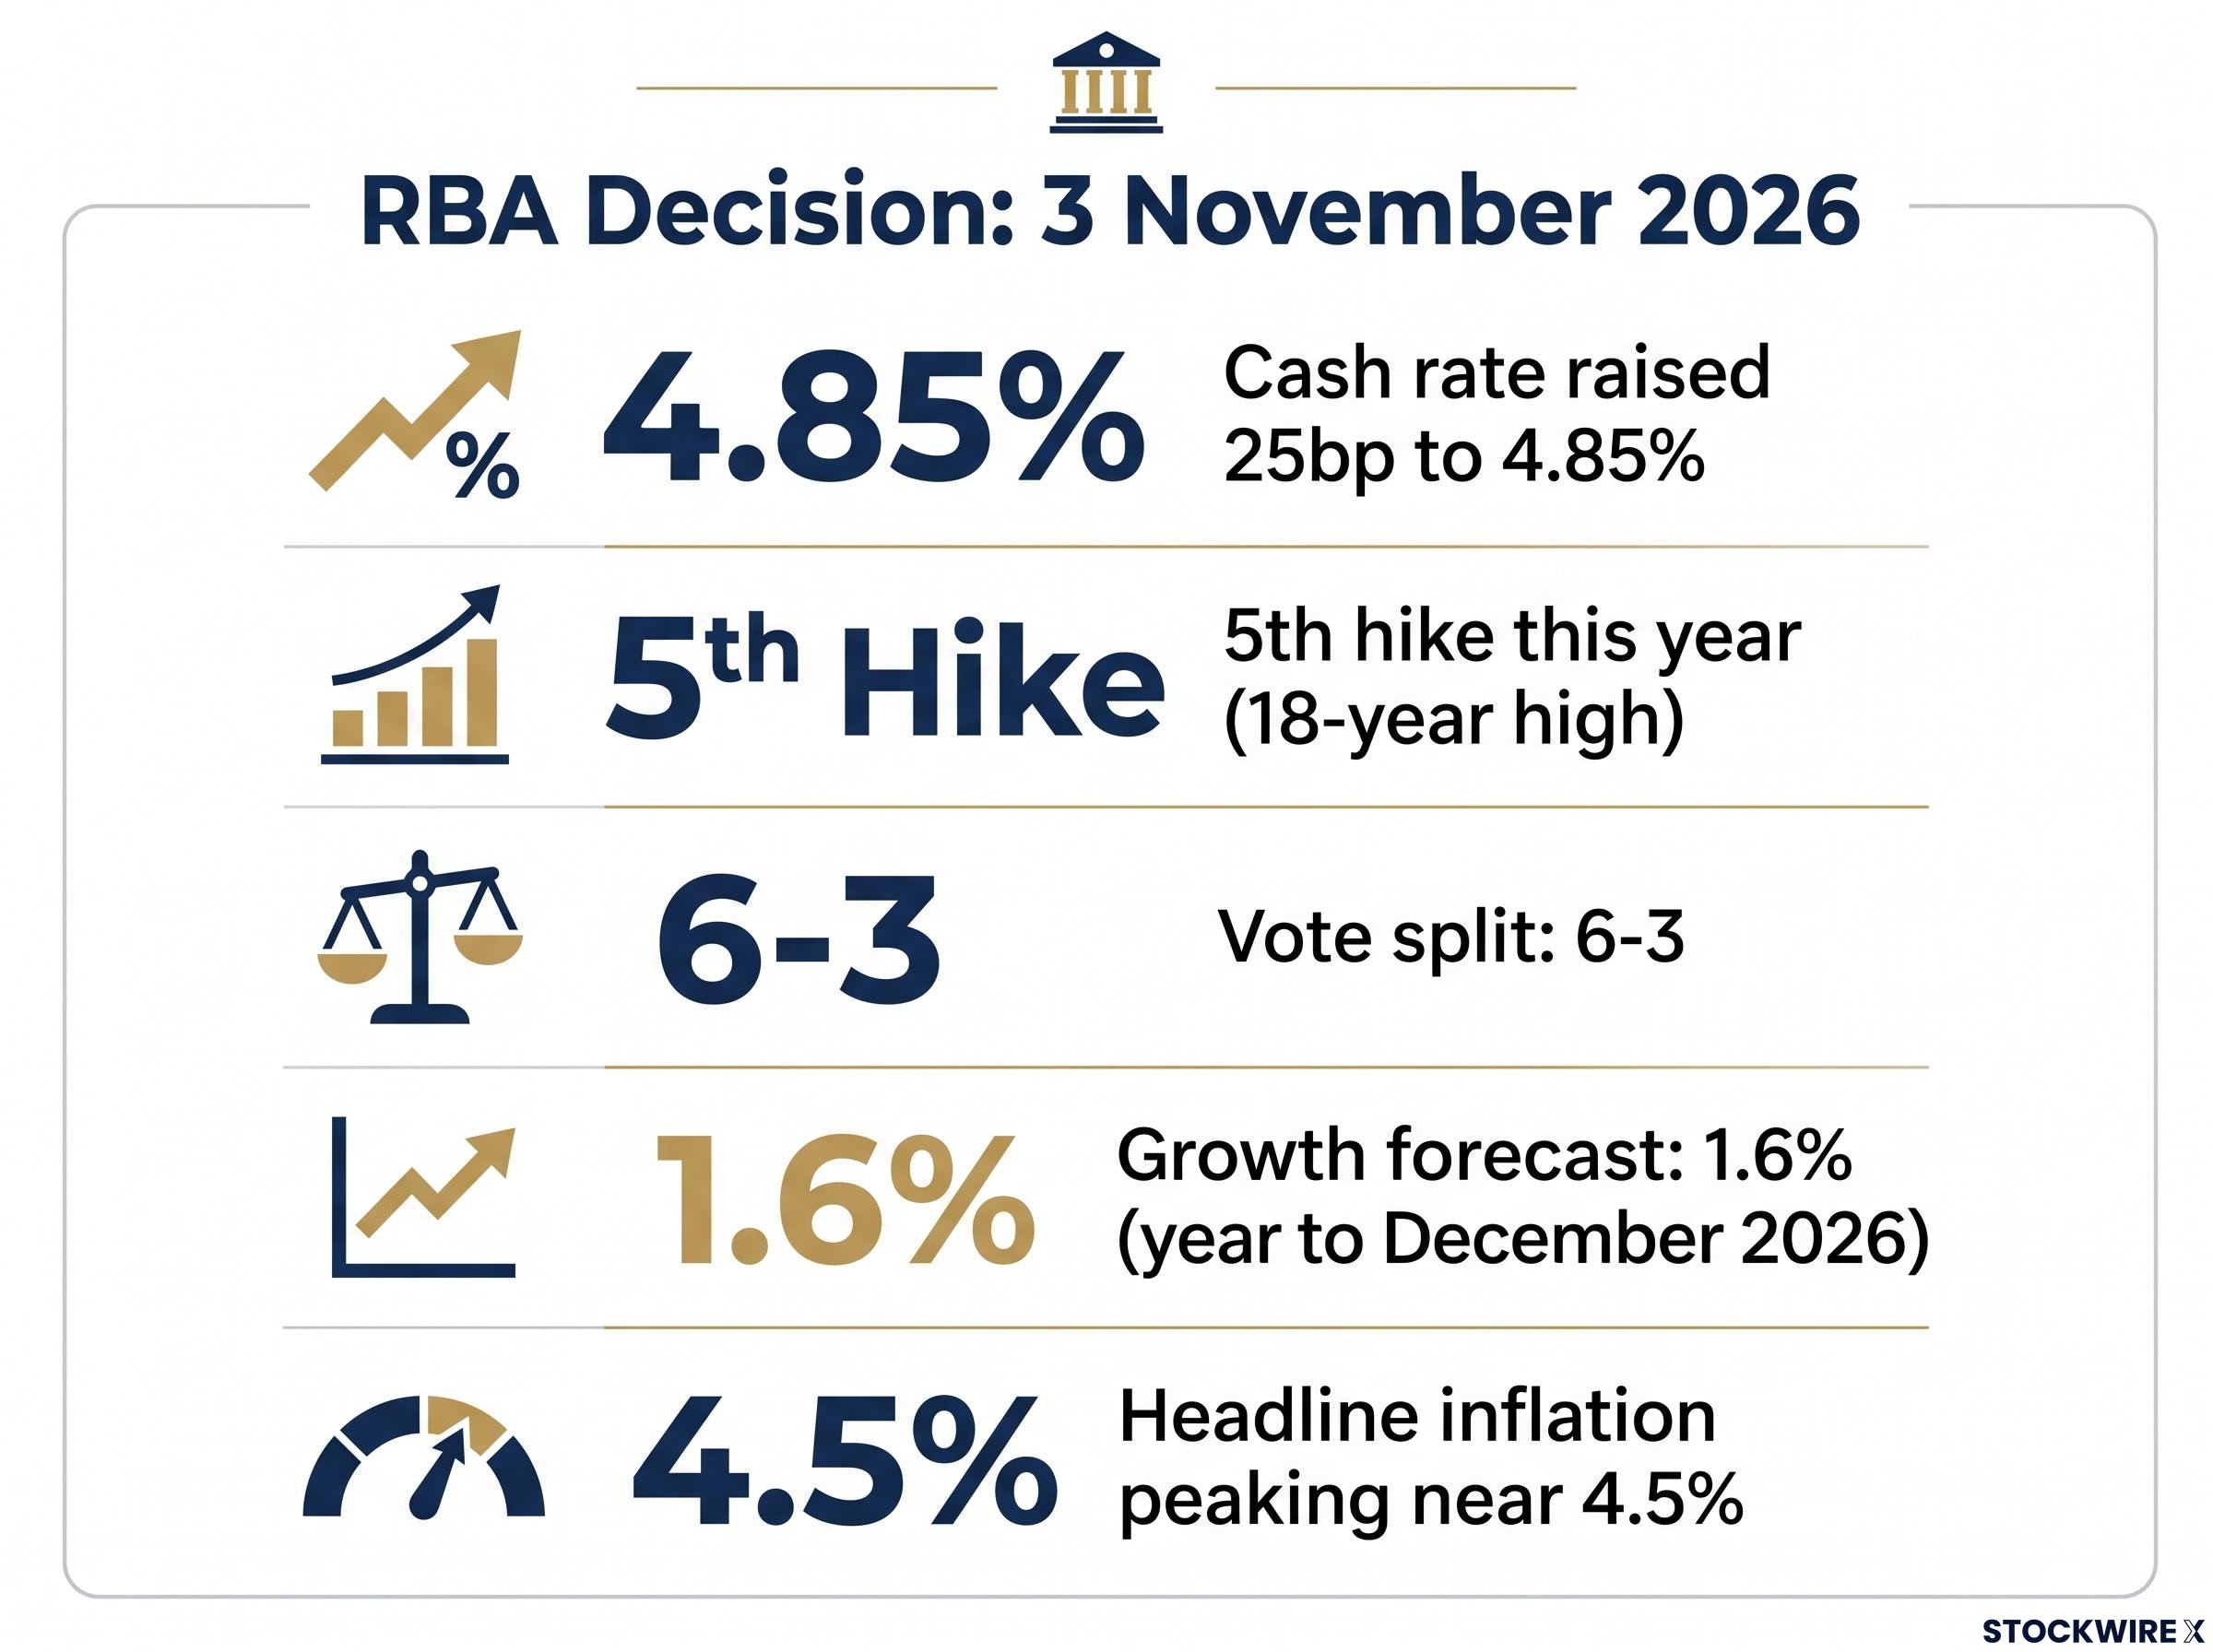
The board kept its “do what is necessary” wording but dropped language signalling readiness to hike again. The Australian dollar fell about 0.3-0.45% to roughly US$0.697-0.698, as markets read the split vote as a sign the cycle may be near its end.
The RBA forecasts growth of 1.6% in the year to December 2026, with headline inflation peaking near 4.5%. Governor Michele Bullock said the bank was preserving its options. Shane Oliver of AMP reportedly puts Australian recession odds at 30-40%, a figure not independently verified.
US data looked solid. The ISM manufacturing index, a monthly survey of purchasing managers where a reading above 50 means activity is expanding, rose to 55.5 from 54.5, a tenth straight month of expansion. JOLTS, a government survey of job openings, hires and layoffs, showed 7.523 million openings against roughly 7.1 million expected, and layoffs were the lowest since March 2025.
Why Treasuries rallied on solid data
The contradiction resolves once you separate today’s activity from where policy goes next.
- Growth is narrow. Third-quarter GDP rose 3.4% largely on AI-related investment, with consumption running at about 3.8% annualised and adding about 2.5 points.
- Imports distorted the headline. They subtracted about 3.2 points, partly on pricier energy and tariffs.
- The details softened. ISM employment cooled and backlog growth slowed beneath the strong headline.
- Fed pricing shifted. Markets still expect a December hike but now doubt more than one.
Bonds price the path of policy, not the last quarter, so strong backward-looking data does not automatically push yields higher. The counter-risk is stagflation: energy, tariffs and AI spending could keep inflation sticky as growth slows. Australia may be an early signal, though its heavy mortgage exposure and China ties make it an imperfect template.
Barclays strategists have framed a supply-side stagflation threat as structurally different from a demand-driven inflation episode, with sustained Brent in the $90-$100 range the key base risk for equity portfolios.
Yield and dollar figures conflict across sources, with the 10-year near 4.93-4.95% and the DXY around 101.82, up 0.1%. The dollar’s softness was concentrated in specific currency pairs.
How is one macro trader positioned, and what are the next catalysts?
As of Tuesday, Spievac was short gold, silver and US stocks, long bonds, and long the Australian dollar, pound, euro and Canadian dollar. He also held a small Bitcoin bet with 17 days to expiry, and he exited a long oil position late Monday while still seeing oil’s trend as higher. This is one trader’s view, not a recommendation.
He expresses the stock shorts through put verticals and the bond long through call verticals on TLT, the iShares 20+ Year Treasury Bond ETF. A vertical spread buys one option and sells another at a different strike price with the same expiry. A bull call spread costs money upfront, called a debit. A bull put spread pays you upfront, called a credit, and profits if the price holds above the strike you sold.
| Spread | Construction | Max loss | Max profit | Breakeven |
|---|---|---|---|---|
| Bull call spread | Buy US$100 call, sell US$105 call, US$1.50 debit | US$150 | US$350 | US$101.50 |
| Bull put spread | Sell US$100 put, buy US$95 put, US$1.50 credit | US$350 | US$150 | US$98.50 |
Defined-risk spreads cap what you can lose and what you can make, so the structure matters as much as the market view. A TLT call spread loses if yields rise, bleeds value through time decay, can lose value if implied volatility falls, and caps gains.
These are the dated tests ahead:
- Thursday 5 November: Bank of England decision
- Friday: US October jobs report
- This week: midterm outcomes, including war powers and fiscal control
- Ongoing: oil’s reaction to diplomacy headlines
What this week’s cross-asset signals do, and do not, settle
Two sessions showed yields, not current data, steering stocks, metals and currencies. They did not settle whether the US follows Australia into a slowdown.
A weaker jobs report on Friday or softer consumption would support the slowdown read and the bond rally. Oil pushing back above US$100 or sticky inflation would point to stagflation, where yields rise even as growth fades. Thursday’s Bank of England decision is the first test, and Friday’s payrolls the bigger one.
For investors weighing the stagflation versus slowdown question, our detailed coverage of bond yields and equity risk explains how compressed risk premia leave little valuation buffer.
This article is for informational purposes only and should not be considered financial advice. Investors should conduct their own research and consult with financial professionals before making investment decisions.