
US-Iran Framework Sends Nasdaq Futures Up 1.4%, Brent Below $100
1 hr ago


Wall Street typically punishes defence contractors for top-line revenue contraction. Parsons Corporation just proved that exceptional margin execution can flip the script entirely. Analysing the Parsons corporate earnings report from 29 April 2026 reveals a complex first quarter that requires looking past surface-level metrics to understand the underlying health of the business.
This analysis breaks down the true drivers behind the mixed financial report. Strategic cash management and robust division-level growth successfully offset significant single-contract headwinds. Understanding this dynamic clarifies how the company maintained profitability despite apparent top-line pressure.
Investors often treat headline revenue figures as the definitive measure of corporate momentum. The latest quarterly results from the infrastructure and national security provider demonstrate why this approach falls short. By isolating the specific contract drags and examining core operational efficiency, a clearer picture emerges of a company expanding its profitable foundation.
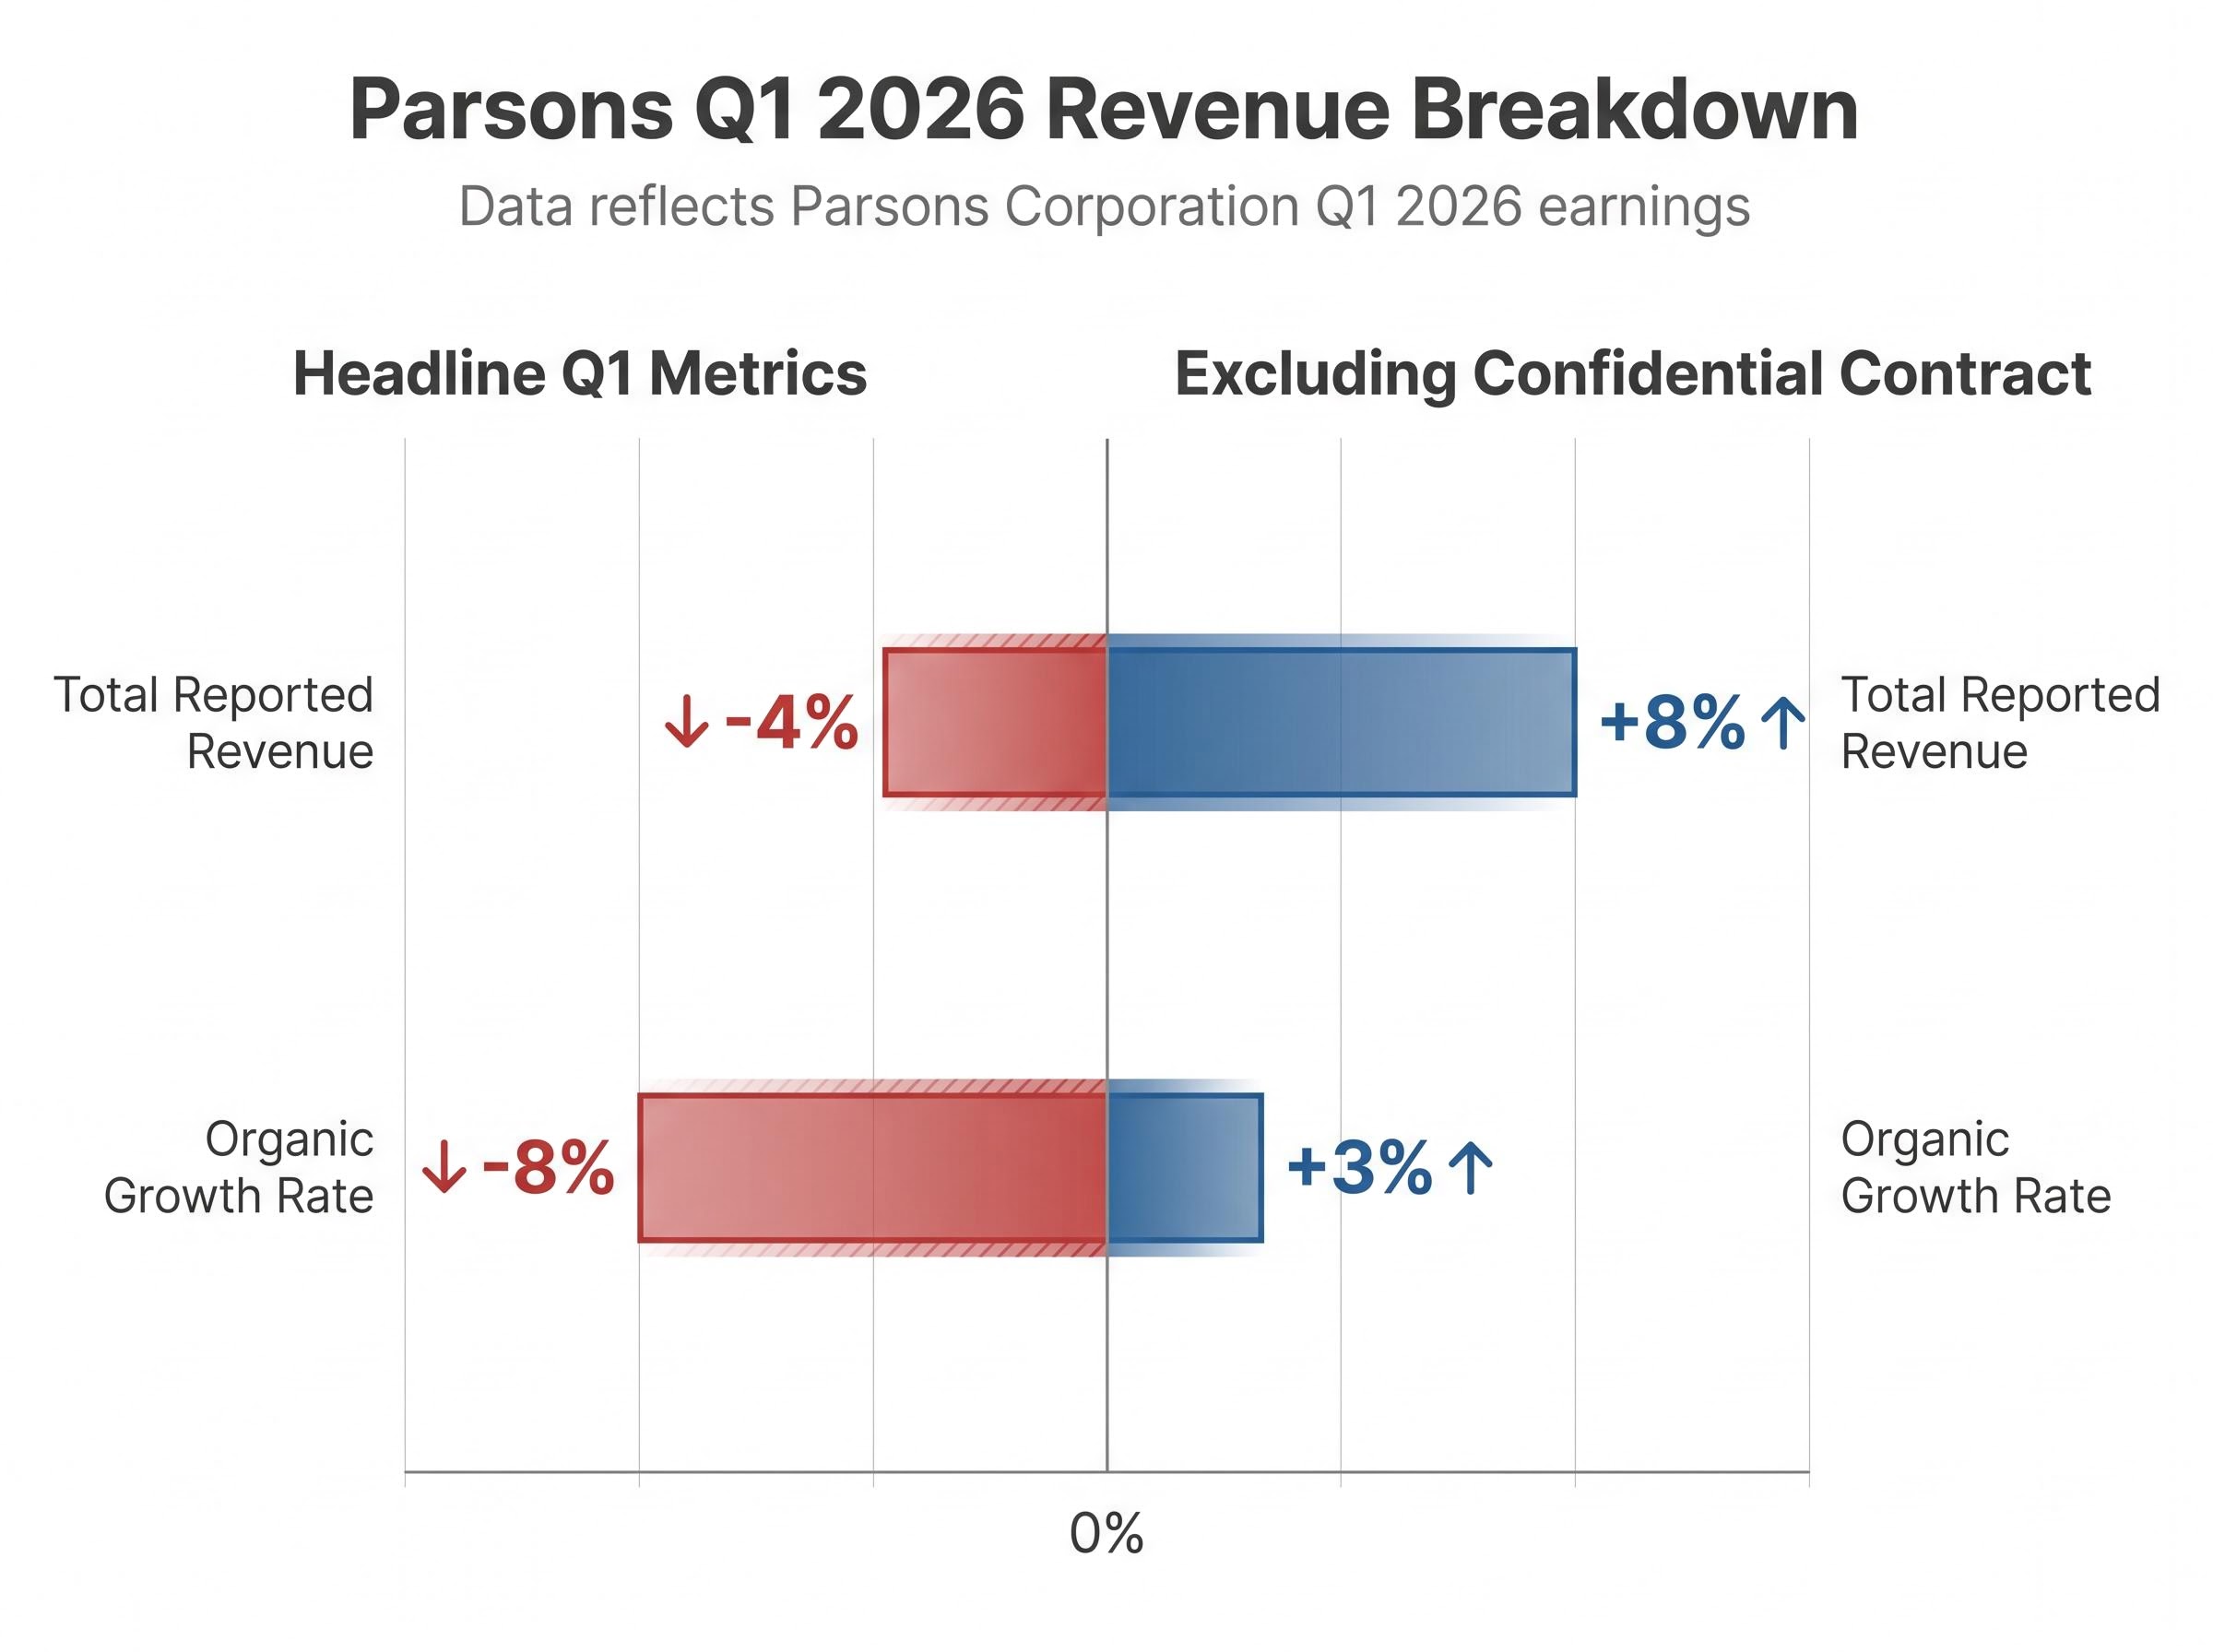
The headline numbers present an immediate contradiction for market observers. The company reported $1.5 billion in total first-quarter revenue, representing a 4 percent annual drop and an 8 percent organic decrease. These top-line figures suggest a contracting business model, but they mask a completely different operational reality underneath.
The official Form 10-Q filing confirms that this initial revenue drop remains entirely concentrated within a single project, shielding the broader enterprise from systemic financial impact.
Isolating the specific source of this drag reveals a much stronger core business. The entire revenue decline stems from lower volume on a single fixed-price confidential contract. When analysts exclude this specific agreement from the calculations, the underlying enterprise tells a story of steady expansion.
| Metric Category | Total Reported Revenue | Organic Growth Rate |
|---|---|---|
| Headline Q1 Metrics | -4% | -8% |
| Excluding Confidential Contract | +8% | +3% |
Without the shadow of this classified contract, revenue grew 8 percent annually and 3 percent organically. The company achieved this expansion through robust performance across multiple core divisions. The transportation, space, missile defence, and critical infrastructure security units all successfully drove growth during the quarter.
The space and missile defence divisions in particular are experiencing sustained market demand. This core growth provides a more accurate reflection of the company’s competitive positioning in the current geopolitical environment.
Investors need to understand that a headline revenue miss does not always indicate systemic business failure. Isolating the specific contract drag allows market participants to see the actual momentum in the core operations. The divergence between the consolidated print and the underlying unit growth highlights why sector-specific analysis remains vital.
The true operational story of the first quarter lives in the profitability metrics. The company squeezed record margins out of a contracting top line, achieving a milestone 10.1 percent adjusted EBITDA margin. This operational efficiency generated $151 million in adjusted EBITDA, signalling strict corporate cost control.
This exceptional profitability immediately sparked a positive pre-market share price reaction, as institutional investors recognised the underlying strength of the company’s cost control initiatives.
CEO Commentary “Our first quarter results highlighted the resilience of our business. We delivered our highest adjusted EBITDA margin ever, reached record levels for both total and funded backlog, and achieved a robust book-to-bill ratio of 1.4x,” said Carey Smith, Chief Executive Officer.
The bottom-line numbers present a complex dynamic between adjusted performance and statutory reporting. According to reports, adjusted earnings per share reached $0.79, beating Wall Street projections by $0.10. Conversely, total net income dropped, and operating income fell 12 percent to $96 million.
The adjusted earnings beat reinforces the narrative of strong internal cost discipline. Management successfully insulated the bottom line from the revenue contraction by optimising project delivery and reducing overhead.
This divergence stems directly from the classified contract drag combined with planned acquisition-related expenses. These accounting drops in net income do not reflect the cash-generating strength of the actual business operations. Operational cash utilisation improved during the quarter, a strong positive shift compared to the exact same period last year.
This improvement in cash management demonstrates the underlying quality of the earnings beat. By limiting cash consumption while expanding adjusted EBITDA margins, the firm proved it can operate highly efficiently even when specific major contracts experience volume pauses.
Defence sector earnings reports often confuse investors who lack familiarity with specific government procurement models. A single agreement can dramatically skew an entire quarter’s financial optics depending on its structural classification. Understanding these mechanisms provides the analytical tools needed to evaluate future sector performance accurately.
The federal government typically procures services through either fixed-price or cost-reimbursable models. Under a cost-plus structure, the contractor passes allowable expenses to the government alongside a predetermined fee, offering highly predictable but lower margins. Fixed-price agreements require the contractor to deliver a specified capability for a set dollar amount, regardless of the actual costs incurred.
The Federal Acquisition Regulation Part 16 guidelines formally define these structural approaches, dictating exactly how financial risk and margin potential shift between the contractor and the government.
The risk profiles differ significantly between these two approaches:
Fixed-Price Agreements: Contractors assume the primary financial risk of cost overruns but capture higher margins if they execute efficiently. Volume fluctuations flow directly to the bottom line. Cost-Plus Agreements: The government bears the primary financial risk, providing revenue stability for the contractor at the expense of margin upside. * Volume Sensitivity: Fixed-price projects with lower-than-expected activity levels immediately reduce quarterly operating income without necessarily indicating long-term operational failure.
This structural dynamic directly explains the 12 percent drop in operating income for this specific quarter. Lower volume on one massive fixed-price classified project flowed immediately into the operating income calculation. The underlying enterprise remains healthy, but the mechanics of this specific contracting vehicle amplified the financial impact of a temporary volume lull.
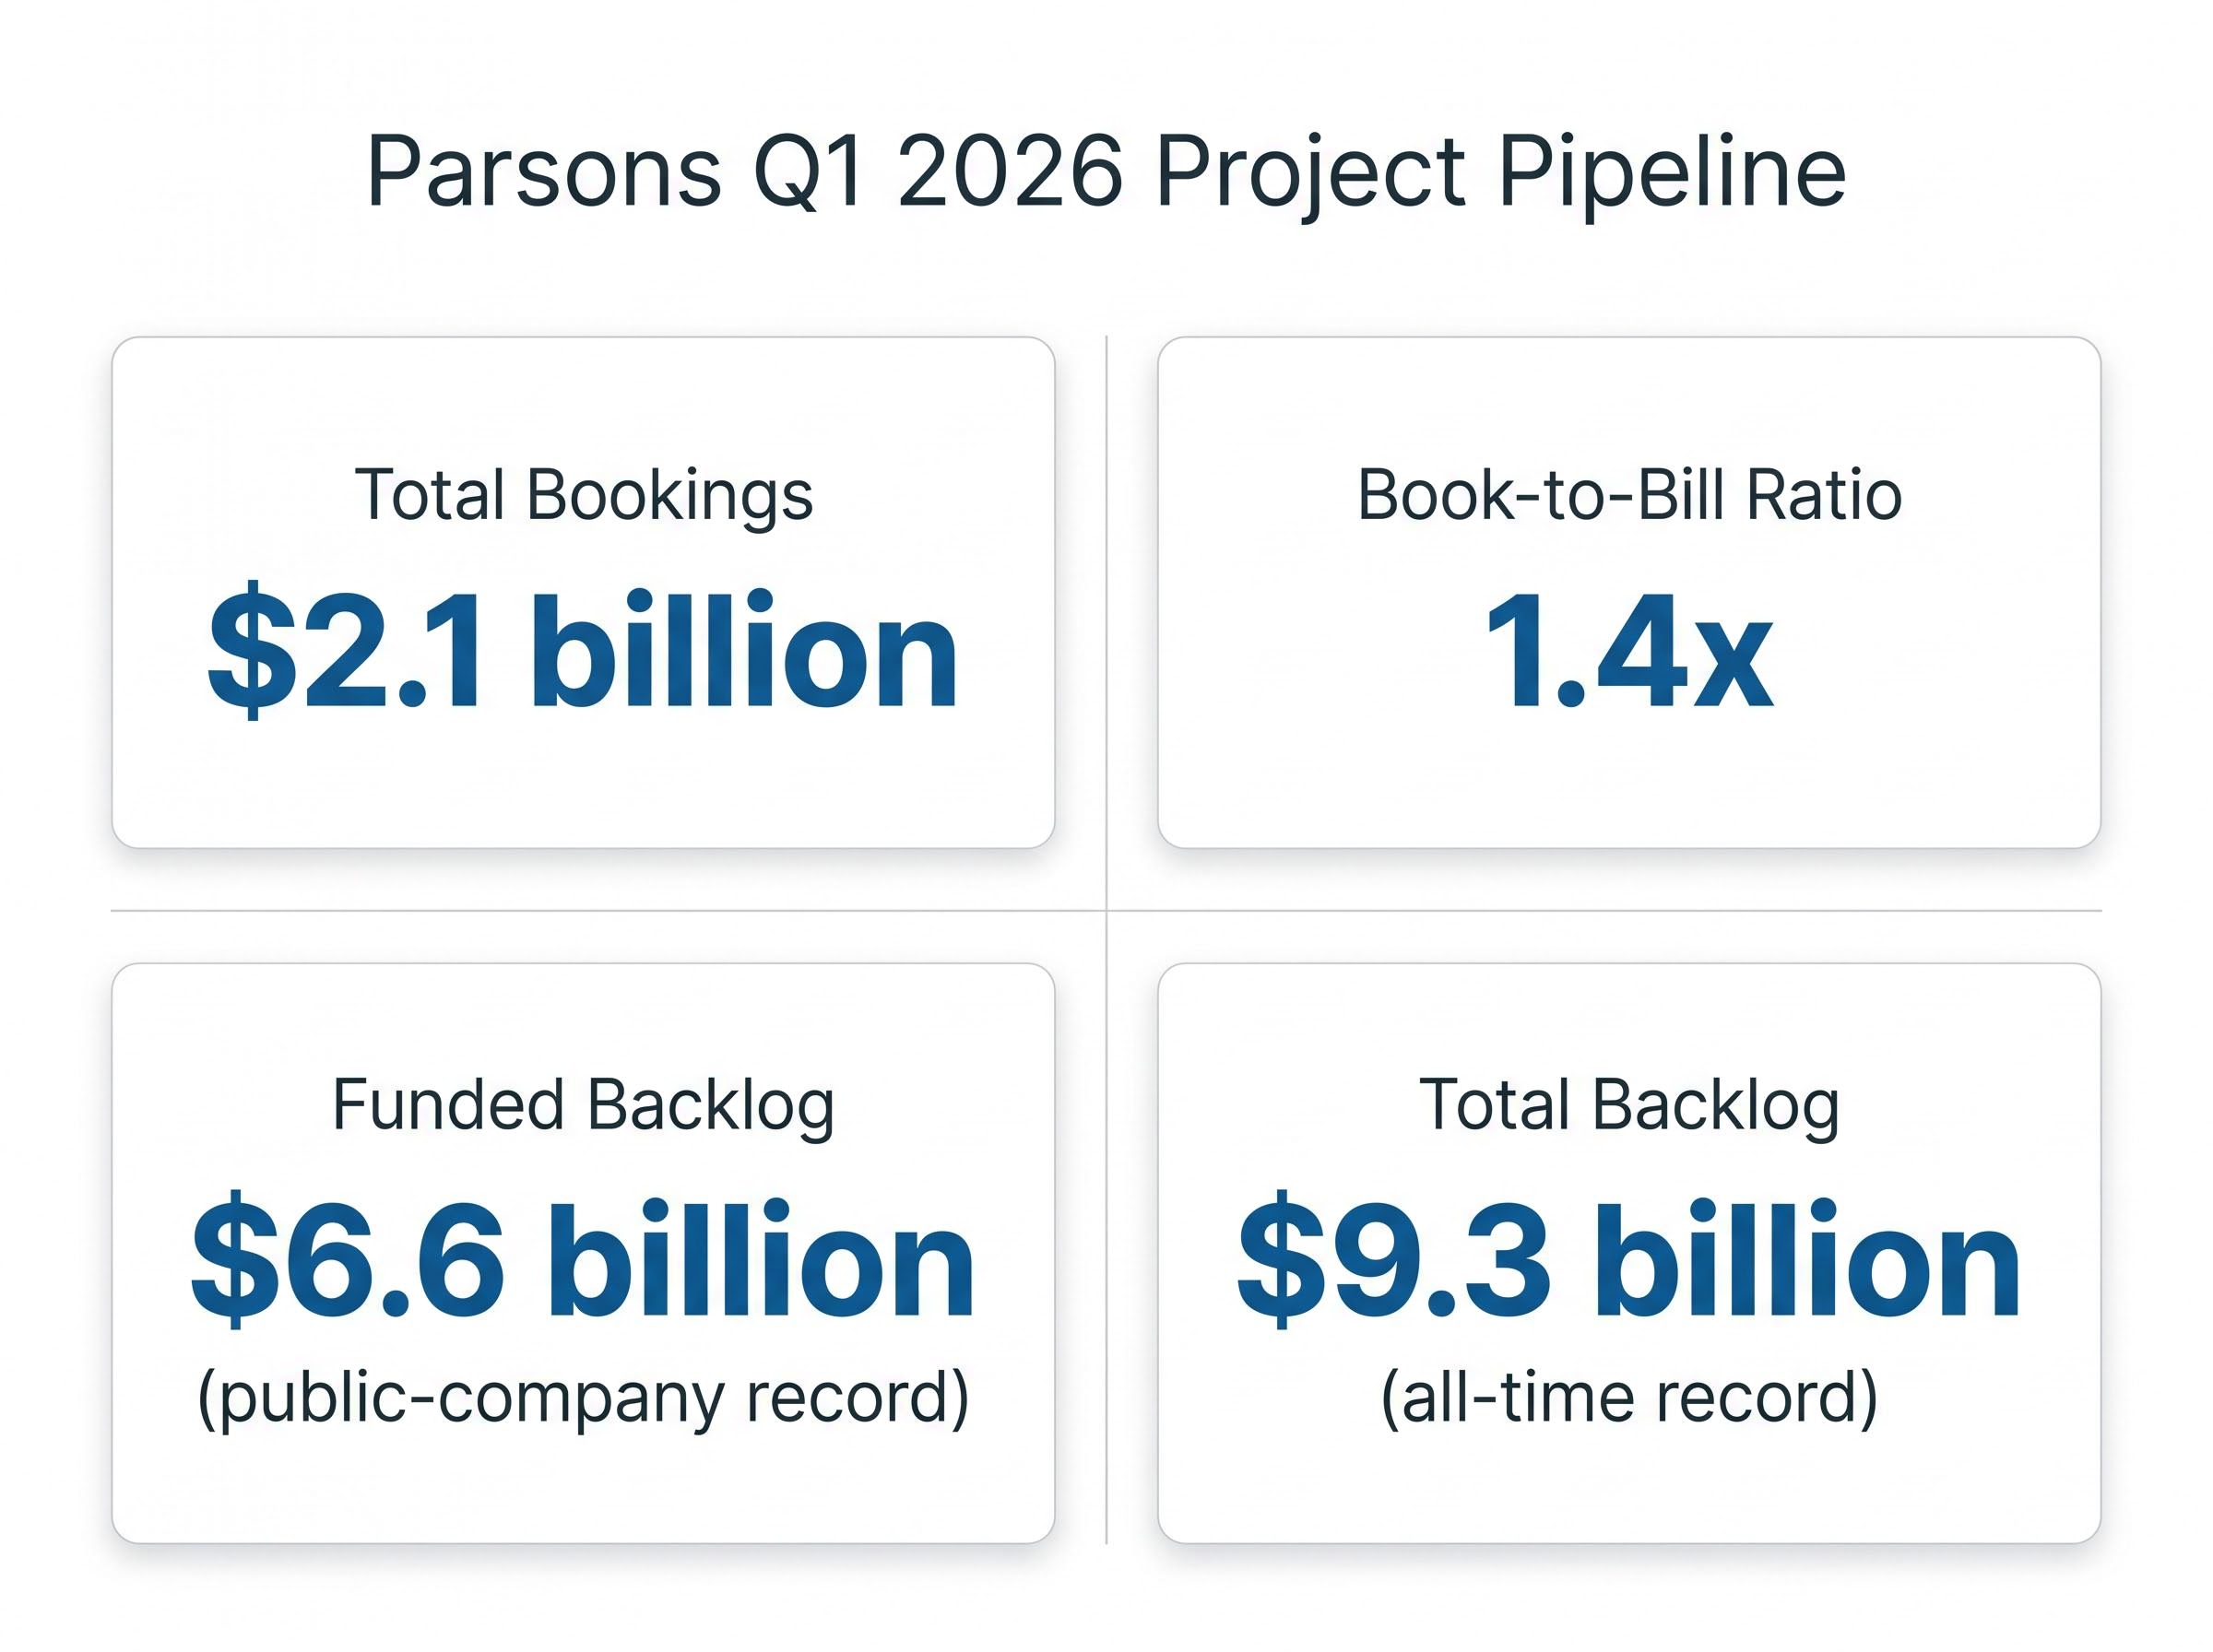
Past financial performance only matters to investors if it indicates future commercial success. The company paired its first-quarter margin execution with massive project pipeline expansion to secure long-term revenue visibility. The firm generated $2.1 billion in total bookings during the quarter, securing four separate single-award wins valued at over $100 million each.
This aggressive booking activity serves as a defensive moat against future quarterly volatility. The scale of the current project pipeline ensures the enterprise has secured years of future work regardless of short-term macroeconomic shifts.
The current project pipeline consists of four key metrics:
The firm continued to complement organic growth with strategic corporate purchases during the quarter. The acquisition of Altamira Technologies Corporation drove higher upfront expenses but secured critical technical capabilities. The purchase was valued at $330 million in upfront cash, with the potential to reach $375 million depending on specific earn-out targets.
This strategic purchase directly expands the company’s footprint in the highly lucrative space and intelligence sectors. While the upfront costs temporarily weighed on unadjusted net income, the addition of these classified capabilities strongly positions the firm for future high-margin contract awards.
For investors looking to build broader exposure to this sector, our dedicated guide to defense contractor portfolio allocation explores how to weigh pipeline visibility, book-to-bill momentum, and operational scale across mid-tier firms.
Management reaffirmed their full-year 2026 sales guidance, signalling confidence in the underlying operational strategy. The midpoint median revenue estimate sits just shy of the Wall Street consensus forecast. The company also confirmed it holds an additional $11 billion in awarded contracts that remain pending booking.
Wall Street analysts maintained a strong consensus following the 29 April 2026 earnings release. The analyst mean price target sits at $74.80, representing an approximate 45 percent upside from pre-earnings trading levels. This overwhelming positive consensus suggests the broader market understands the temporary nature of the single-contract volume drag.
This optimistic outlook helped drive an initial stock surge, reflecting broader market confidence that the current volume lull is strictly temporary.
The first-quarter execution ultimately validates the long-term operational strategy of the business. By maintaining strict margin discipline and expanding the future project backlog, the firm successfully navigated immediate top-line pressure to deliver a highly profitable quarter.
This article is for informational purposes only and should not be considered financial advice. Investors should conduct their own research and consult with financial professionals before making investment decisions. Past performance does not guarantee future results, and financial projections are subject to market conditions and various risk factors.
Parsons' Q1 2026 earnings report highlighted record adjusted EBITDA margins and a substantial increase in backlog, despite a headline revenue contraction primarily driven by a single fixed-price contract. The core business, excluding this contract, demonstrated significant organic growth.
Fixed-price contracts involve the contractor delivering a service for a set amount, assuming cost overrun risk but gaining higher margin potential. Cost-plus contracts pass allowable expenses to the government, offering revenue stability but lower margins for the contractor.
Parsons achieved record 10.1% adjusted EBITDA margins through strict corporate cost control and operational efficiency, successfully optimizing project delivery to insulate the bottom line from the revenue decline.
The revenue contraction in Q1 2026 was entirely concentrated within a single, fixed-price confidential project due to lower volume. Excluding this specific contract, the underlying business actually showed 8% annual revenue growth.
Parsons' record $9.3 billion total backlog and 1.4x book-to-bill ratio signify strong future revenue visibility and a robust project pipeline, providing a defensive moat against short-term market volatility.