Iran Strait Reopening Sends Markets to Record Highs

Key Takeaways
- All three major U.S. indices — the S&P 500, Dow Jones, and Nasdaq — closed at stock market record highs for a third consecutive session on April 17, 2026, with the Russell 2000 leading gains at +2.11%.
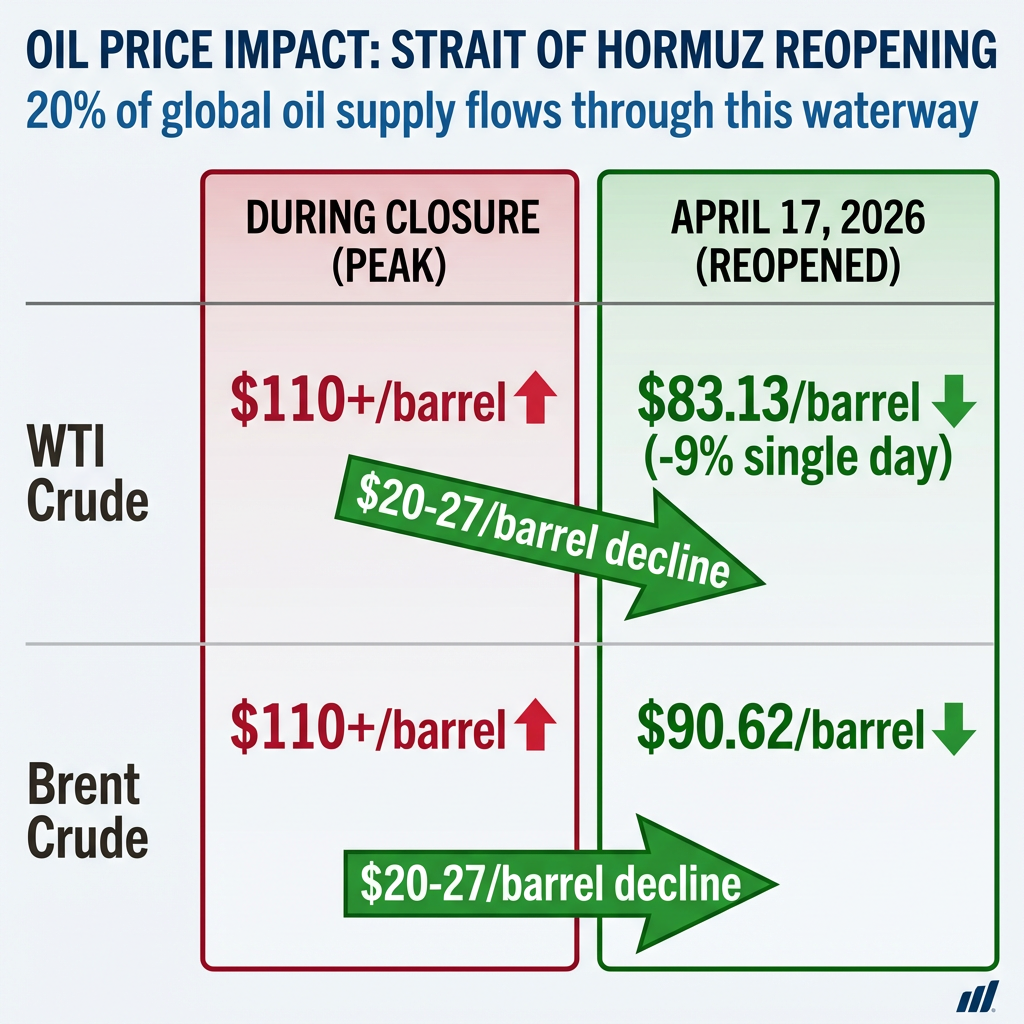
- Iran's reopening of the Strait of Hormuz, through which approximately one-fifth of global oil supply flows, triggered a near 9% single-day collapse in WTI crude to $83.13 per barrel.
- The Nasdaq Composite extended its winning streak to 13 consecutive sessions, the longest run since 1992, with the Magnificent Seven technology stocks gaining 8.6% for the week.
- Bond markets are flashing caution signals, with the 10-year Treasury yield at 4.244% — well above its pre-conflict low of 3.961% — as inflation pressures from sustained energy prices continue to weigh on fixed income.
- The Lebanon-Israel ceasefire underpinning the rally is explicitly temporary at 10 days, making ceasefire developments, oil price stability, and the VIX the critical indicators to watch when trading resumes Monday, April 21.
Markets Close at Record Highs After Iran Reopens Strait of Hormuz
U.S. stock markets closed at stock market record highs on Thursday, April 17, 2026, as investors responded to Iran’s confirmation that the Strait of Hormuz is fully open for commercial vessels during the Lebanon-Israel ceasefire. The S&P 500 closed at 7,126.06 (up 1.20%), the Dow Jones Industrial Average surged 869 points (up 1.8%) to 49,447, and the Nasdaq Composite closed at 24,468.48 (up 1.52%). All three indices achieved record closing levels for the third consecutive session, with the Russell 2000 outperforming at +2.11%.
These record closes mark the completion of a remarkable recovery from the 8% geopolitical shock that initially drove equity markets down when the Iran conflict escalated. Understanding this full market cycle provides important context for evaluating current valuations.
Key index movements for April 17, 2026:
- S&P 500: 7,126.06 (+1.20%)
- Dow Jones Industrial Average: 49,447 (+1.8%, up 869 points)
- Nasdaq Composite: 24,468.48 (+1.52%)
- Russell 2000: 2,776.90 (+2.11%)
Markets are closed Saturday, April 18, with the next trading session scheduled for Monday, April 21. The rally reflects reduced geopolitical risk following the Strait’s reopening, which triggered dramatic shifts across both equity and energy markets.
When big ASX news breaks, our subscribers know first
Why the Strait of Hormuz Matters to Global Markets
The Strait of Hormuz is a narrow maritime chokepoint between the Persian Gulf and the Gulf of Oman through which approximately one-fifth (20%) of global oil supply transits. Any disruption to this critical waterway raises concerns about energy supply constraints, higher prices, and broader economic impacts. The strait’s closure during recent geopolitical tensions elevated oil prices and introduced uncertainty across global markets.
The Strait’s closure during recent geopolitical tensions elevated oil prices and introduced uncertainty across global markets, creating what analysts described as the greatest global energy security challenge in history. This unprecedented supply disruption helps explain the magnitude of the market’s relief rally when Iran reopened the waterway.
The U.S. Energy Information Administration’s analysis of global oil transit chokepoints confirms that approximately one-fifth of global petroleum supply flows through this narrow passage, making it the world’s most strategically important maritime corridor for energy commerce.
The reopening announcement triggered an inverse market reaction: when oil supply risk decreases, energy prices fall while equity markets rise on lower input costs and reduced uncertainty. Lower energy prices potentially support consumer spending and corporate profit margins, particularly for energy-intensive industries.
> Oil Price Collapse on April 17, 2026:
> West Texas Intermediate (WTI) plunged nearly 9% to $83.13/barrel, while Brent crude fell to $90.62/barrel. Both benchmarks had previously traded above $110/barrel during the Strait closure, representing a $20-27/barrel decline from recent highs.
Nasdaq Posts Longest Winning Streak Since 1992
The Nasdaq Composite extended its winning streak to 13 consecutive trading sessions on April 17, the longest such run since 1992. This historic milestone represents more than three decades of market history and reflects exceptional strength in technology stocks.
For detailed analysis of the Nasdaq’s historic 13-day winning streak and what it signals about technology sector momentum, this unprecedented run offers important insights into current market dynamics.
The Magnificent Seven stocks gained 8.6% for the week, demonstrating the technology sector’s leadership in the current rally. According to Scott Chronert, analyst at Citigroup, market conditions represent a “reverse perfect storm” benefiting software and hyperscale technology companies. Lower oil prices reduce corporate operating costs, geopolitical de-escalation reduces uncertainty, and risk appetite has returned to growth-oriented stocks.
The technology rally connects to broader market dynamics: reduced energy input costs support higher profit margins for cloud infrastructure and data centre operators, while the resolution of supply chain risks improves sentiment for hardware manufacturers and semiconductor firms.
Bond Markets Signal Caution Despite Equity Euphoria
While equity markets celebrated the geopolitical de-escalation, bond markets have not mirrored the stock rally. Fixed income instruments remain below pre-conflict levels, with Treasury yields, corporate bonds, and municipal bonds all reflecting ongoing inflation concerns despite the single-day oil price collapse.
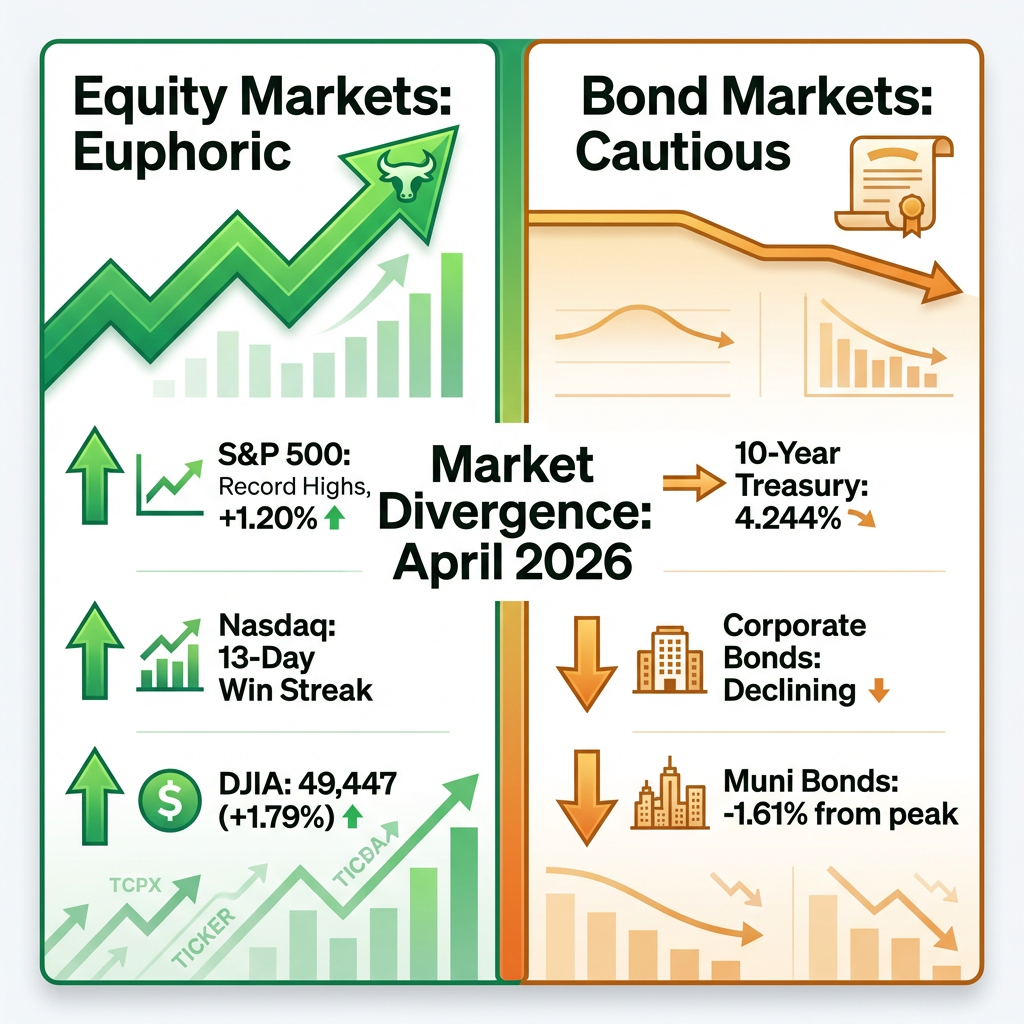
Bond market indicators as of available data:
- 10-year Treasury yield: 4.244% (compared to 3.961% low on February 27 before hostilities)
- Municipal bond ETF: Down 1.61% from February 27 peak
- Corporate bond ETF: Declined from above $23 to approximately $22.55
Bond traders remain skeptical about Federal Reserve rate cuts given persistent inflation pressures. Despite the dramatic oil price decline on April 17, Brent crude remains more than 50% above December 2025 levels. Elevated energy prices over recent months have contributed to higher producer costs and consumer price pressures, which bond markets continue to price into longer-term yields.
Understanding energy price volatility’s impact on inflation dynamics helps explain why bond markets remain cautious despite the dramatic single-day oil price decline. This relationship between energy costs and broader price pressures continues to influence Federal Reserve policy expectations.
The next major ASX story will hit our subscribers first
Ceasefire Fragility Leaves Uncertainty Ahead
President Trump announced the 10-day Lebanon-Israel ceasefire on April 16, 2026, when the Strait of Hormuz remained closed and Brent crude traded near $100/barrel. Iranian Foreign Minister Seyed Abbas Araghchi confirmed the Strait’s reopening for commercial shipping on April 17, catalysing the market rally.
The ceasefire is explicitly temporary and characterised as fragile by market analysts. No consensus exists on whether the equity rally can be sustained given ongoing regional tensions and the limited duration of the agreement. The VIX volatility index fell 2.56% to 17.48 on April 17, but remains a key indicator to monitor for shifts in market sentiment.
When markets reopen Monday, April 21, investors should watch ceasefire developments, oil price stability at current levels, and whether the Nasdaq can extend its historic 13-day winning streak. The temporary nature of the ceasefire means geopolitical risks could re-emerge quickly if diplomatic efforts falter.
Key Market Data at a Glance
Closing data for major asset classes as of April 17, 2026:
| Asset | Close | Change |
|---|---|---|
| DJIA | 49,447.43 | +1.79% |
| S&P 500 | 7,126.06 | +1.20% |
| Nasdaq | 24,468.48 | +1.52% |
| Russell 2000 | 2,776.90 | +2.11% |
| VIX | 17.48 | -2.56% |
| WTI Crude | $83.13 | -9.63% |
| Gold Futures | $4,849.40 | +0.85% |
| Bitcoin | $77,503.78 | -0.01% |
| Dollar Index | 95.17 | -0.08% |
| S&P GSCI | 679.10 | -4.45% |
The simultaneous record closes across major equity indices, combined with the dramatic energy market reversal, represent significant market-moving events with broad implications for investors. The 13-day Nasdaq winning streak, stock market record highs across all three major indices, and 9% single-day oil price collapse underscore the magnitude of the geopolitical de-escalation’s market impact. However, the temporary nature of the ceasefire and divergence between equity optimism and bond market caution suggest investors should monitor developments closely when trading resumes Monday, April 21.
This article is for informational purposes only and should not be considered financial advice. Investors should conduct their own research and consult with financial professionals before making investment decisions.
Frequently Asked Questions
What caused stock markets to hit record highs on April 17 2026?
U.S. stock markets reached record highs on April 17, 2026, after Iran confirmed the Strait of Hormuz was fully reopened for commercial shipping during the Lebanon-Israel ceasefire, dramatically reducing geopolitical risk and sending all three major indices to their third consecutive record close.
What is the Strait of Hormuz and why does it affect stock markets?
The Strait of Hormuz is a critical maritime chokepoint through which approximately one-fifth of global oil supply passes; when it is closed or threatened, oil prices spike and equity markets fall, while its reopening reduces energy costs and uncertainty, boosting stock valuations.
How much did oil prices fall when the Strait of Hormuz reopened?
West Texas Intermediate crude plunged nearly 9% to $83.13 per barrel and Brent crude fell to $90.62 per barrel on April 17, 2026, after both benchmarks had previously traded above $110 per barrel during the Strait closure.
What is the Nasdaq's current winning streak and why is it historically significant?
The Nasdaq Composite extended its winning streak to 13 consecutive trading sessions on April 17, 2026, the longest such run since 1992 and a milestone representing over three decades of market history, driven largely by gains in technology stocks including the Magnificent Seven which rose 8.6% for the week.
Should investors be cautious despite the stock market record highs in April 2026?
Yes — bond markets remain below pre-conflict levels with the 10-year Treasury yield elevated at 4.244%, reflecting persistent inflation concerns, while the Lebanon-Israel ceasefire is explicitly temporary and only 10 days long, meaning geopolitical risks could quickly re-emerge if diplomatic efforts falter.


