S&P 500 Rebound: How Markets Dismissed an 8% Geopolitical Shock

Key Takeaways
- The S&P 500 closed at 6,967.38 on April 14, 2026, just 0.2% below its all-time record high after recovering from an 8% drawdown caused by the U.S.-Israel military operation against Iran.
- Oil prices declining 7% to $92 per barrel confirmed the supply shock was temporary, with equities and crude bottoming simultaneously on March 30 as markets priced in conflict resolution.
- The Federal Reserve's 75 basis points of rate cuts in 2025 and an anticipated additional 50 basis points in 2026, combined with fiscal stimulus from the One Big Beautiful Bill Act, provide key policy tailwinds supporting the rally.
- Q1 2026 earnings growth is projected at 13%, extending five consecutive quarters of double-digit expansion, though gains remain concentrated in Magnificent 7 technology stocks rather than broad-based across the index.
- Elevated volatility of 19-20% year-to-date, stretched valuations near 7,000, and concentration risk in AI-driven mega-caps represent material downside risks that could quickly reverse recent gains.
The S&P 500 closed at 6,967.38 on Tuesday, April 14, 2026, positioning just 0.2% below its record high of 6,978.60 reached on January 27, 2026. This near-record close marks a dramatic turnaround from the 8% drawdown experienced between February 27 and March 30, triggered by the U.S.-Israel military operation against Iran beginning February 28. Markets have effectively dismissed the geopolitical supply shock as temporary, with the S&P 500 rebound demonstrating resilience and forward-looking confidence.
The selloff created concentrated damage across individual constituents despite the index-level recovery:
> 86 S&P 500 stocks fell 15% or more during the drawdown, highlighting how volatility impacted specific equities even as broader indices staged their comeback.
Year-to-date returns remain near 0% despite the recovery, with elevated volatility of 19-20% creating a high-fluctuation environment reminiscent of historically challenging years like 2011 and 1987, where directional swings produced flat net performance. This volatility backdrop underscores the market’s uncertain footing even as prices approach record territory.
Understanding the Oil-Equity Connection That Drove the Selloff and Recovery
Oil price spikes historically threaten equity markets because they raise input costs for businesses, squeeze consumer spending power, and can trigger recessions when sustained. The Iran conflict and Strait of Hormuz closure initially sparked fears of a prolonged energy shock that would undermine corporate profitability and economic growth. Crude oil prices surged as markets priced in potential supply disruptions from one of the world’s critical energy transit chokepoints.
The International Energy Agency described the February 28 conflict as the greatest global energy security challenge in history, yet markets have proven remarkably resilient in dismissing what initially appeared to be a sustained supply disruption.
NBER research on oil price shocks and equity markets demonstrates that supply-driven geopolitical disruptions typically produce shorter-lived market impacts compared to demand-driven price increases, providing academic support for why investors correctly anticipated a temporary rather than recessionary energy shock.
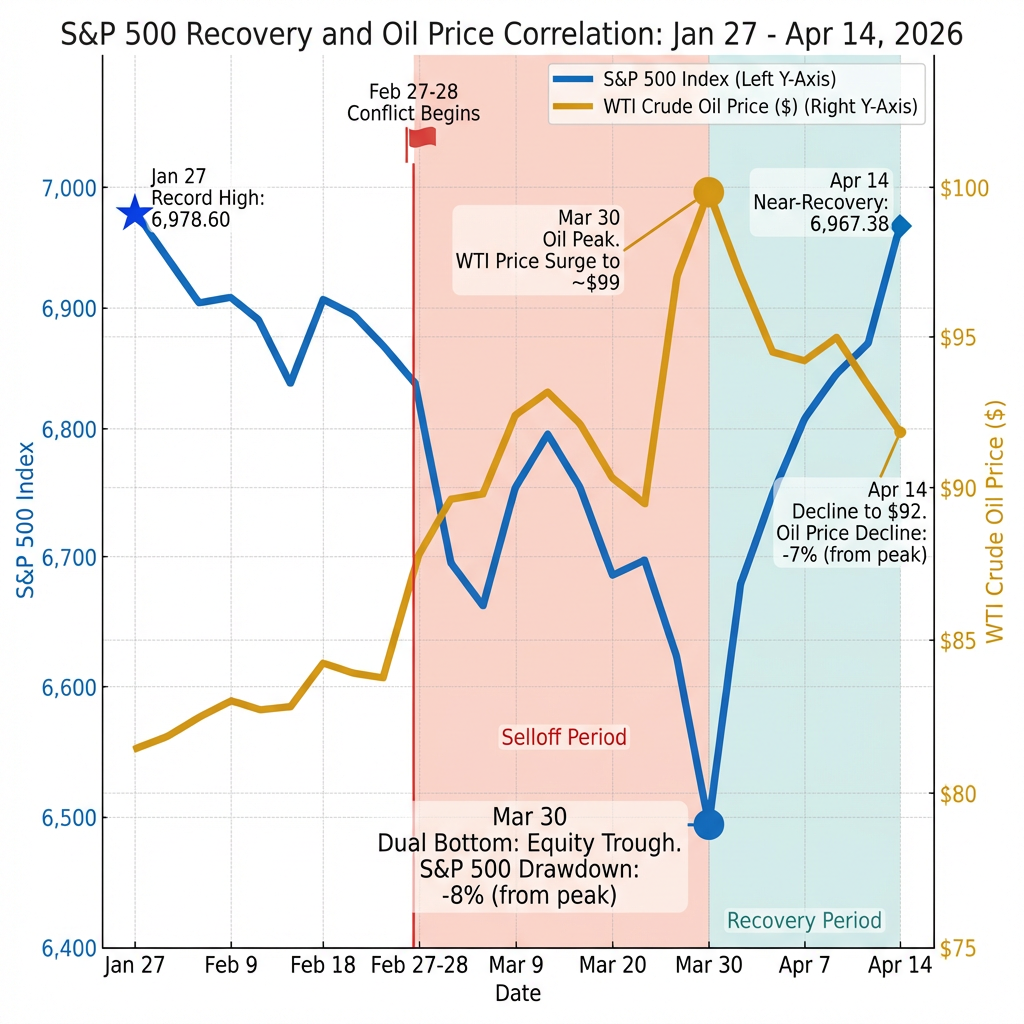
Nicholas Colas of DataTrek Research observed that equities bottomed on March 30, precisely when oil prices peaked, signaling that markets viewed the disruption as temporary rather than recessionary. West Texas Intermediate crude subsequently declined 7% to $92 per barrel, validating this positioning. The simultaneous turning points in oil and equities demonstrate that investors were forward-looking, anticipating resolution before it materialised rather than extrapolating worst-case supply scenarios.
Why didn’t the Strait of Hormuz closure cause lasting market damage? Markets are forward-looking mechanisms that price in expected outcomes rather than current conditions. When oil prices began falling from their peaks in early April, it confirmed the supply shock would be short-lived. Investors interpreted the retreat as evidence that either conflict resolution was progressing or alternative supply routes were compensating for the disruption, removing the recessionary oil price threat that had driven the March selloff.
When big ASX news breaks, our subscribers know first
Policy Tailwinds Supporting the S&P 500 Rebound
The Federal Reserve’s accommodative policy stance provides a key pillar of the recovery. The central bank implemented 75 basis points of rate cuts during 2025, and markets expect an additional 50 basis points of cuts in 2026. This dovish monetary positioning lowers borrowing costs for corporations and consumers while signalling Fed confidence that inflation pressures have moderated sufficiently to prioritise growth support.
Federal Reserve support mechanisms underpinning the rally include:
- Rate cuts totaling 75 basis points in 2025 with 50 basis points more anticipated in 2026, reducing financing costs across the economy
- Stealth quantitative easing through Treasury reinvestment programmes, maintaining liquidity in fixed income markets
- GSE mortgage purchase programmes supporting housing market stability and broader credit availability
Fiscal stimulus from the One Big Beautiful Bill Act complements monetary support, providing direct economic stimulus. Morgan Stanley’s analysis emphasises that markets are prioritising these domestic policy boosts over geopolitical tensions, with strategists viewing the combination of Fed accommodation and fiscal expansion as sufficient to sustain equity valuations. Analysts project 7,500 as a bullish target, driven partly by these policy tailwinds alongside AI-related growth narratives and corporate earnings strength.
Earnings Strength Provides Fundamental Support
Corporate earnings remain a pillar of the bull case, providing fundamental justification independent of policy tailwinds. Q1 2026 earnings are projected at 13% growth, continuing five consecutive quarters of double-digit expansion. This sustained earnings momentum demonstrates that companies are navigating the geopolitical uncertainty and maintaining pricing power, operational efficiency, and revenue growth across diverse market conditions.
FactSet’s earnings analysis methodology provides the industry-standard framework for aggregating analyst estimates across S&P 500 constituents, establishing the data foundation for tracking the sustained double-digit earnings growth that has supported equity valuations through geopolitical volatility.
Morgan Stanley projects 14-16% earnings per share growth going forward but includes warnings about significant downside risks if consensus expectations falter. The investment bank notes that earnings strength is not evenly distributed across the market, with the Magnificent 7 technology stocks driving disproportionate gains. If these market leaders disappoint or if earnings deteriorate beyond the mega-cap cohort, the index-level recovery could face pressure.
> AI-driven growth narratives and Magnificent 7 dominance mean earnings strength is concentrated rather than broad-based, creating vulnerability if investor expectations for these market leaders are not met.
Market Breadth and Sector Dynamics Behind the Recovery
March weakness disproportionately hit large-cap growth stocks, with the Nasdaq Composite declining 4.68% during the selloff period. However, small-cap stocks and the equal-weight S&P 500 demonstrated relative resilience through March, suggesting some broadening of market participation beyond the mega-cap technology leaders that have dominated recent performance. This divergence indicates that value and smaller capitalisation segments held up better during the geopolitical volatility.
The equal-weight S&P 500 demonstrated relative resilience through March, suggesting broadening market participation that challenges the concentration risk narrative and may signal a rotation toward broader-based leadership beyond mega-cap technology stocks.
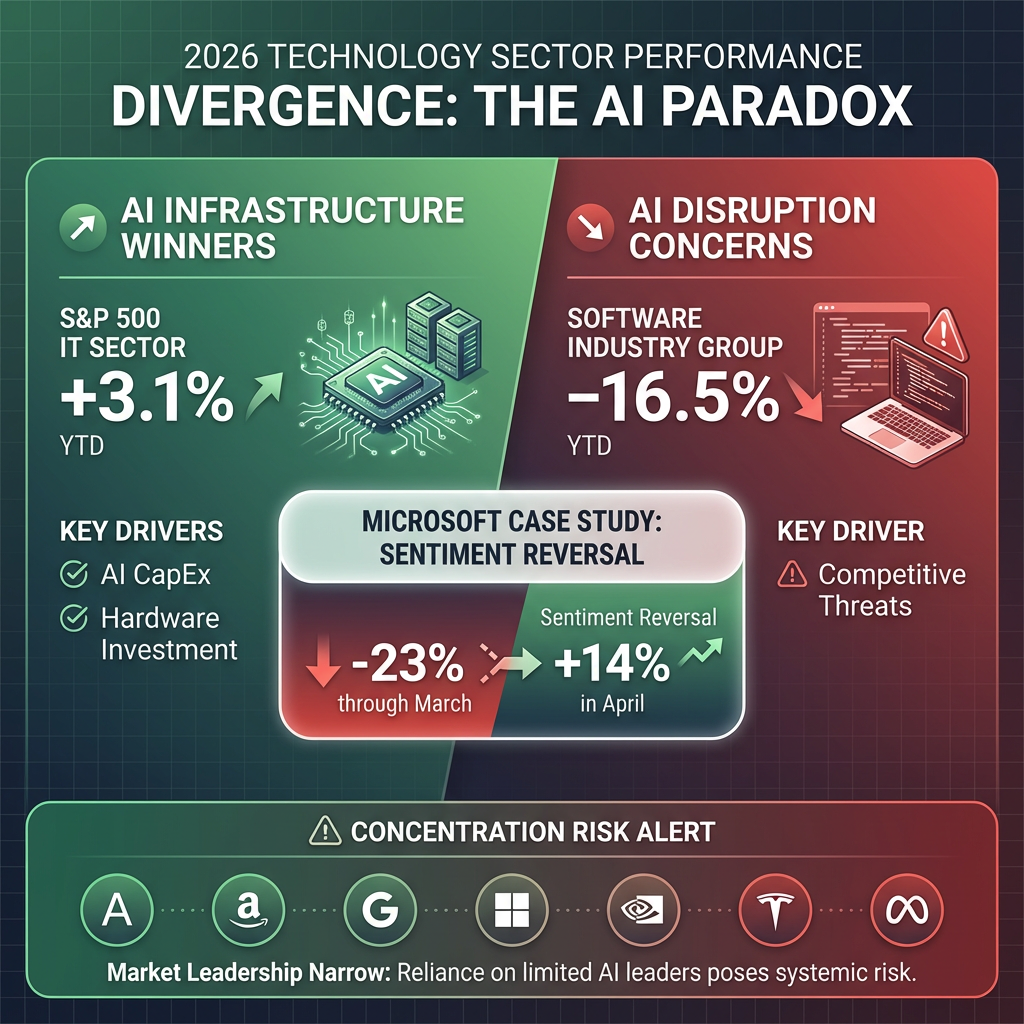
| Sector/Group | YTD Performance | Key Driver |
|---|---|---|
| S&P 500 IT Sector | +3.1% | AI capital expenditures and infrastructure investment |
| Software Industry Group | -16.5% | AI disruption fears and competitive threats |
| Microsoft | -23% through March, +14% in April | Initial AI cannibalization concerns followed by sentiment reversal |
The software sector’s dramatic underperformance at -16.5% year-to-date contrasts sharply with the broader IT sector’s +3.1% gain, providing evidence that artificial intelligence is simultaneously powering gains for infrastructure and hardware providers whilst creating existential fears for legacy software companies. Microsoft’s April reversal, gaining 14% after falling 23% through March, potentially signals an inflection point where investors are reassessing whether AI disruption risks were overstated for established technology leaders with resources to adapt.
The next major ASX story will hit our subscribers first
Risks That Could Derail the S&P 500 Rally
Year-to-date volatility of 19-20% creates an environment where gains can reverse quickly, even as the index approaches record highs. This elevated volatility compares to historically challenging years like 2011 and 1987, where high fluctuations produced flat net returns despite periodic sharp movements. The current volatility regime suggests market participants remain uncertain about the sustainability of the recovery, with positioning vulnerable to renewed shocks.
Key risks that could derail the rally include:
- Renewed oil price spike if Iran conflict escalates, DataTrek Research notes the rally remains sustainable unless oil reaches new 2026 highs
- Stretched valuations per Morgan Stanley’s warning that current optimism may not be supported by fundamentals if earnings disappoint
- Concentration risk in Magnificent 7 technology stocks, where market gains depend heavily on a narrow group of companies
- Elite market-timing indicators suggesting correction overdue, per analysis from Mark Hulbert highlighting technical signals of vulnerability
Société Générale’s analysis of stretched valuations at the 7,000 level provides additional institutional perspective on why current prices may represent resistance rather than a launching point for further gains, particularly given the concentration in technology leadership that has driven the index near record territory.
Morgan Stanley highlights significant downside risks if consensus earnings expectations falter, particularly for stocks outside the Magnificent 7 that have driven most recent gains. The investment bank’s 14-16% EPS growth projection carries material uncertainty, with potential for disappointment if economic conditions weaken or if AI-related capital expenditures fail to translate into anticipated productivity gains and profit growth.
Morgan Stanley’s earnings growth projection carries material uncertainty, particularly if AI-related capital expenditures fail to translate into anticipated productivity gains and profit growth, a scenario explored in depth by institutional investors questioning the sustainability of current AI valuations.
What the S&P 500 Rebound Means for Investors
The S&P 500’s near-complete recovery from the Iran conflict selloff reflects market confidence in policy support, earnings resilience, and temporary supply disruptions. DataTrek Research’s view that escape velocity has been achieved unless oil reaches new highs underpins the bullish 7,500 target, supported by Federal Reserve accommodation, fiscal stimulus from the One Big Beautiful Bill Act, and sustained double-digit earnings growth extending across five consecutive quarters.
Elevated volatility of 19-20%, concentration risk in AI and Magnificent 7 stocks, and stretched valuations warrant caution despite the directional recovery. Morgan Stanley’s warnings about potential earnings disappointments beyond mega-caps, combined with the narrow breadth of market leadership, create vulnerabilities that could quickly reverse recent gains. Northeastern analysts anticipate renewed optimism if the U.S. successfully expedites conflict resolution, potentially removing remaining geopolitical risk premiums from equity valuations.
This article is for informational purposes only and should not be considered financial advice. Investors should conduct their own research and consult with financial professionals before making investment decisions.
Frequently Asked Questions
What caused the S&P 500 rebound after the February 2026 selloff?
The S&P 500 rebound was driven by declining oil prices from their March peaks, Federal Reserve rate cuts totalling 75 basis points in 2025, fiscal stimulus from the One Big Beautiful Bill Act, and sustained double-digit corporate earnings growth across five consecutive quarters.
How close is the S&P 500 to its all-time high as of April 2026?
As of April 14, 2026, the S&P 500 closed at 6,967.38, just 0.2% below its record high of 6,978.60 set on January 27, 2026, representing a near-complete recovery from the 8% drawdown experienced between February 27 and March 30.
What are the biggest risks that could derail the S&P 500 rally?
Key risks include a renewed oil price spike if the Iran conflict escalates, stretched valuations near the 7,000 level, concentration risk in Magnificent 7 technology stocks, and the possibility that consensus earnings expectations of 14-16% EPS growth fail to materialise.
What is the bullish price target for the S&P 500 in 2026?
Analysts project a bullish target of 7,500 for the S&P 500, supported by Federal Reserve accommodation, fiscal stimulus, and continued double-digit earnings growth, though this target carries material uncertainty if economic conditions weaken.
Why did oil prices falling help the S&P 500 recover?
West Texas Intermediate crude declining 7% to $92 per barrel confirmed the energy supply shock from the Iran conflict was temporary rather than recessionary, removing the primary catalyst for the March selloff and allowing equity markets to recover their losses.


