Netflix is cutting roughly 1,000 jobs, and that may be the easy part of its week. The harder question in tonight’s Netflix earnings report is whether people are spending less time watching it. The streamer reports after the close on 20 October 2026, and the number that matters most may not be earnings per share at all.
United Airlines reports the same evening, with Brent crude above $110 a barrel on fears about the Strait of Hormuz. That puts fuel costs and airfares at the centre of its quarter.
Before the opening bell, GE Aerospace, RTX and General Motors release their own results. Taken together, the five reports show how markets weigh guidance and commentary more heavily than headline figures.
This gives you a short list of signals to watch tonight, and a method you can reuse every earnings season.
What are investors really testing in Netflix’s report tonight?
On paper, the bar looks low. Consensus estimates referenced by LSEG point to about $12.88B in revenue, $0.82 in earnings per share (EPS, the profit attributed to each share) and an operating margin near 33.2%. Operating margin is the share of revenue left after the costs of running the business.
Those figures sit only slightly above last quarter’s results.
| Metric | Q3 2026 consensus (tonight) | Q2 2026 actual |
|---|---|---|
| Revenue | $12.88B | $12.56B (up 13.4%) |
| EPS | $0.82 | $0.80 (vs $0.79 consensus) |
| Operating margin | ~33.2% | 33.4% (vs 34.1% a year earlier) |
Netflix also narrowed its full-year revenue guidance to $51.0-51.4B and kept its 31.5% margin target. Meeting tonight’s numbers would therefore confirm the plan rather than surprise anyone.
The real exam is engagement. Reuters has reported that YouTube and TikTok capture viewing time cheaply with free, user-made video, and Ross Benes, senior analyst at eMarketer, has argued that Netflix may be nearing a ceiling in its subscription-dependent business. The bear case concerns Netflix’s share of total video time, not just its subscriber count.
Cost discipline or warning sign?
The layoffs, announced in an internal memo on 14 October, cut about 6% of roughly 16,000 staff. It is the largest round since 2022, concentrated in product, technology, legal and human resources.
- Reallocation reading: Cutting support functions while still investing in what Netflix calls “high impact areas” looks like resource discipline, not retreat.
- Defensive reading: A cut of this size after a major failed bid, with engagement easing, may suggest management is protecting margins because growth spending is earning less.
The failed bid for Warner Bros. Discovery’s streaming and studio assets, which the Los Angeles Times reported went to Paramount Skydance, splits the same way. Bulls see a dodged purchase price and debt load; bears see a company left without the scale and franchises its rivals now hold.
If you hold or follow Netflix, the layoffs and the bid matter less than whether engagement and the 2027 outlook hold up. That is what resets the stock’s base.
When big ASX news breaks, our subscribers know first
How do fuel costs and fares decide United’s quarter?
Netflix’s test is about attention. United’s is about a commodity, and the mechanism is easier to see if you follow it one link at a time.
- Jet fuel is one of an airline’s largest operating costs.
- When fuel rises, cost per available seat mile (the cost of flying one seat one mile) goes up, and margins shrink if revenue stays flat.
- Airlines push back through higher fares, baggage and seat fees, premium pricing and fewer discounts.
- Whether that works depends on demand elasticity, meaning how sharply passengers cut back when prices rise.
- Airlines can also trim capacity or retire thirsty aircraft, which supports fares but risks losing market share.
Hedging softens the blow without removing it. A fuel hedge is a contract that locks in part of future fuel costs, but it typically covers only some consumption and does not fully protect against sudden spikes in the spot price, the price for immediate delivery.
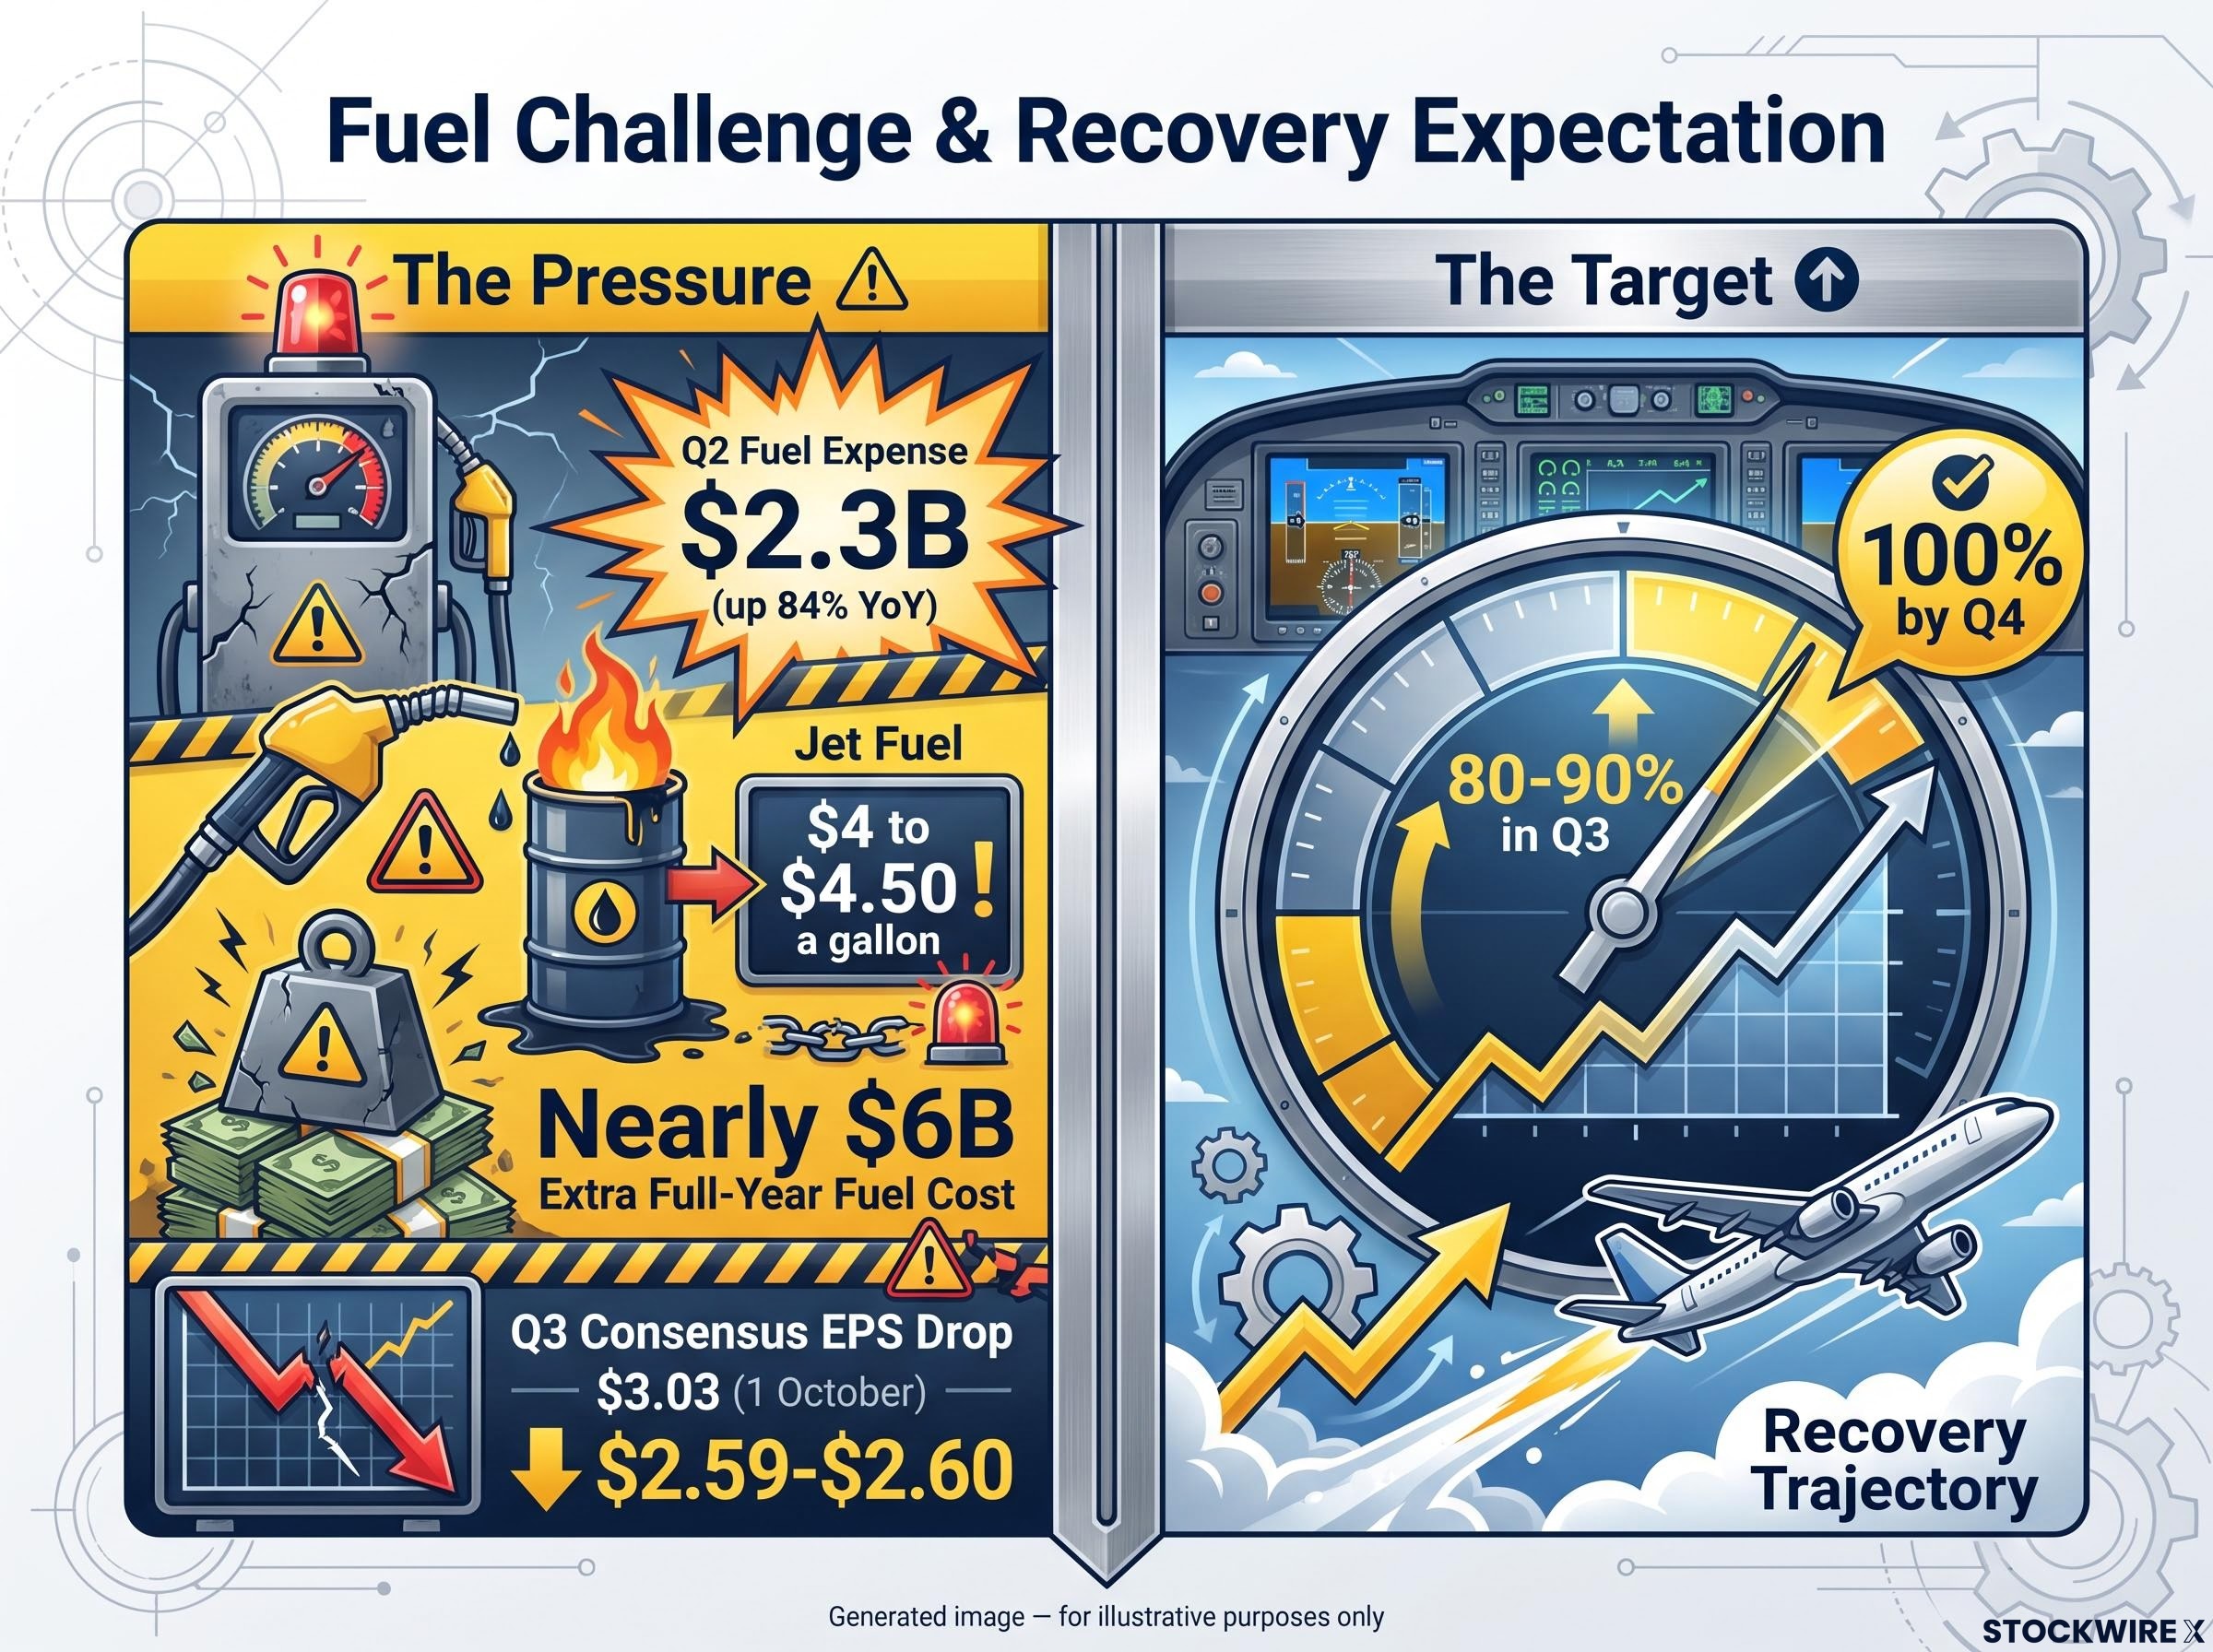
United’s numbers show the pressure. Q2 fuel expense hit $2.3B, up 84% year on year, and the airline expected nearly $6B of extra full-year fuel cost versus its initial estimate. Consensus EPS has fallen to about $2.59-$2.60 (range $2.29-$3.01) on revenue near $17.84-$17.90B, down from $3.03 in an 1 October preview.
United’s management expected to recover 80-90% of the fuel-price increase in Q3 and 100% by Q4, assuming demand and pricing hold.
With jet fuel cited between roughly $4 and $4.50 a gallon, CEO Scott Kirby said in August that fares should keep climbing gradually through the first half of 2027, though by less than this year’s jump. He also said demand had shown no dip.
Pricing power is what separates carriers that can pass fuel through to fares from those that cannot, and premium cabin and corporate demand are the usual sources of it.
- Bull case: Strong demand and tight industry capacity give United pricing power.
- Bear case: Fuel may outrun fares, especially with price-sensitive leisure travellers, and capacity added to defend share could undercut price rises.
If you are watching United, the recovery percentage tells you whether fares are outrunning fuel. A miss there matters more than the EPS line, because the estimate cuts already reflect fuel, not weak demand.
Why does one oil shock hit five companies differently?
United feels the oil price tonight. The other three reporters feel it later, and in different ways.
The backdrop is the Strait of Hormuz, largely closed since a joint US-Israeli assault on Iran began in late February. Recent attacks on ships have slowed flows again, and Brent futures moved above $110 on 19-20 October after settling at $109.86 on 16 October. Sources conflict on US crude; Investing.com put West Texas Intermediate (WTI) near $99.53 on 19-20 October.
According to CNBC, citing Kpler, weekly flows through the strait ran at about 9.4M barrels per day, roughly 70% of the prewar average. The duration of that shortfall matters more than any single day’s price.
The oil risk premium tied to the strait is likely to decompress slowly even if diplomacy improves, because insurers and shippers take months to normalise operations.
| Sector | Direct risk | Offsets |
|---|---|---|
| Airlines | Higher jet fuel, insurance and routing costs; weaker margins | Strong demand, fare rises, fees, capacity discipline, partial hedging |
| GM and automakers | Pricier petrol and diesel can dent demand for large vehicles and lift logistics costs | Indirect effects; mix, incentives and hybrid or EV demand can offset |
| GE Aerospace | Stressed airlines may fly less, defer purchases or retire aircraft | Faster replacement of older jets; maintenance and defence diversify exposure |
| RTX | Commercial aerospace exposure through utilisation and aftermarket | Defence demand and a large backlog insulate it |
Where the three morning reporters fit
All three release results before the open this morning, so check for actual figures as they land.
- GE Aerospace: call at 7:30 a.m. ET; consensus EPS about $2.01-$2.02, revenue about $12.88B.
- RTX: call at 8:30 a.m. ET; consensus EPS about $1.78, revenue about $24.11B.
- GM: release around 6:30 a.m., call at 8:30 a.m. ET; consensus EPS about $3.52.
GE and RTX connect to the oil shock through airline fleet decisions, while GM connects through fuel-sensitive car buyers. RTX’s defence work is largely unrelated to oil.
If your portfolio mixes airlines, aerospace and autos, watch how long the disruption lasts. Each holding feels it on a different timetable.
What should you look for when any earnings report lands?
Here is the uncomfortable truth about earnings night: a company can beat on EPS and still fall. Investor-education guidance from Chase and Schwab notes that markets often react more to forward guidance and management commentary than to the headline number.
Your approach to reading earnings reports matters most when a beat and a falling share price arrive together, because the gap between results and prior expectations, not the result alone, sets the stock’s direction.
| Metric | Why it matters | Application tonight |
|---|---|---|
| Guidance | Resets the earnings base; a beat can still fall on a weak outlook | Netflix 2027 outlook; United fuel recovery |
| Revenue quality | Separates volume, price and mix | Netflix subscriptions vs advertising; United fares and load factor |
| Operating margins | Shows pricing power against cost pressure | United fuel; Netflix cost cuts; GE and RTX service margins |
| Operating KPIs | Revenue can hide weak usage | Netflix engagement and viewing time |
| Cash flow | Cross-checks accounting earnings | GE and RTX free cash flow; United cash generation |
| One-offs | Asset gains or tax benefits can inflate EPS | Check any unusual items in Netflix’s results |
| Management commentary | Reveals demand, pricing and cost assumptions | United fares; aerospace views on airline fleets |
A KPI, or key performance indicator, is an operating measure such as viewing hours or passengers carried. Free cash flow is the cash left after running the business and investing in it, which is harder to dress up than accounting profit.
On this slate, four items carry the most weight:
- Netflix’s engagement and 2027 outlook.
- United’s fuel pass-through, capacity and fare assumptions.
- GE and RTX commentary on commercial aerospace and backlog.
- GM’s sensitivity to fuel, incentives, vehicle mix and consumer demand.
Judge the outlook and the quality of earnings first, and you are far less likely to react to a headline that reverses by morning.
Reading tonight’s results without chasing the headline
Netflix’s quarter turns on engagement and its 2027 outlook. United’s turns on whether fares recover 80-90% of higher fuel costs. Everything else on the slate shows how one oil shock travels at different speeds.
Expect the first after-hours move to be provisional. It can reverse once the conference call adds context.
The decision point is narrow: for Netflix, engagement trends and forward guidance; for United, fuel recovery and fare outlook. Those two figures for each company will confirm or break the thesis more than the EPS headline.
This article is for informational purposes only and should not be considered financial advice. Investors should conduct their own research and consult with financial professionals before making investment decisions. Past performance does not guarantee future results. Financial projections are subject to market conditions and various risk factors.