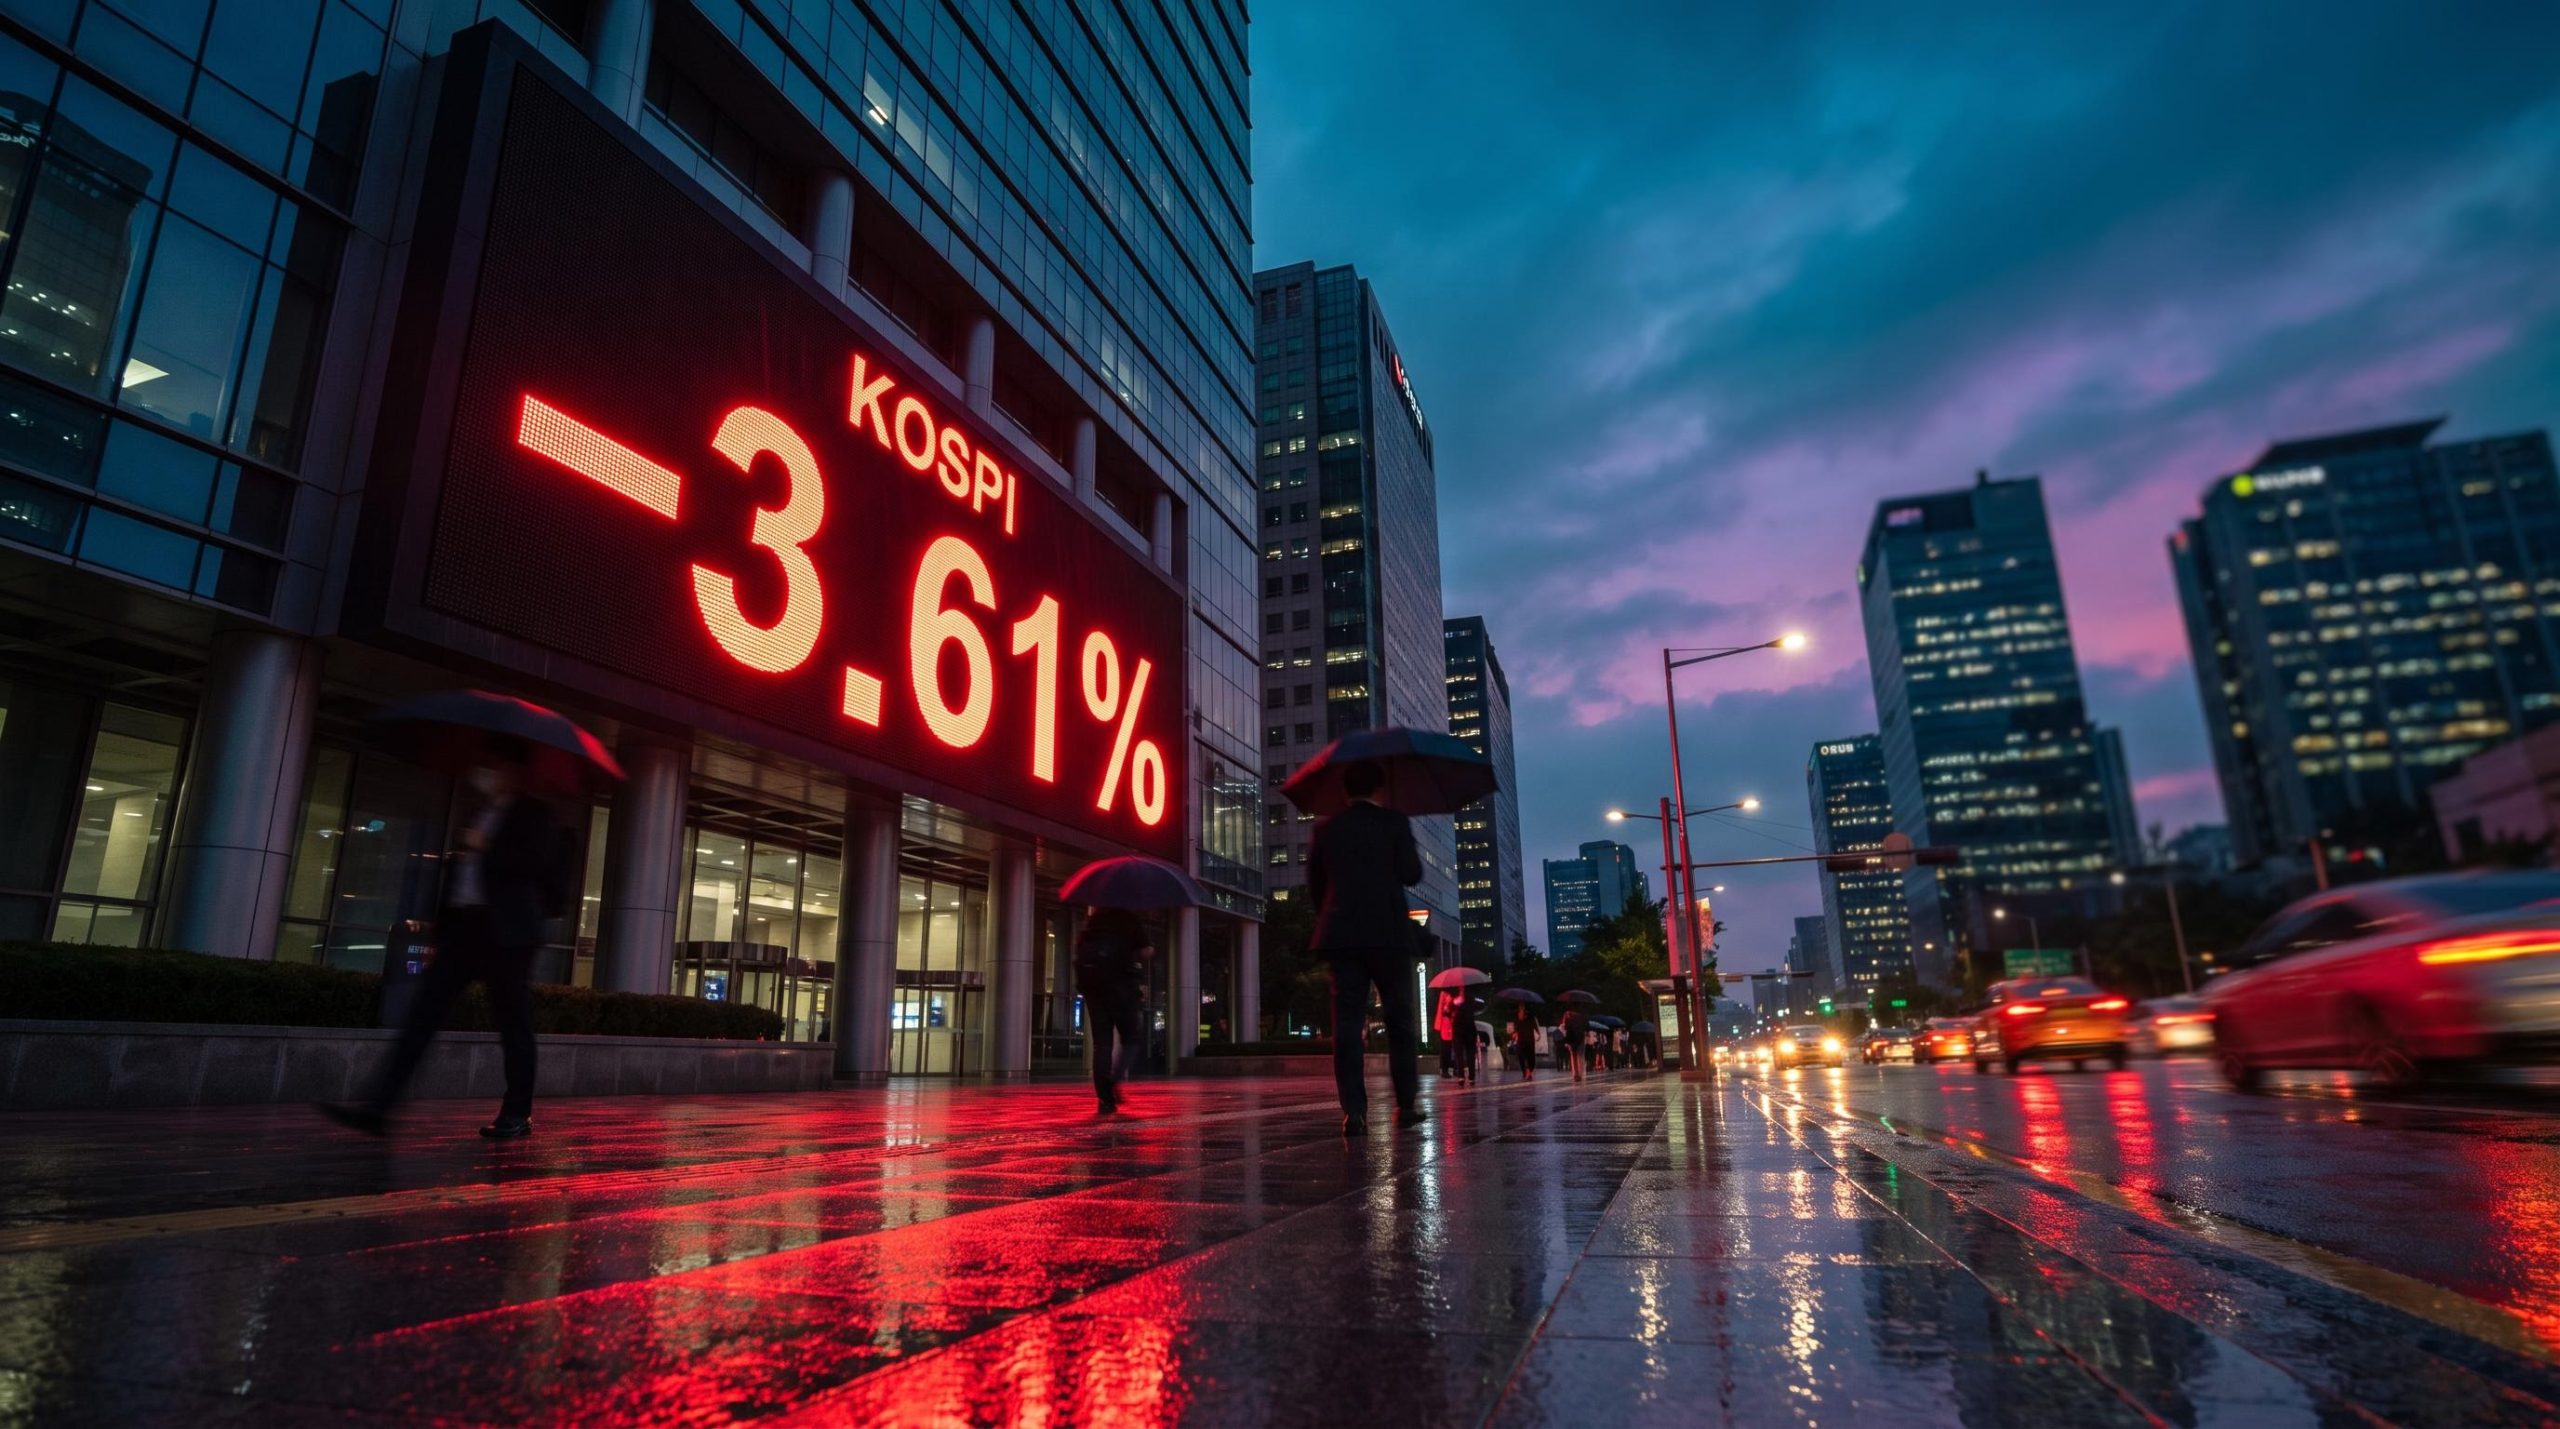
The KOSPI fell 3.61% on Tuesday, 20 October 2026, while S&P 500 e-mini futures did not move at all. When Asian stocks slide that hard and Wall Street barely reacts, the cause is usually something specific to Asia.
The selling came a day before scheduled results from Meta, Tesla, Lam Research and Texas Instruments. Unrest in France, a firm dollar, oil near $110 a barrel and a surprise US waiver on Russia sanctions all weighed on sentiment at the same time.
Each of those forces looks manageable on its own. Together, they show how earnings expectations and geopolitical shocks spread across stocks, currencies, oil, gold and crypto. Here is how that chain works, where it breaks, and how you can use it to judge the next sell-off.
Why did Korea and the wider region fall hardest?
Start with the screen. Reuters’ Rocky Swift reported that the KOSPI dropped 3.61%, Japan’s Nikkei 225 lost 1.28% and MSCI Asia ex-Japan slipped 0.93%. Final closing levels were not available at the time of reporting.
| Market | Move | Context |
|---|---|---|
| KOSPI | -3.61% | Chip-heavy index, hardest hit |
| Nikkei 225 | -1.28% | Broad regional retreat |
| MSCI Asia ex-Japan | -0.93% | Wider region, milder fall |
| Euro Stoxx 50 futures | -0.71% | French unrest, risk-off tone |
| DAX / FTSE futures | -0.40% / -0.44% | Softer, not panicked |
| S&P e-mini futures | Unchanged at 7,734.25 | US waiting on earnings |
Korea’s fall was nearly three times the regional average. That gap comes from what the index holds. The KOSPI is dominated by large semiconductor and technology companies, so when investors question how fast or how profitably US tech giants will spend on AI, the selling lands on Korean chipmakers and their suppliers.
Daniel Morris of BNP Paribas Asset Management has pointed out that tech hardware drives both earnings and price gains, which pushes expectations high. Global hardware earnings are forecast to double year on year, with emerging markets expected to grow at twice that rate. When the bar sits that high, even doubt can move prices.
This was not a reaction to bad results. None had been published. It was de-risking, meaning investors cut exposure before an event that could hurt them.
Positioning, not conviction Chris Weston, head of research at Pepperstone, noted that while investors were willing to buy back shorts and wind down defensive hedges, that falls well short of the confidence needed to build big new AI holdings.
For you, the lesson is about composition. Owning “Korea” or “Asia” through an index can mean holding a leveraged view on a handful of chip names.
When two or three chipmakers dominate a benchmark, index concentration risk means a single sector wobble can drag the whole national market down, and your passive Korea or Asia fund absorbs the hit without you choosing it.
What happened on October 15
Tuesday was the second leg. Yonhap reported that on 15 October the KOSPI fell 7.57% to 5,554.22, after a sharp tech-led sell-off on Wall Street. Reuters linked that move to concerns about credit risk in AI infrastructure and flows from leveraged exchange-traded funds (ETFs), which are funds that borrow to amplify daily index moves. That fragility was still fresh when Tuesday’s selling started.
When big ASX news breaks, our subscribers know first
What do Wednesday’s earnings need to prove about AI?
All four companies are scheduled to report after the US close on Wednesday, 21 October, according to an October 19 preview. The original reporting said Tesla, Lam and Texas Instruments would report “later in the week”, so treat the timing for those three as slightly uncertain.
The useful way to read these reports is as four checks on a single idea: that AI spending keeps growing and eventually pays for itself. Each company sits at a different point in that chain.
| Company | Reports | Key figure | What it signals |
|---|---|---|---|
| Meta | 21 Oct, after close | Consensus revenue $63.18B, EPS $6.67; guidance $61-64B | Ad demand and AI capex appetite |
| Tesla | 21 Oct, after close | Consensus revenue $27.8B, EPS $0.44 | Consumer strength |
| Lam Research | 21 Oct, after close | Guidance revenue $8.10B ± $400M, GAAP EPS $2.15 ± $0.15 | Chip equipment orders |
| Texas Instruments | 21 Oct, after close | Guidance revenue $5.65-6.15B, EPS $2.23-2.57 | Broad semiconductor demand |
The Tesla figure uses the more recent consensus; an earlier calendar listed EPS at $0.21. Meta tells you whether the biggest spenders are still writing cheques. Lam tells you whether those cheques are reaching the factories that make chips, which matters directly for Korean suppliers.
If any of the four guides weakly, Tuesday’s sell-off looks justified. Solid guidance would suggest the selling was positioning rather than a change in fundamentals.
The monetisation gap
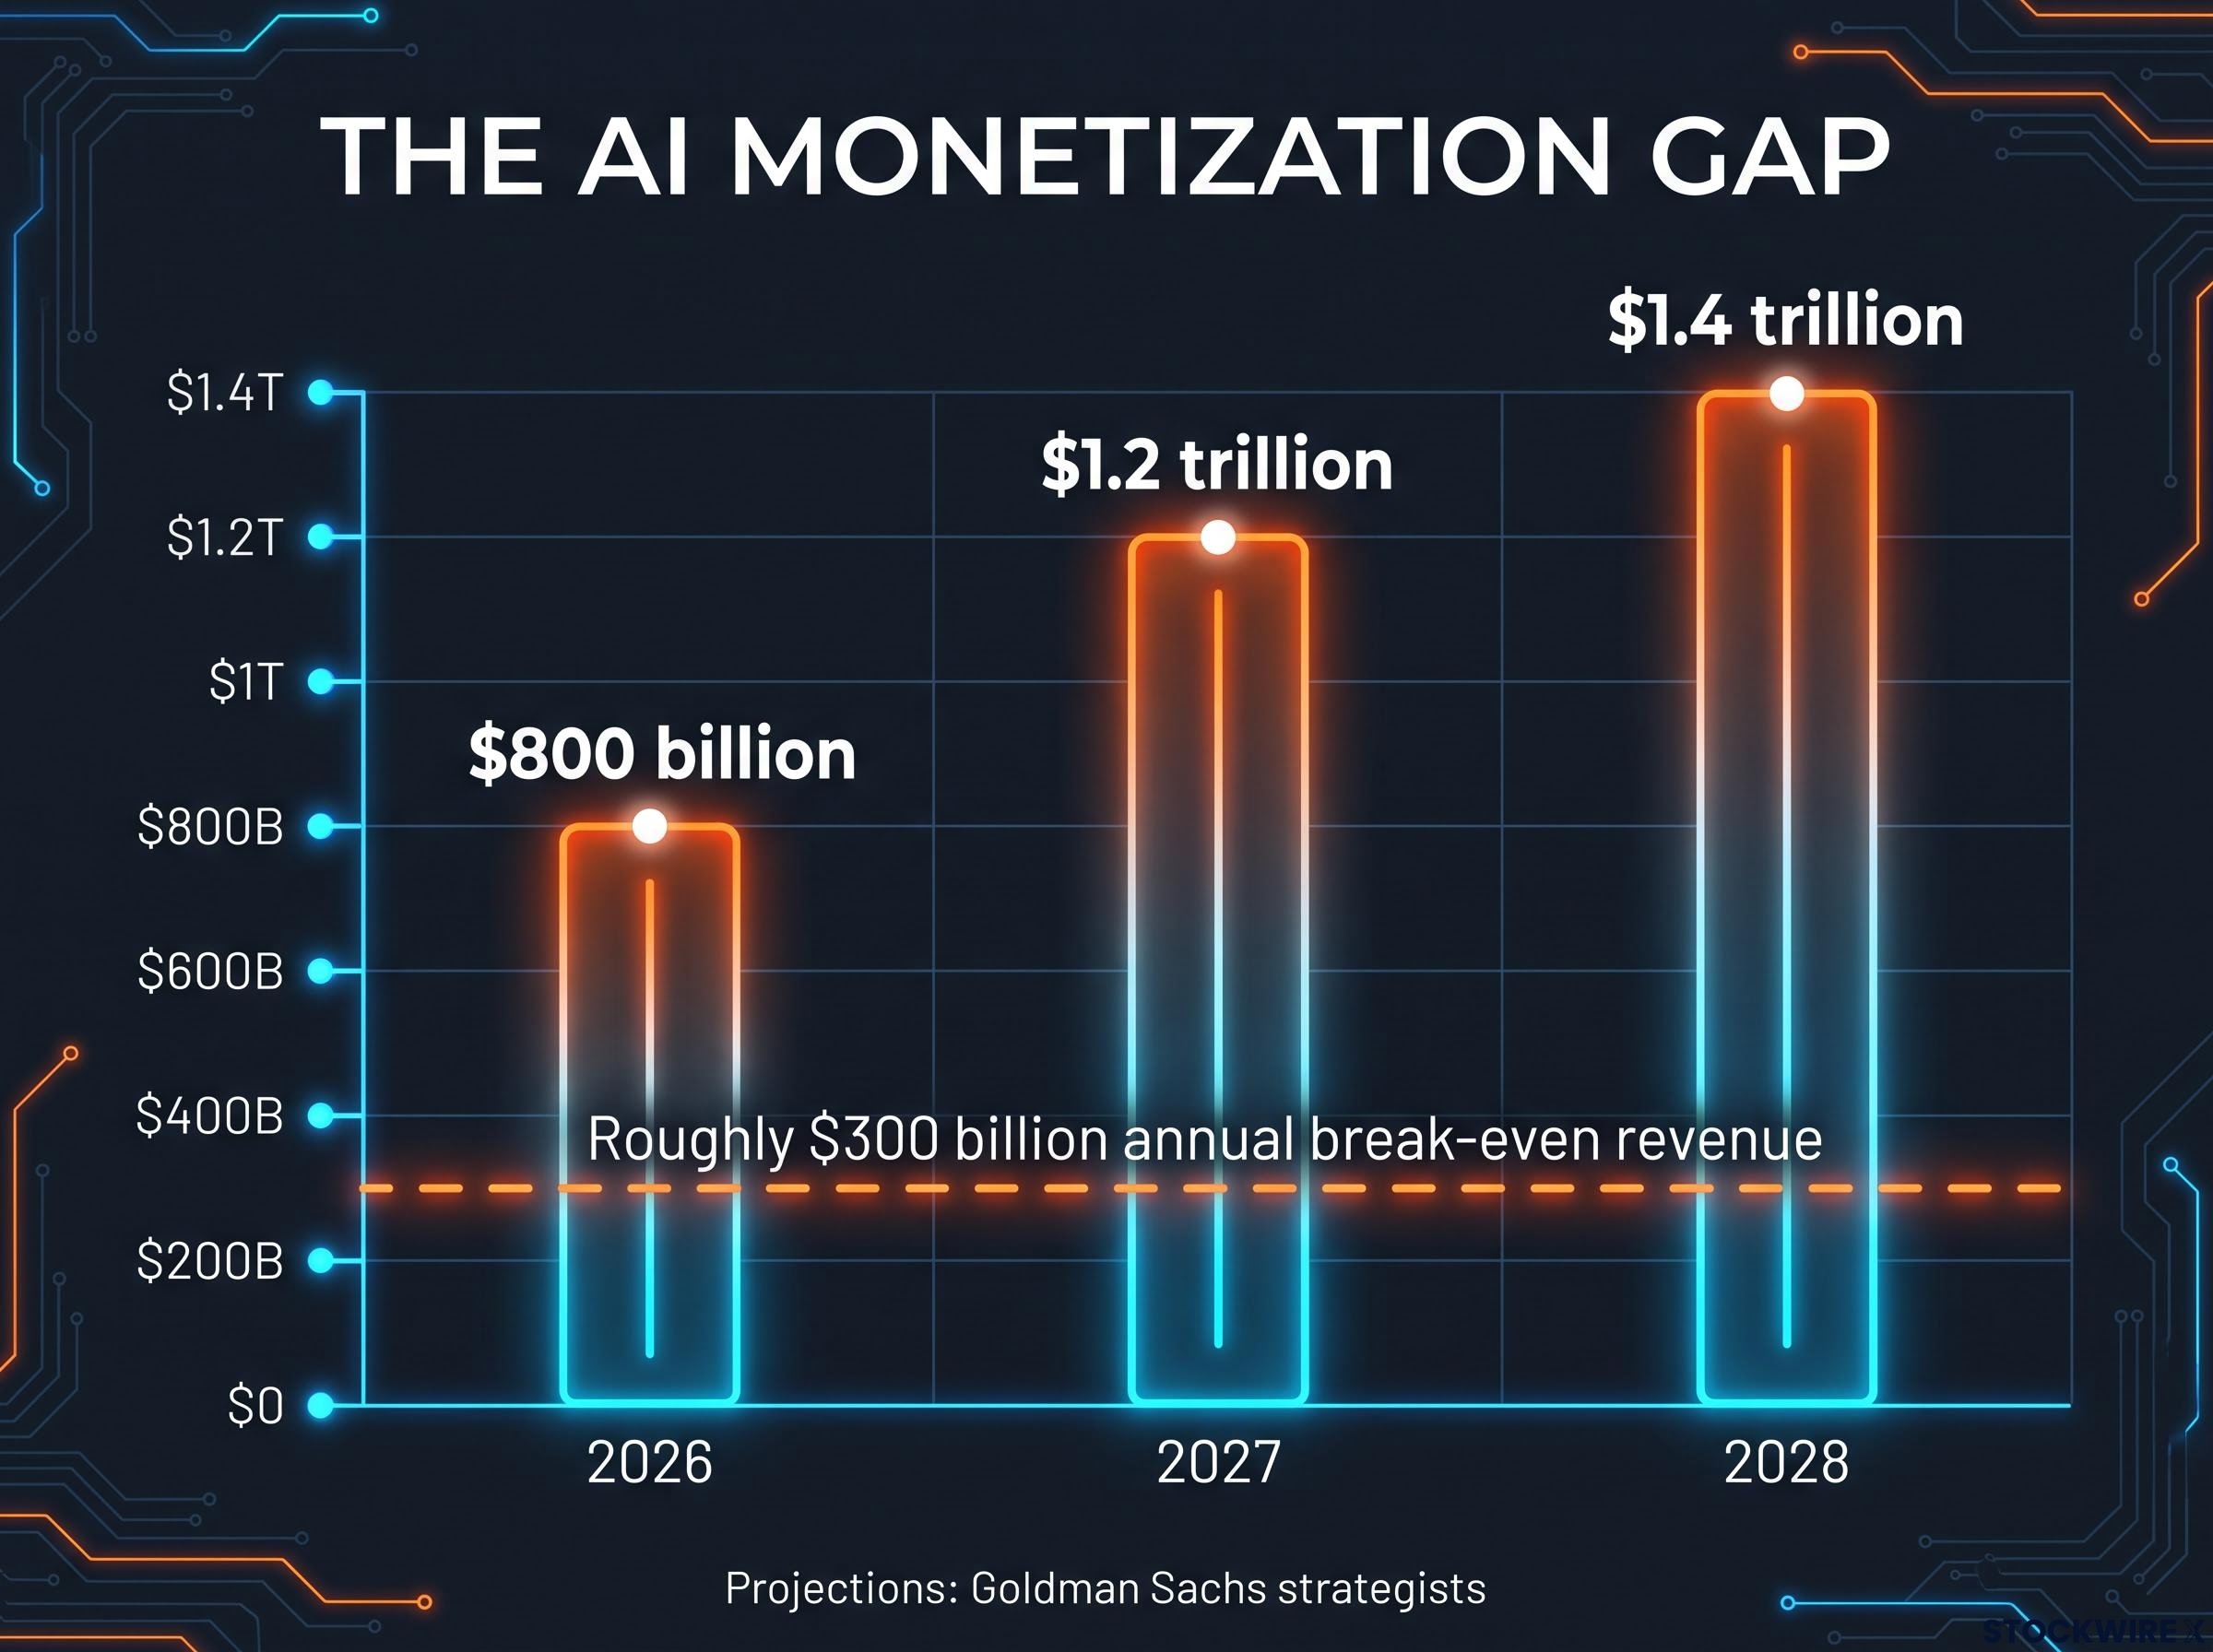
Goldman Sachs strategists led by Ryan Hammond project spending by the five largest US hyperscalers (giant cloud and platform operators, including Meta) as follows:
- 2026: about $800 billion
- 2027: about $1.2 trillion, above Wall Street consensus of about $1.1 trillion
- 2028: about $1.4 trillion
Goldman estimates those outlays need roughly $300 billion in annual AI revenue to break even. That is the monetisation question: spending is visible now, while the returns remain a forecast.
The AI revenue gap widens when hyperscaler capex outruns the earnings it is meant to generate, and some research frames the risk as an earnings problem rather than a valuation one, which makes profit forecasts the number to watch.
South Korea offered a live example this week. Elice Group, an AI and data-centre infrastructure firm, raised 201.1 billion won with retail demand around 400 times the shares available, then fell on debut. Reports differ on the size, from 16% below its IPO price to as much as 33% intraday. Heavy demand did not protect the valuation.
How do the dollar, rates, France and oil add pressure?
Earnings anxiety explains why chips fell. It does not explain why everything else felt heavy. For that, you need the outside shocks.
| Asset | Level | Move | Likely driver |
|---|---|---|---|
| Dollar index | 101.92 | -0.05% | Safe-haven demand, holding firm |
| Euro | $1.12 | +0.06% | Recovery after Monday’s dip |
| Yen | 158.57 per dollar | Weakened 0.03% | Dollar strength |
| Brent crude | $109.78 | +0.21% | Middle East supply risk |
| WTI crude | $103.82 | +0.15% | Same |
| Spot gold | $4,118.71 | -0.51% | Preference for cash |
| Bitcoin / Ether | $81,386.40 / $2,385.75 | -0.67% / -0.54% | Risk reduction |
France and the dollar
Anti-government protests turned into weekend riots. Authorities imposed localised curfews in parts of Paris, Lille and Nice, and Reuters-linked reporting counted about 2,400 arrests and nearly 1,000 officers injured over 17-18 October.
The dollar held firm on safe-haven demand, yet the euro rose 0.06% to $1.12 after a 0.25% fall on Monday, and the pound traded at $1.33. Weston observed that European equities already appear to reflect the risk around French government debt, and that the steadiness of the euro suggests markets do not see a wider crisis across the continent. The currency market is telling you this is serious for France but contained for the bloc.
Oil and the Russia waiver
On Friday night, President Trump signed an executive order waiving key sanctions and tariffs on Russia, including penalties on buying Russian oil. He then said no final decision had been announced, and Secretary of State Marco Rubio said the administration could take up to 60 days to assess the impact.
More Russian supply should push crude lower, and some outlets framed it that way. Reuters data showed prices edging higher instead, because attacks involving Saudi Arabia and Yemen keep Middle East disruption risk alive.
Rates add a quieter layer. Fed Chair Kevin Warsh struck an optimistic tone on Friday with no guidance on hikes, yet Yonhap still cited rate-hike fears behind Korea’s selling. This week’s speakers include the ECB’s Martin Kocher and Olli Rehn, and the Bank of England’s Megan Greene.
Gold and crypto
Gold, Bitcoin and Ether all fell while the dollar held firm. That tells you investors wanted cash and dollars specifically, not every asset with a safe-haven label.
Geopolitical safe-haven flows explain why you can see the dollar firm while gold and crypto both fall, because leveraged investors raise dollar cash first and sell other assets to do it.
How do these shocks connect, and what could the market be misreading?
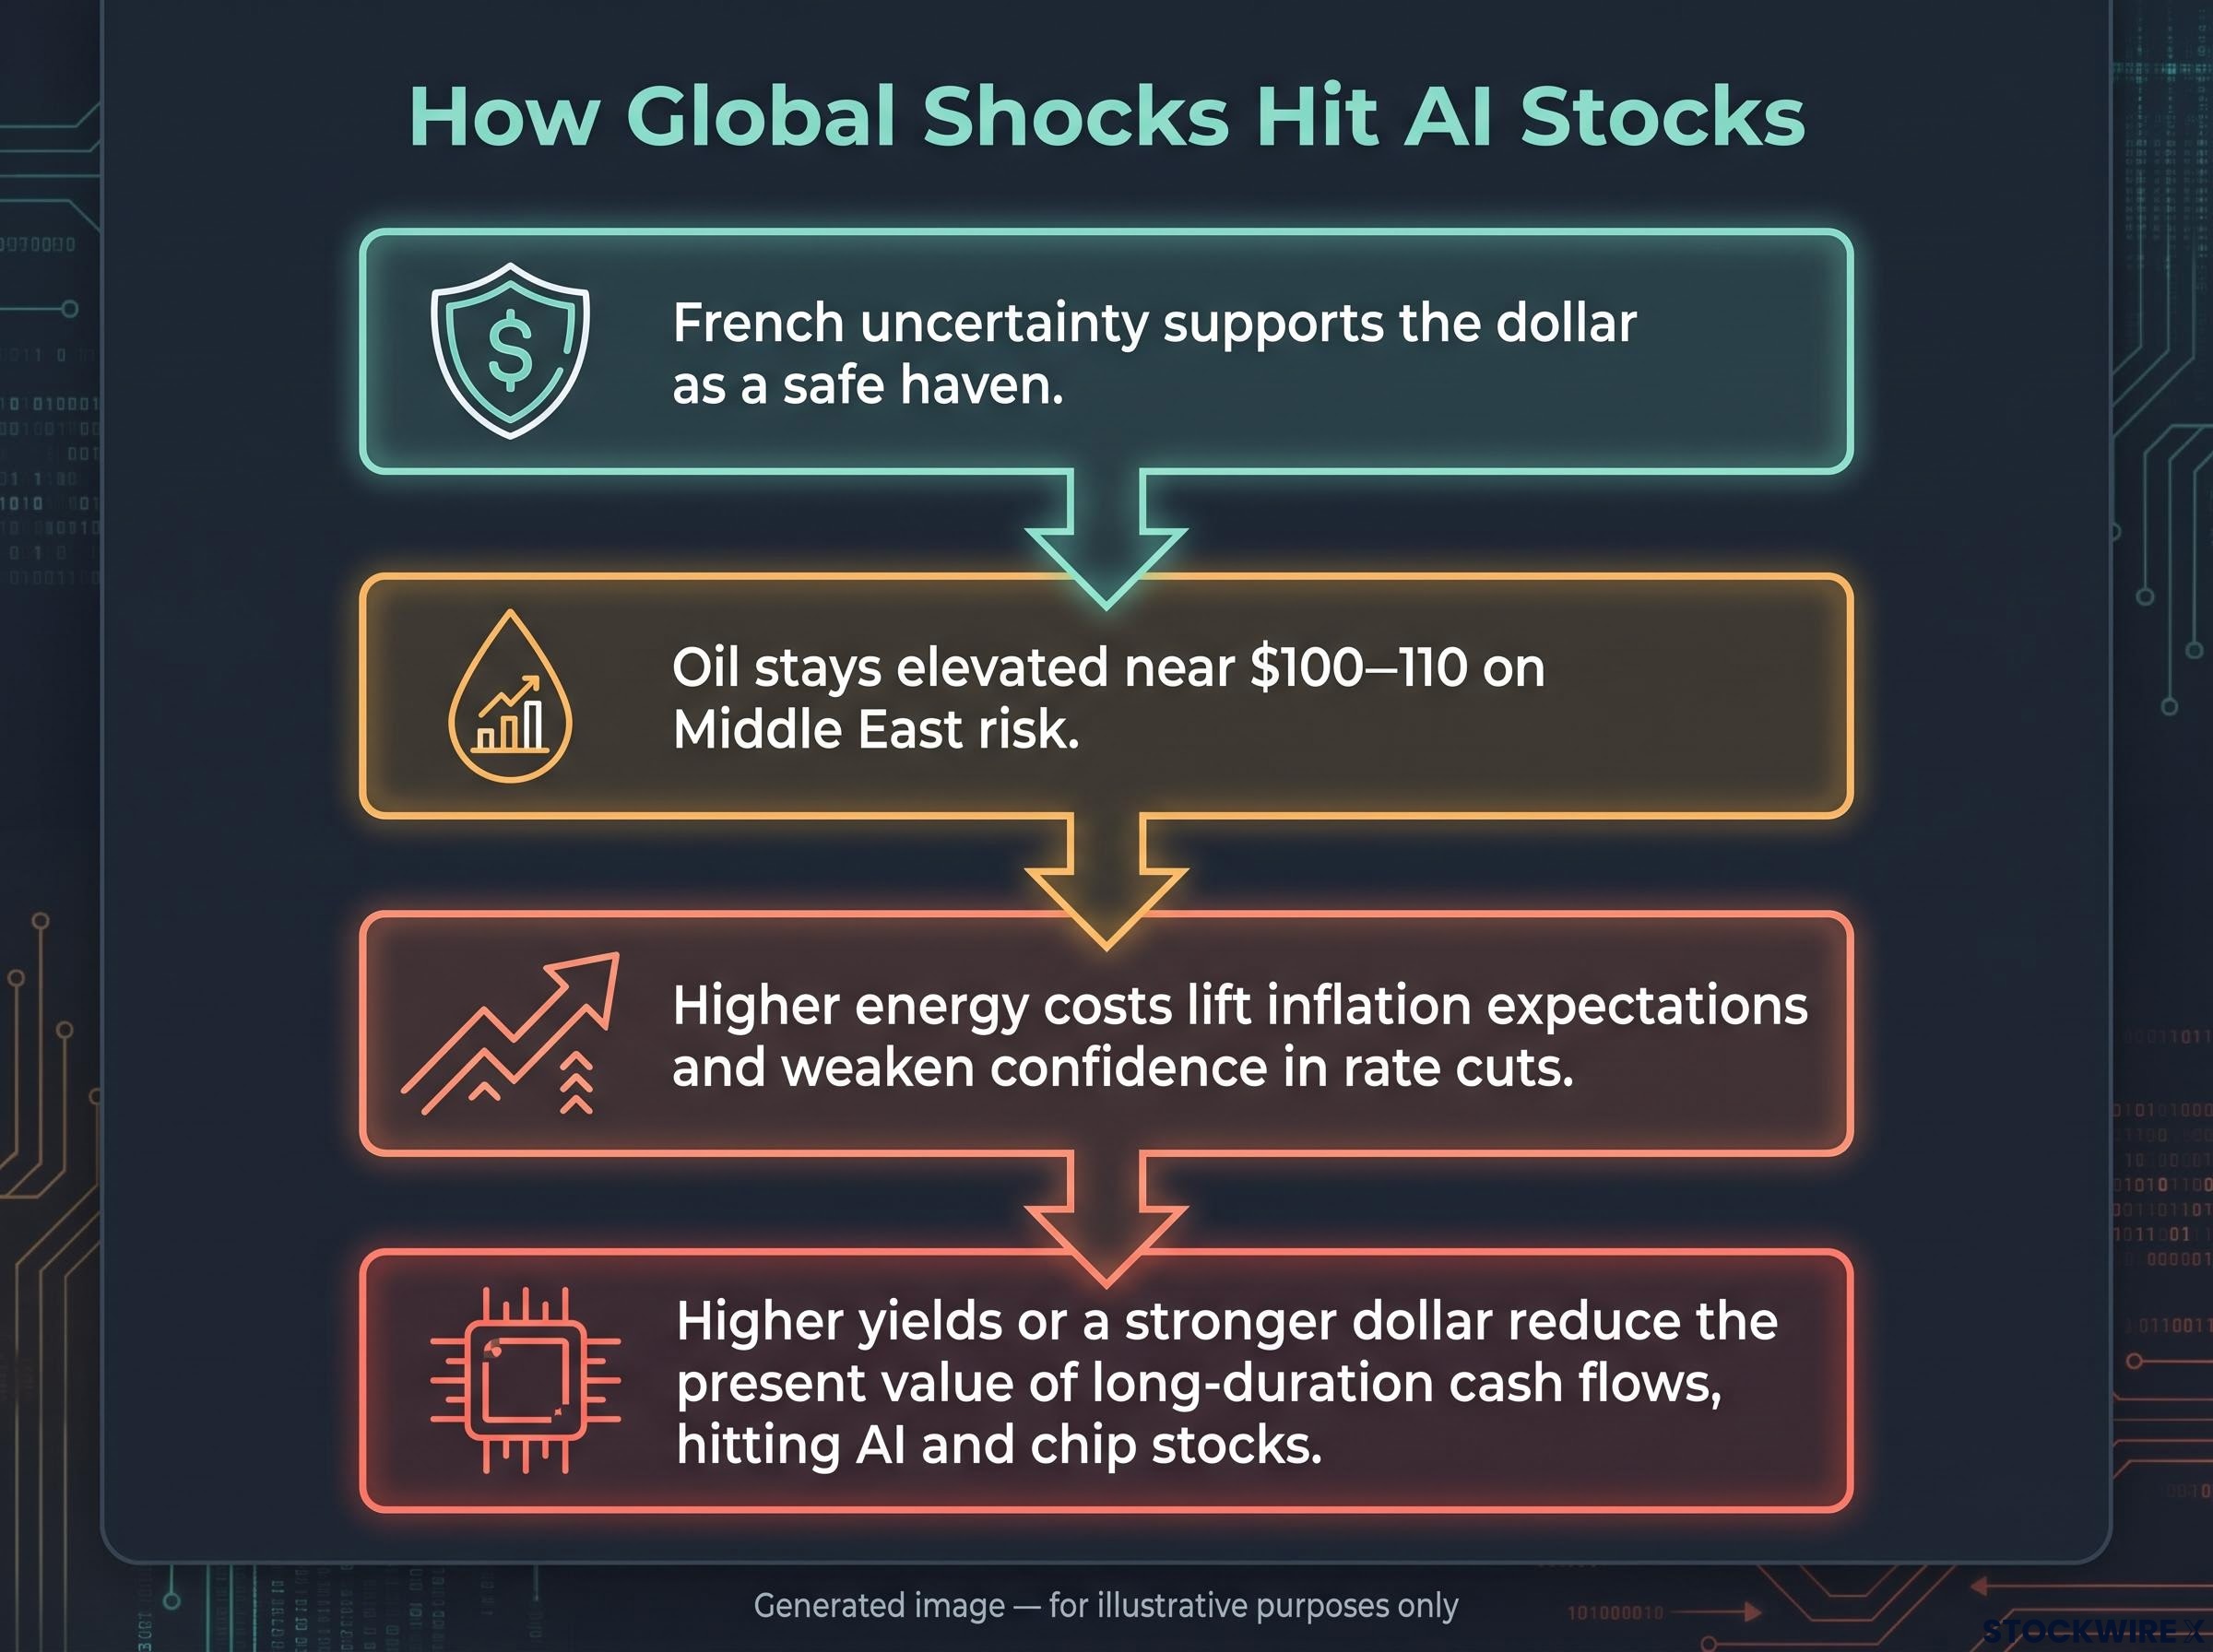
Put the pieces together and a sequence appears:
- French uncertainty supports the dollar as a safe haven.
- Oil stays elevated near $100-110 on Middle East risk, despite possible Russian supply.
- Higher energy costs lift inflation expectations and weaken confidence in rate cuts.
- Higher yields or a stronger dollar reduce the present value of long-duration cash flows, meaning profits expected far in the future are worth less today. AI and chip stocks feel this most.
Structural or cyclical?
The chain explains the pressure, but you still need to judge whether it reflects a lasting problem or a temporary one.
| Reading | What it means | Evidence |
|---|---|---|
| Structural | AI returns may not justify spending | Capex rising to $1.4T by 2028 against roughly $300B annual break-even revenue; Elice debut |
| Cyclical | Temporary selling around events | Profit-taking, pre-earnings positioning, unwinding of crowded tech trades, rate fears |
The October 15 collapse, the Elice debut and this week’s pre-results trimming fit both readings at once, which is why the debate is hard to settle. Real risks remain on the structural side: data-centre spending raises financing and credit exposure if rates stay high, oil could feed inflation, and earnings could disappoint.
What the market may be overlooking
There is also a case that the selling went too far:
- Goldman found analyst forecasts for 2026-27 hyperscaler capex and R&D rose by more than $300 billion over two months, which suggests the spending cycle is intact.
- The Russia waiver could eventually lift exports and lower crude, although the 60-day review leaves the timing open.
- The euro’s resilience suggests French unrest is not a systemic threat.
For you, the takeaway is that several pressures overlap here. A single strong or weak earnings report will not settle the question on its own.
For readers wanting the US side of this story, our detailed coverage of S&P 500 chip concentration shows how few semiconductor stocks drive index gains.
What to watch after Wednesday’s results
Tuesday’s slide combined crowded AI positioning, Korea’s heavy chip concentration, worries about oil and rates, and selective demand for dollars over other havens. No single shock drove it, and no single data point will reverse it.
Four indicators will tell you which way the balance is tipping:
- Meta and Lam Research guidance on capex and equipment demand
- Whether Brent holds above $100
- The dollar index and the yen, as gauges of safe-haven pressure
- Any firmer signalling from the Fed or ECB on rates
If guidance is solid and oil eases, Tuesday will look like positioning. If guidance slips while yields climb, the structural reading gains weight. Either way, judge the trend across several sessions rather than reacting to one day’s move.
Forecasts cited here are subject to market conditions, and past performance does not guarantee future results. This article is for informational purposes only and should not be considered financial advice. Investors should conduct their own research and consult with financial professionals before making investment decisions.