
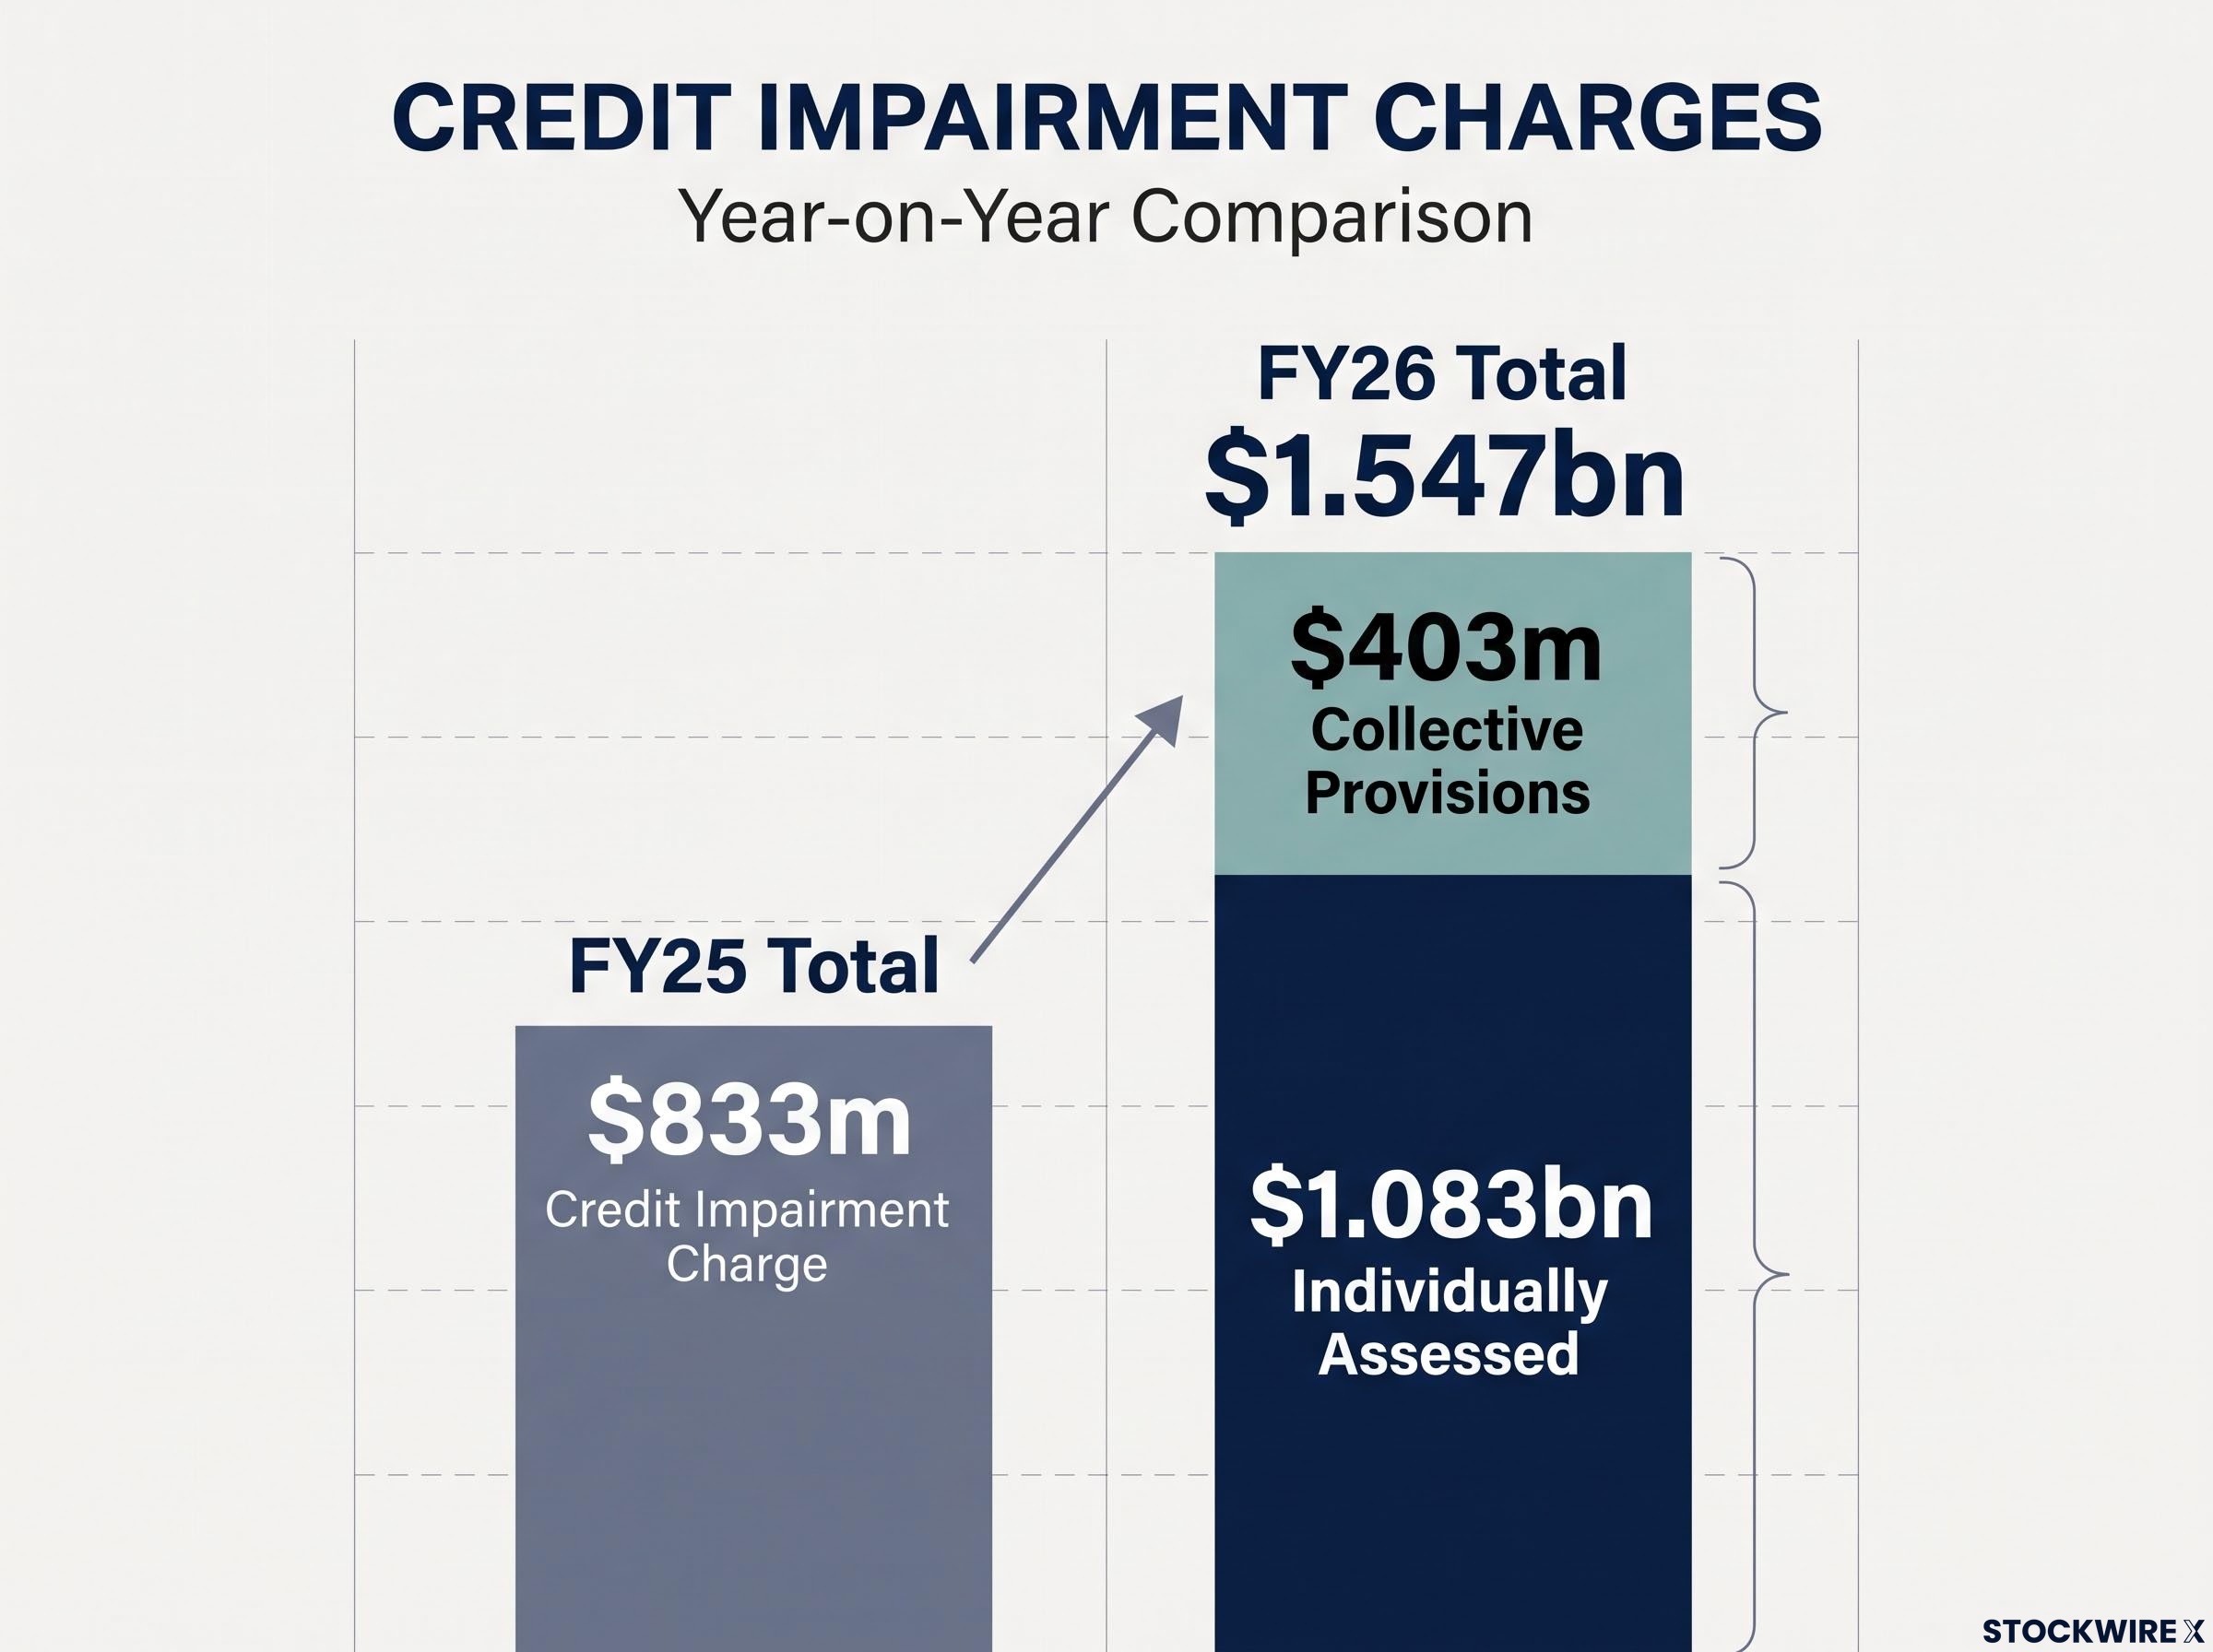
National Australia Bank has posted an 86% jump in its credit impairment charge to $1.547bn for FY26, up from $833m a year earlier. Its shares fell about 7% to a three-week low on 5 November 2026.
The larger bad-debt charge helped pull cash earnings down to $6.14bn, from about $7.09bn, while the full-year dividend held at $1.70. If you hold bank shares or follow the sector, the question is whether this marks a one-off reset or the start of a longer run of credit costs.
The answer depends on what sits inside the number. Here is how much of the charge is an accounting cushion and how much reflects borrowers already in trouble, how NAB compares with Westpac and CBA, and which signals to watch next.
Why did NAB’s impairment charge jump $714m in a year?
The headline rise is $714m. Taken at face value, it reads like a sudden spike in defaults. The detail tells a more mixed story.
What is a credit impairment charge?
A credit impairment charge is the amount a bank sets aside to cover loan losses it expects. It comes straight out of pre-tax profit in the year it is booked, whether or not any cash has been lost.
That is why a margin gain did not rescue the result. NAB’s net interest margin (NIM), the gap between what the bank earns on loans and what it pays for funding, rose 6bp to 1.80%. The bigger charge still absorbed most of that benefit. Excluding about $1.35bn of software write-downs, cash earnings were roughly flat at $7.09bn.
Analysts had flagged net interest margins and the bad-debt trajectory as the variables most likely to move bank share prices, ahead of headline profit, and NAB’s reaction fits that pattern.
| Measure | FY26 | FY25 | Change |
|---|---|---|---|
| Credit impairment charge | $1.547B | $833M | +85.7% |
| Cash earnings | $6.14B | approx. $7.09B | -13.4% |
| Net interest margin | 1.80% | 1.74% | +6bp |
| Default-but-not-impaired ratio | 1.22% | 1.26% | -4bp |
| Full-year dividend | $1.70 | $1.70 | Unchanged |
Overlay versus borrower stress
The first part of the charge is caution. NAB added about $403m to forward-looking collective provisions, which are model-based estimates of losses across whole loan pools. Collective provisions rose to 1.40% of credit risk-weighted assets (CRWA), the bank’s loan book adjusted for riskiness. Total provisions reached 1.76%.
Morningstar and Reuters-related reporting linked this top-up to persistent inflation, higher rates and weaker housing. No public broker note explaining the rise was found.
The second part is harder evidence. Individually assessed charges of $1.083bn relate to specific customers, mainly in business lending. NAB also reported higher home-lending arrears.
That split matters for your read on the profit drop. The $403m overlay is not necessarily a realised loss and could be released if conditions improve. The $1.083bn points to particular borrowers already under strain, which helps explain why the market reacted so sharply.
When big ASX news breaks, our subscribers know first
How does NAB’s result compare with Westpac and CBA?
The timing differs before any comparison starts. NAB and Westpac reported for the year to 30 September 2026. Commonwealth Bank (CBA) reported to 30 June 2026, with results released on 11 August.
Even with that gap, the three results line up. Westpac’s charge more than doubled to $864m from $424m, or 10bp of loans. The stress showed up in cards, personal lending and 90+ day mortgage delinquencies. Its second-half NIM slipped to about 1.86% from 1.89%.
Westpac’s cushion: impairment charge up 104%, yet pre-provision profit up 4% to $10.9bn
CBA’s impairment expense rose from low levels and some consumer arrears increased, but realised losses stayed low. Cash net profit grew about 7% to $11.0bn.
CBA’s record profit came with $6.5bn in total provisions, $2.7bn above its central expected credit loss scenario, a buffer that helps explain why its realised losses stayed low.
| Bank | Reporting period | Impairment signal | Main stress area | Earnings signal |
|---|---|---|---|---|
| NAB | Year to 30 Sep 2026 | $1.547B, largest in dollar terms | Business lending | Cash earnings -13.4% |
| Westpac | Year to 30 Sep 2026 | $864M, up 104% | Cards, personal loans, 90+ day mortgages | Pre-provision profit +4% |
| CBA | Year to 30 Jun 2026 | Up from low levels | Consumer portfolios | Pre-provision profit +6% to $16.5B; ROE 14.0% |
CBA’s return on equity (ROE), its profit relative to shareholder funds, was 14.0%. Taken together, the three results look like an early-to-middle stage provisioning cycle rather than a crisis.
For you, the takeaway is that NAB’s charge is part of a sector-wide shift. Its earnings miss and heavier business-lending exposure are what made it the most punished of the three.
What is weaker mortgage activity doing to the outlook?
The housing data arrived alongside the bank results, and it was weak. According to The Adviser, post-budget mortgage applications fell by between 9% and 28%, depending on the bank and the type of borrower.
| Bank | Investors | Owner-occupiers |
|---|---|---|
| NAB (-15% overall) | -17% | -14% |
| Westpac | -26% | -18% |
| CBA | -28% | -9% |
Investors pulled back hardest. Several pressures are hitting at the same time:
- Investor tax uncertainty after the budget, prompting buyers to delay applications
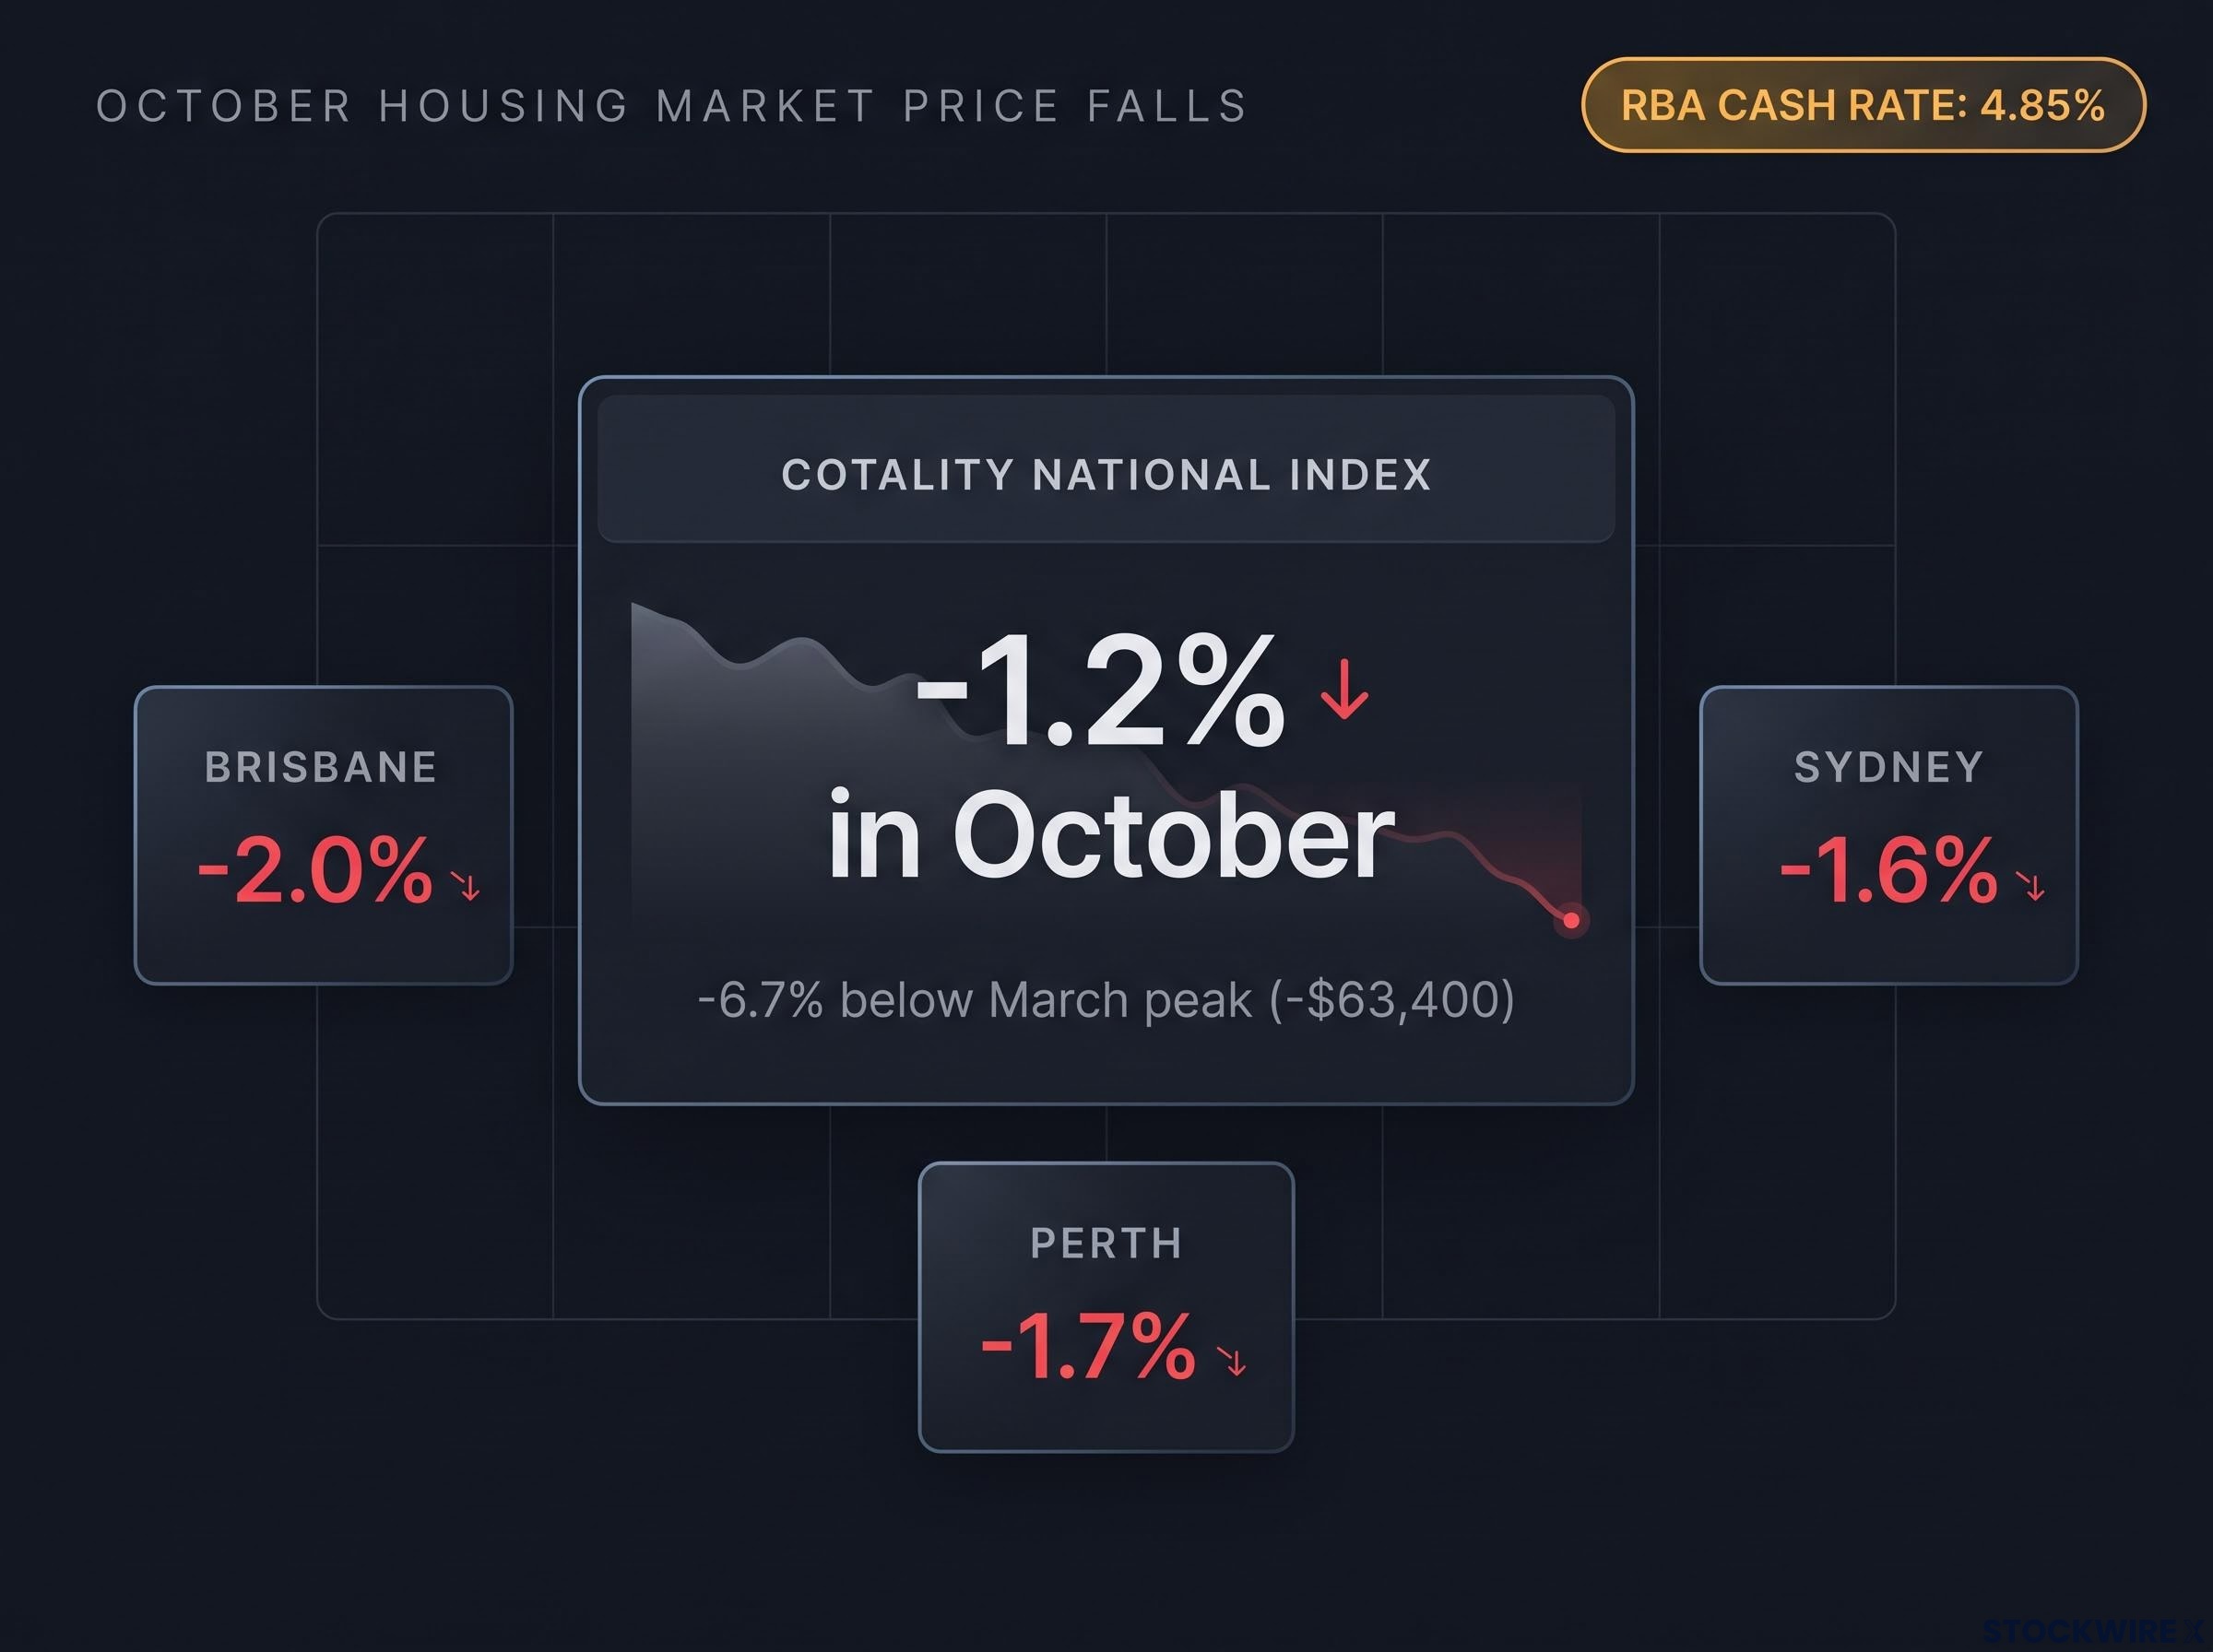
- Four RBA increases in 2026, taking the cash rate to 4.85% from 4 November
- Affordability limits, which Cotality links to higher costs and weaker sentiment
- Seven straight months of price falls, giving buyers a reason to wait
Cotality’s national index fell 1.2% in October and now sits 6.7% below its March peak, about $63,400 off the peak median value. Brisbane fell 2.0%, Perth 1.7% and Sydney 1.6%. Australian Bureau of Statistics (ABS) data showed June quarter loan commitments down 5.4% by number, with investors down 8.6%.
Rising housing supply does not explain the immediate slump. The pattern looks cyclical in the short term but carries structural elements, including high debt levels and investors’ sensitivity to tax changes.
Falling prices and fewer applications feed back into loan growth and the value of the homes securing those loans. That makes housing data an early indicator of where impairment charges head next.
What should investors watch after NAB’s result?
There are real reasons for reassurance. NAB’s common equity tier 1 (CET1) ratio, its core capital buffer against losses, is 12.07% against an 11.25% target. The 85c final dividend was maintained, margins improved and the default-but-not-impaired ratio, which tracks overdue loans the bank still expects to recover, fell to 1.22%.
The warnings are just as concrete. Individually assessed charges show business borrowers already in strife, arrears are climbing across the major banks, and price falls can show up in defaults months later.
Provisions versus arrears: provisions are model-based forecasts of future losses. Arrears are borrowers who have actually missed repayments. Provisions can rise before arrears do.
These are the signals worth tracking:
- Monthly arrears and 90+ day delinquencies: the clearest measure of real borrower behaviour.
- Individually assessed versus collective charges: a shift towards specific charges means stress is materialising.
- The default-but-not-impaired ratio (1.22%): an early read on loans going bad.
- RBA decisions from 4.85%: each move changes repayments and borrowing capacity.
- APRA commentary and house prices (6.7% off peak): regulator signals and the value of loan security.
- Dividend coverage and the next bank trading updates: whether payouts stay covered after credit costs.
Prioritise the second item. A move from overlays to actual write-offs would tell you the risk is turning from precaution into realised loss.
For readers wanting to weigh CET1 buffers and loan quality together, our dedicated guide to valuing ASX bank stocks using balance sheet metrics explains how to read NPL ratios against funding mix.
Where the provisioning cycle goes from here
NAB’s charge combines a cautious $403m overlay with $1.083bn of specific business-lending stress, and it sits on a capital position well above target. That combination explains why the result looked worse than a crisis signal yet bad enough to knock about 7% off the share price.
Broker forecasts had already flagged loan loss risk as underpriced across the big four, with NAB carrying the largest exposure, which helps explain why a single provisioning surprise can drive such a sharp share price reaction.
The next tests are close. The next round of arrears data will show whether borrower stress is spreading, the RBA’s next decision will show whether rates keep climbing, and the next bank trading updates will show whether provisions are turning into write-offs.
When you weigh your bank exposure, track the mix of charges more closely than the headline total. That mix is what will separate a temporary profit dip from a deeper credit cycle.
This article is for informational purposes only and should not be considered financial advice. Investors should conduct their own research and consult with financial professionals before making investment decisions.