

CBA caps FY26 with record cash profit and higher dividend
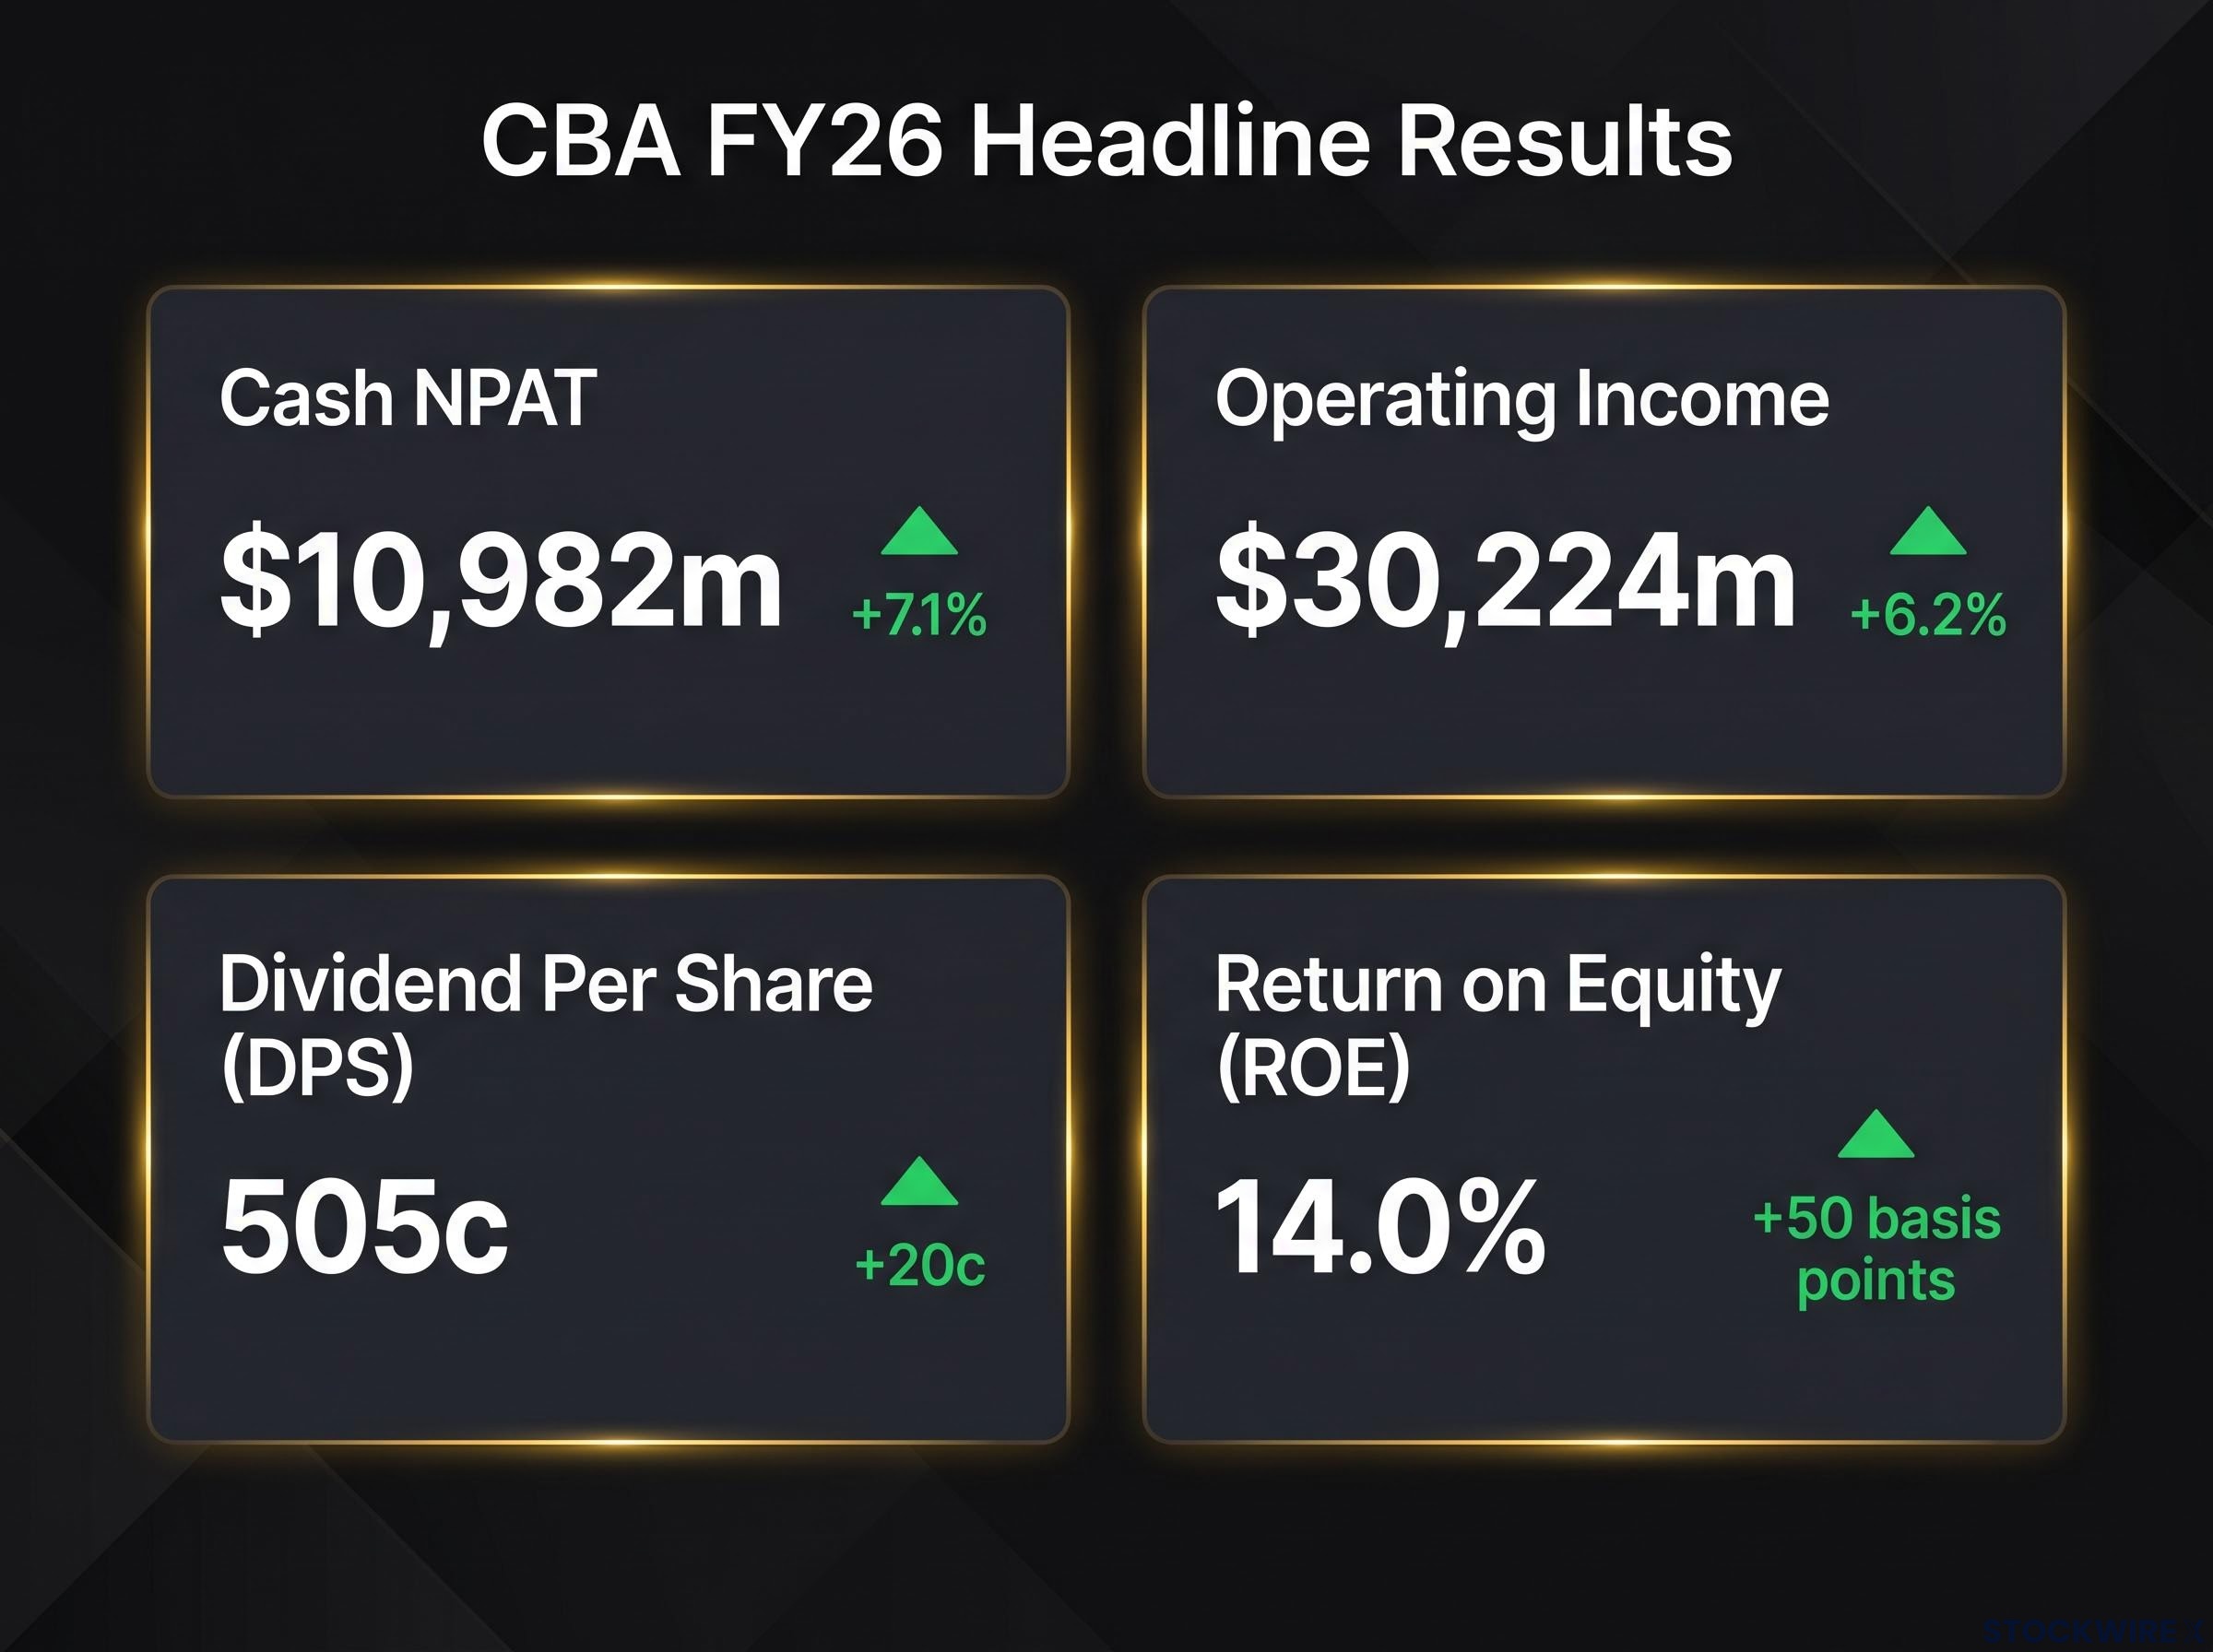
In its FY26 full-year results presentation for the period ended 30 June 2026, Commonwealth Bank of Australia delivered record cash net profit after tax (NPAT) of $11.0bn, up 7.1%, alongside a lifted full-year dividend. As Australia’s largest bank, the result revealed a return on equity (ROE) of 14.0%, up 50 basis points, with approximately $8bn returned to shareholders and indirectly benefitting more than 14 million Australians.
Management framed the outcome around disciplined growth that balanced volume, margin and returns. Full-year dividends per share (DPS) reached $5.05, up 20c, while the common equity tier 1 (CET1) capital ratio finished the period at 12.0%.
When big ASX news breaks, our subscribers know first
FY26 result at a glance
Operating income growth funded continued franchise investment while margins held broadly stable across a competitive market. The headline financials are summarised below.
| Metric | FY25 | FY26 | Change |
|---|---|---|---|
| Cash NPAT | $10,252m | $10,982m | +7.1% |
| Operating income | $28,465m | $30,224m | +6.2% |
| Net interest margin (NIM) | 2.08% | 2.05% | (3bps) |
| Cost-to-income | 45.7% | 45.5% | (20bps) |
| Cash EPS | 613c | 657c | +44c |
| DPS | 485c | 505c | +20c |
| CET1 (APRA Level 2) | 12.3% | 12.0% | (30bps) |
Supporting the result were several key drivers:
-
Pre-provision profit rose 6.5% to $16.5bn
-
Operating expenses increased 5.6%, reflecting inflation and continued technology and AI investment
-
Loan impairment expense was $788m, up 8.5%
How Australia’s biggest bank actually makes money
A bank of CBA’s scale earns profit through two primary engines. The first is net interest income, the margin between what the bank earns on loans and what it pays on deposits. The second is other operating income, which covers fees, commissions and trading revenue. A stable net interest margin (NIM) of 2.05% matters because it shows the bank is holding its profitability on each dollar lent even as lending volumes grow.
A few terms help frame the result:
-
Net interest margin (NIM): The difference between interest earned on loans and interest paid on deposits, expressed as a percentage. A stable NIM alongside volume growth supports rising earnings.
-
CET1 capital ratio: A regulatory safety buffer measuring the highest-quality capital a bank holds. CBA’s 12.0% sits above APRA’s 10.25% minimum.
-
Deposit funding: CBA reported it was 79% deposit funded, giving it a stable, lower-cost funding base to support lending through a rate cycle.
Divisional performance — where the growth came from
Growth was spread across the group’s divisions, with Business Banking standing out as the strongest earnings engine. CBA reported leading main financial institution (MFI) share of 34.2% in Retail and 26.0% in Business, both ranked number one.
| Division | Income vs FY25 | % of Group NPAT | Note |
|---|---|---|---|
| Retail Banking Services | +6% | 51% | Home lending $636bn (+7%) |
| Business Banking | +10% | 41% | Business lending $180bn (+13%), 1.3x system |
| Institutional Banking & Markets | +4% | 11% | #1 Institutional NPS |
| ASB (NZ, NZD) | +6% | 10% | Deposits and home lending +6% |
Business Banking delivered 11% cash NPAT growth, supported by business lending expanding at 1.3x system. Institutional Banking & Markets recorded a marked lift in client engagement, with its Institutional Net Promoter Score (NPS) rising to 59.8 from 34.7, retaining the number one position among the majors. ASB’s earnings were broadly flat in NZD terms.
ASB’s FY26 results tell a more nuanced story beneath the group-level numbers, with the New Zealand subsidiary reporting a 2% dip in cash profit to $1,318 million as a 16% surge in operating expenses weighed on earnings even as business and rural lending volumes reached a decade-high.
Credit quality and provisions held firm
Arrears rose modestly as cost-of-living and interest rate pressures affected some borrowers, but the loan book remained well-secured and provisioning conservative. Total provisions stood at $6.5bn, sitting $2.7bn above the central scenario expected credit loss (ECL) of $3.8bn, signalling a substantial buffer.
Home loan 90+ day arrears were 0.73%, the portfolio dynamic loan-to-value ratio (LVR) held stable at 41%, and negative equity represented just 0.5% of balances. The group’s loan loss rate of 8bps remained below historical levels.
Resilience indicators included:
-
85% of home loan customers ahead on their repayments
-
Offset and redraw balances of approximately $157bn
-
Troublesome and non-performing exposures at 0.94% of total committed exposures (TCE)
The provisioning held well above the central scenario provides balance-sheet resilience heading into an uncertain economic outlook.
Capital strength and shareholder returns
CBA maintained a CET1 ratio of 12.0% on an APRA Level 2 basis, equivalent to a surplus of approximately $9.2bn above the regulatory minimum and aggregate capital buffers of around $12bn. The full-year dividend of $5.05 (up 20c) reflected a payout ratio of 77%, moderating towards the middle of the group’s 70–80% target range. The dividend reinvestment plan (DRP) carried no discount and was expected to be fully neutralised.
Management confirmed that the existing $1 billion on-market share buy-back, of which $300 million has been completed, will not be extended. Over the longer term, CBA reported total shareholder return since January 2000 of 2,303%, compared with a peer average of 1,105%.
Matt Comyn, Chief Executive Officer
Supporting and helping to protect our customers, reimagining customer experiences by investing in technology and AI, providing strength and stability for the Australian economy, and delivering sustainable returns were the pillars management pointed to in summarising the group’s strategic focus.
Outlook and what management is watching
Management outlined an economic backdrop of slowing growth, driven by weaker household demand, with inflation still elevated but expected to moderate as the economy softens. Australia was described as remaining resilient despite global volatility and rising geopolitical risks.
A key demand signal management flagged was softening application volumes, with home loan applications down 15% since May and 17% against the prior year. On strategy, CBA indicated continued technology and AI investment, with investment spend guidance of approximately $2.4bn expected in FY27. Gross benefits from AI use cases are expected to double in FY27 and to exceed investment.
To execute at that investment scale, CBA moved earlier this year to split its technology leadership into two dedicated C-suite roles, separating customer-facing digital delivery from enterprise infrastructure and AI capabilities to reduce execution risk across its multi-year transformation programme.
Watch-points for FY27 include:
-
Investment spend guidance of approximately $2.4bn
-
An effective tax rate of approximately 30%
-
The phase-out of Additional Tier 1 (AT1) capital from 1 January 2027, against which CBA reported a Total Capital ratio of 20.8%
The FY26 result reinforced a familiar investment case: a leading retail and business franchise, broadly stable margins, a conservatively provisioned balance sheet and sustainable, growing dividends. With disciplined capital management and continued investment in technology and AI, management positioned the group to navigate a slowing but resilient Australian economy through FY27.
Stay Ahead on ASX Finance and Banking News
Get breaking ASX financial sector news delivered FREE to your inbox within minutes of release, complete with in-depth analysis already done for you. Join 20,000+ subscribers who never miss a market-moving announcement. Click the “Free Alerts” button at Big News Blast to start receiving real-time alerts the moment news breaks.