
Democrats are projected to control both the House and the Senate from January 2027, and the S&P 500 rose about 1.6% on 4 November, according to Investopedia. Other outlets put the gain closer to 1.8%. The market’s verdict looked clear, but the historical record suggests congressional control is a weaker signal than election-night commentary implies.
The vote took place on 3 November 2026. The Associated Press still showed 95 House races uncalled as of 5 November, so the final margin remains open even though control has been called.
Behind the vote sits a macro backdrop that carries more weight than the party label. The Federal Reserve is holding its target range at 3.75%-4.00%, September inflation ran at 3.7% year over year, and the economy grew at a 3.4% annualised pace in Q3.
Here is what the long-run data, the slow path from Capitol Hill to company earnings, and the latest macro readings tell you about staying disciplined after the midterm elections. Much of the stock market history cited comes from MFS Investment Management strategists Michael Dembro and Kevin Mullen, as reported by The Inside Network on 5 November.
What does the historical record say about the stock market after midterms?
Start with the widest lens. MFS found that across 1933 to 2025, the S&P 500 averaged a gain every year whichever party held the presidency and whichever controlled Congress. Those yearly averages sat between 8.6% and 19.2%.
Narrow the window to the year after a midterm, and the pattern sharpens rather than fades.
The post-midterm record Since 1938, the S&P 500 has been positive in the 12 months after 21 of the last 22 midterms, with an average return of 19.4% (MFS, as reported by The Inside Network).
The one exception came in 1939, when the index slipped 0.4% as World War II began. Now narrow again, to the six midterms since 1994 that shifted or expanded control of Congress.
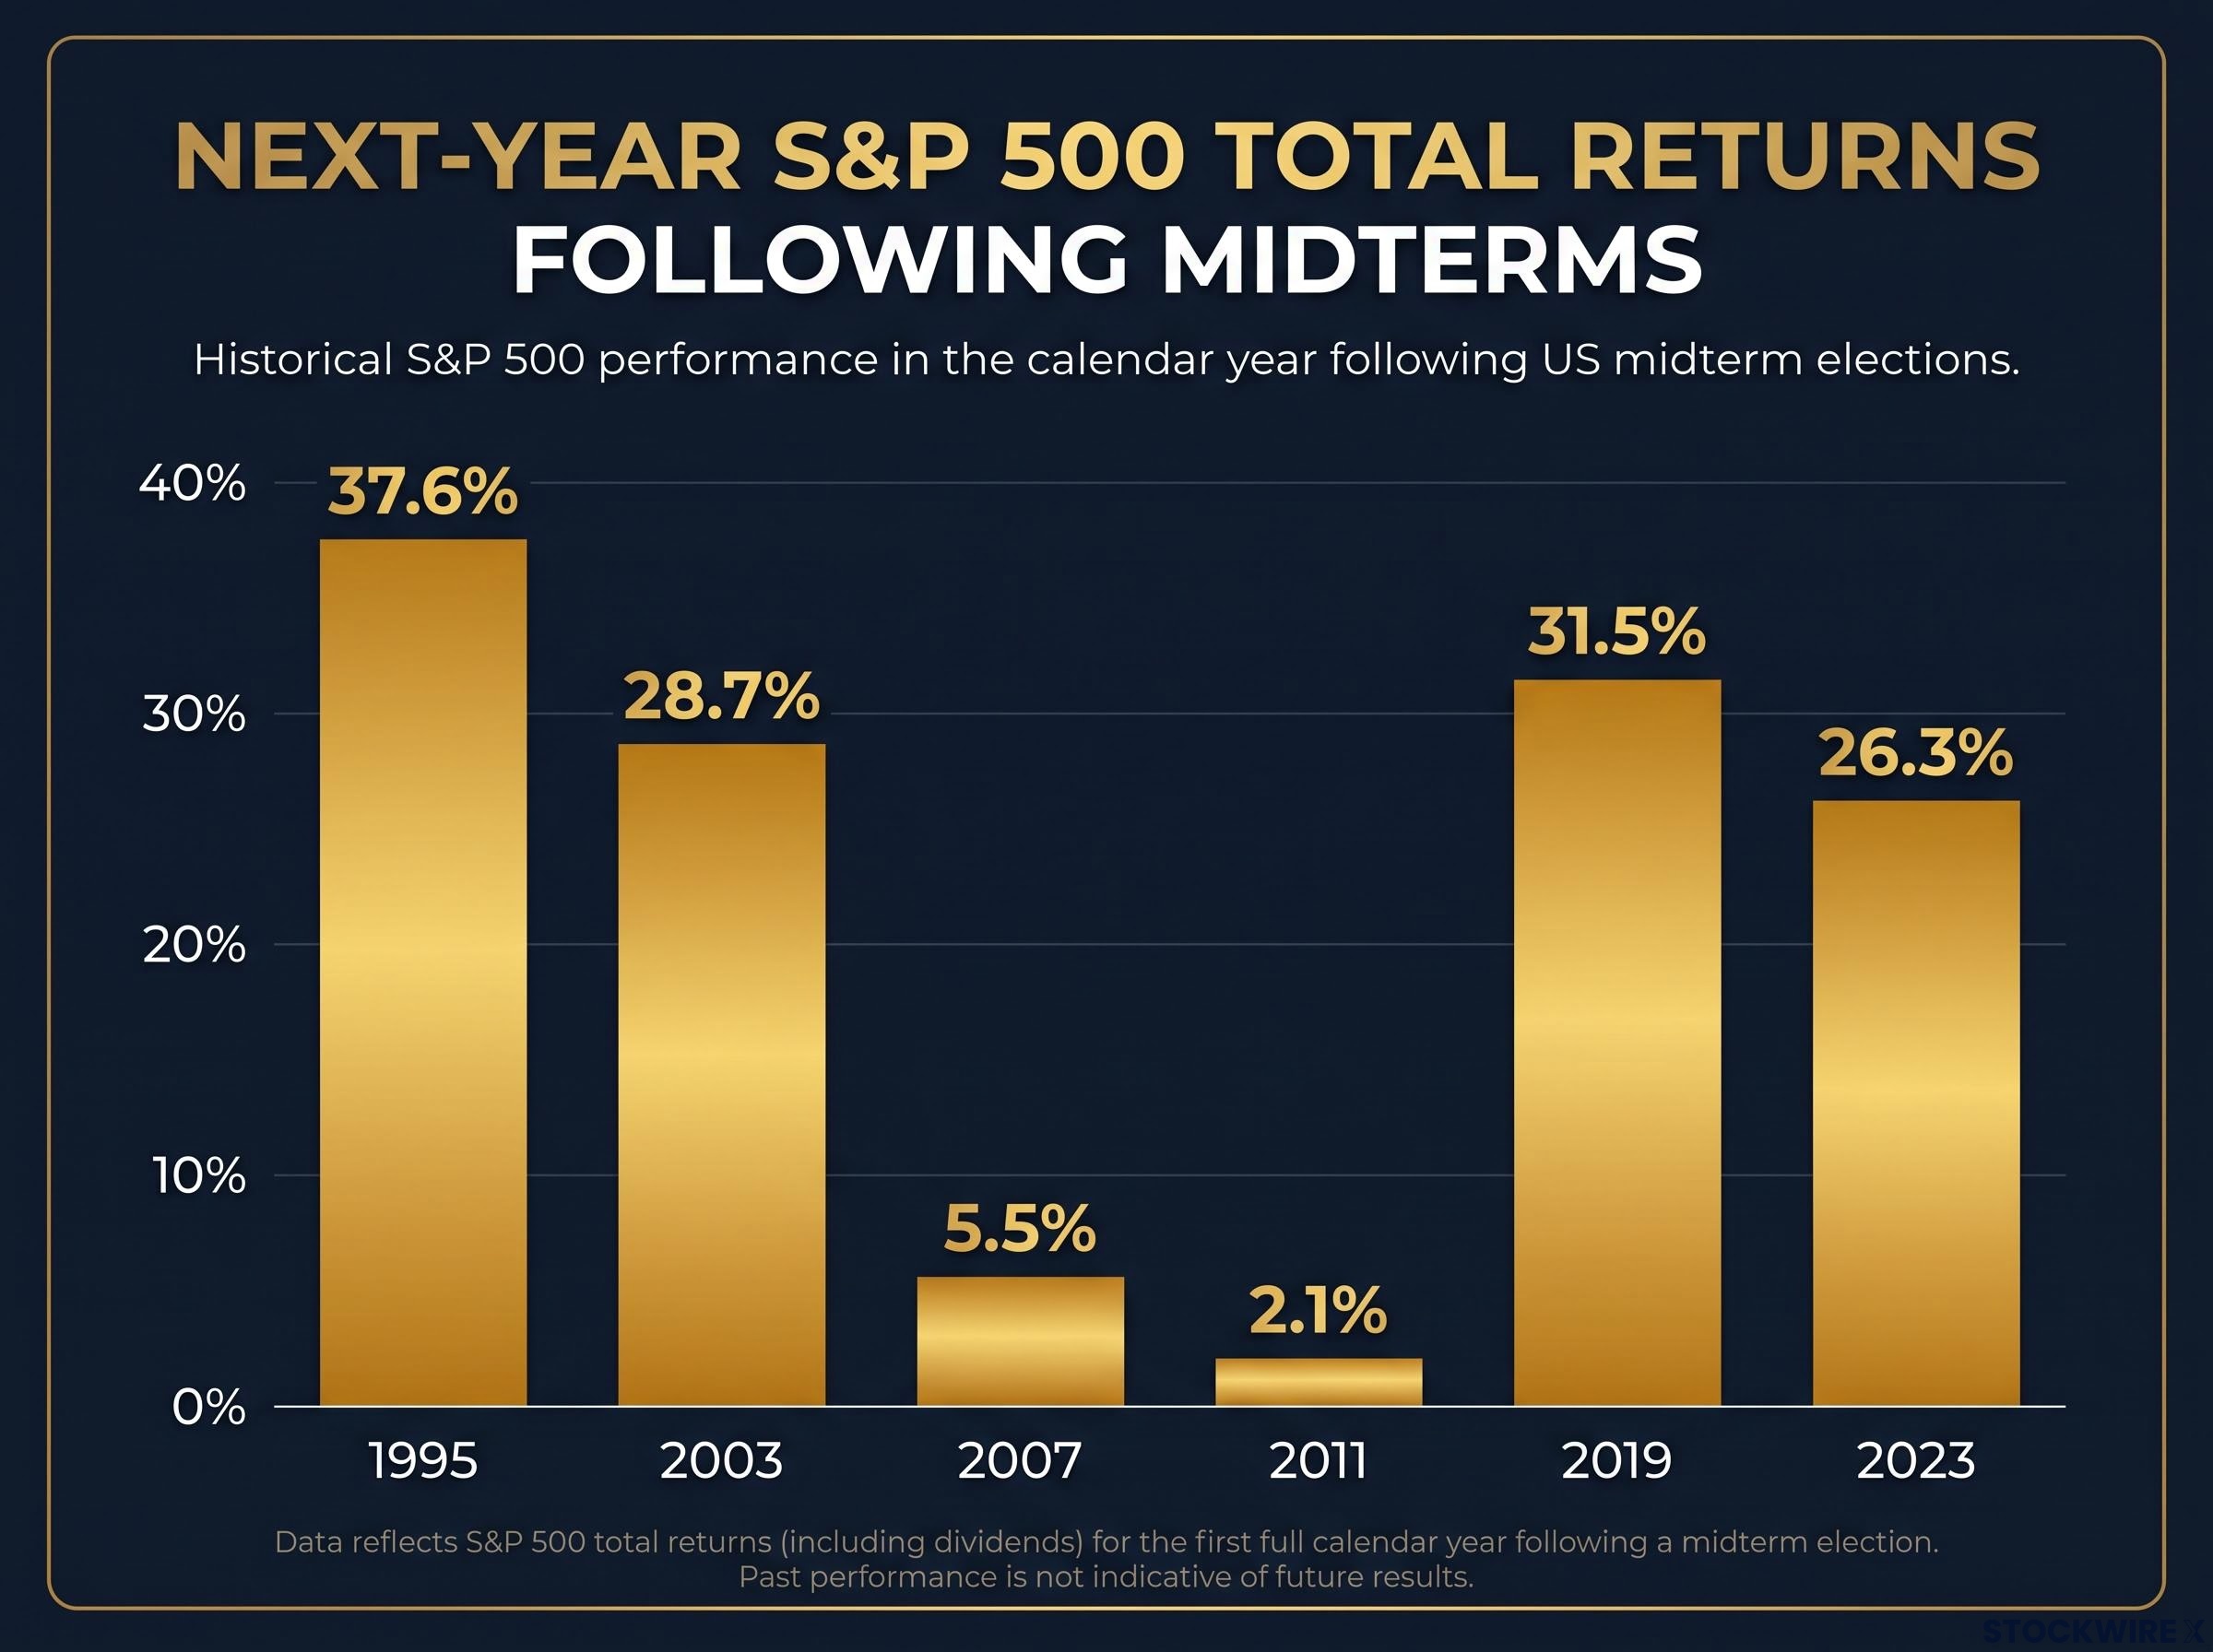
| Midterm | What happened | Next calendar year | Next-year S&P 500 total return |
|---|---|---|---|
| 1994 | Republicans won House and Senate under a Democratic president | 1995 | 37.6% |
| 2002 | Republicans gained in both chambers under a Republican president | 2003 | 28.7% |
| 2006 | Democrats won House and Senate under a Republican president | 2007 | 5.5% |
| 2010 | Republicans took the House under a Democratic president | 2011 | 2.1% |
| 2018 | Democrats won the House under a Republican president | 2019 | 31.5% |
| 2022 | Republicans won the House under a Democratic president | 2023 | 26.3% |
Read down the second column and the winners keep changing: Republicans, then Democrats, then Republicans again. Read down the last column and every figure is positive.
The size of the gain swung widely, from 2.1% to 37.6%. The weakest year, 2011, was shaped by the eurozone debt crisis and the US credit downgrade, not by who held the gavel.
Independent data points the same way
Edward Jones data cited by CBS News shows the S&P 500 rose an average of 1.7% in the month after the last 14 midterms since 1970, and 15.5% over six months. Magdalena Ocampo of Principal Asset Management linked that tendency to election uncertainty receding and attention returning to the economy.
What this tells you is that the market’s direction after a midterm has not depended on which party won. A partisan reaction to the 2026 result has little historical support as an investment signal.
The midterm election cycle has a recognisable seasonal shape: weakness tends to concentrate in the first half of the year, with recovery building from October onward, which helps explain why the post-vote window has so often been rewarding.
When big ASX news breaks, our subscribers know first
How do Congress’s policy changes actually reach your portfolio?
If party labels have not decided outcomes, the natural question is why a new Congress feels so consequential. The instinct is that a change in control means immediate consequences for your holdings.
The reality is slower. Policy shifts reach markets through company earnings, the broader economy and Treasury yields, and each step takes time. MFS argues the impact arrives gradually, which favours research-led analysis of company cash flows and valuations over trading on headlines.
Here are the main channels:
- Fiscal spending: New spending needs legislation, appropriations and agency implementation, often over years, so a change in control alters the probability of spending rather than this quarter’s earnings.
- Taxes: Tax changes affect after-tax profits and investment incentives, but bills must clear both chambers and the president, so divided government lowers the odds of large changes.
- Tariffs and trade: Some tariff authority rests with the executive, while Congress influences funding, oversight and statutory authority.
- Regulation: Rules move through appointments, rulemaking and litigation, hitting specific sectors harder than the broad index.
- Treasury yields and borrowing: Larger deficits or debt-ceiling and shutdown risk can lift yields and compress valuations of long-duration growth stocks (companies whose value rests on profits expected far in the future), while perceived gridlock can push yields lower, as in the initial post-election reaction.
Meanwhile, the economy grew at a 3.4% annualised rate in Q3 2026, according to the Bureau of Economic Analysis (BEA) on 29 October. That growth gives earnings a cushion while Washington debates.
Where sector effects show up first
| Source | Sectors named | Reasoning |
|---|---|---|
| Fidelity | Clean energy, housing, healthcare; AI, data-centre, defence | First group seen as possible beneficiaries of a strong Democratic result; second group faces greater scrutiny |
| J.P. Morgan Asset Management | Healthcare, technology, financials | Election-sensitive sectors, with healthcare possibly benefiting under divided government |
| LPL Financial | Financials, healthcare | Sector-specific headwinds rather than a broad shock |
The election changes the probability of future policy, not current earnings. What matters for a holding is its exposure to specific policies, not the party label attached to Congress.
Political influence on prices also runs through channels beyond Congress, including direct government equity stakes and announcement timing, which hit specific sectors such as semiconductors and critical minerals far harder than the broad index.
Why is positioning around the vote riskier than it looks?
Once the history looks this favourable, trading the result can seem like simple logic. MFS points out the flaw: a positioning trade needs two correct predictions, the outcome and the market’s reaction to it.
The first is harder than it sounds. Goldman Sachs noted on 3 November that prediction markets made the House outcome more predictable than the Senate’s.
The second is harder still. If a Democratic sweep was widely expected, part of the move may have happened before election day, and the 4 November rally still arrived on top of it.
What markets dislike most MFS says investors’ discomfort with not knowing what lies ahead tends to outweigh their concern over any one party’s policy platform.
The historical evidence also carries caveats you should weigh honestly:
- The “21 of 22” statistic rests on very few observations, and one shock can break the pattern.
- Edward Jones figures are averages, not a causal rule.
- The post-midterm year is the third year of the presidential cycle, historically often strong, which makes the two effects hard to separate.
Divided government is not automatically bullish either. CBS quoted an analyst warning that shutdown and debt-ceiling standoffs could push Treasury yields higher. Ed Yardeni of Yardeni Research suggested a Democratic sweep could initially unsettle stocks, but that a major selloff could be a buying opportunity.
When macro overwhelmed the election
In 2011, the eurozone crisis and the US credit downgrade dominated. In 2018, trade tensions and Fed tightening drove a sharp Q4 selloff, and 2022 brought high inflation, aggressive rate hikes, the war in Ukraine and banking stress.
Those 2018 and 2022 declines landed in the election year or just after the vote, before the following calendar-year recoveries shown in the table. The read for you is that a favourable average is a reason for patience, not a trade signal; the dominant economic shock has mattered more than the election statistic.
What should you watch instead of Congress? A disciplined framework
If the vote is a weak signal, the useful question becomes what to do this week. MFS suggests treating the midterms as a prompt to verify that your portfolio is well spread and still matches your long-term objectives.
- Review diversification across sectors, company sizes, geographies and asset classes.
- Rebalance rather than chase the first-day move, which can reflect positioning, short covering and yield changes rather than durable earnings improvement.
- Keep a passive core so you never need to predict which party controls Congress.
- Use active management selectively for policy-sensitive exposures such as healthcare or financials.
- Avoid all-or-nothing election trades built on a single forecast.
- Monitor earnings, rates and growth, the readings that drive returns regardless of the House margin.
What the macro readings say right now
| Indicator | Latest reading | Source and date |
|---|---|---|
| Real GDP | 3.4% annualised, Q3 2026 (advance) | BEA, 29 October 2026 |
| Consumer Price Index (CPI) | +0.6% m/m, 3.7% y/y (September); October due 10 November | BLS, 14 October 2026 |
| Federal-funds target range | 3.75%-4.00% | Federal Reserve, 28 October 2026 |
J.P. Morgan strategists argued on 3-4 November that monetary policy and inflation matter more than the election. Fidelity’s Greg Lowman suggested a balanced Congress may be constructive by limiting major policy swings and political pressure on the Fed, with yields falling and sectors gaining after the result.
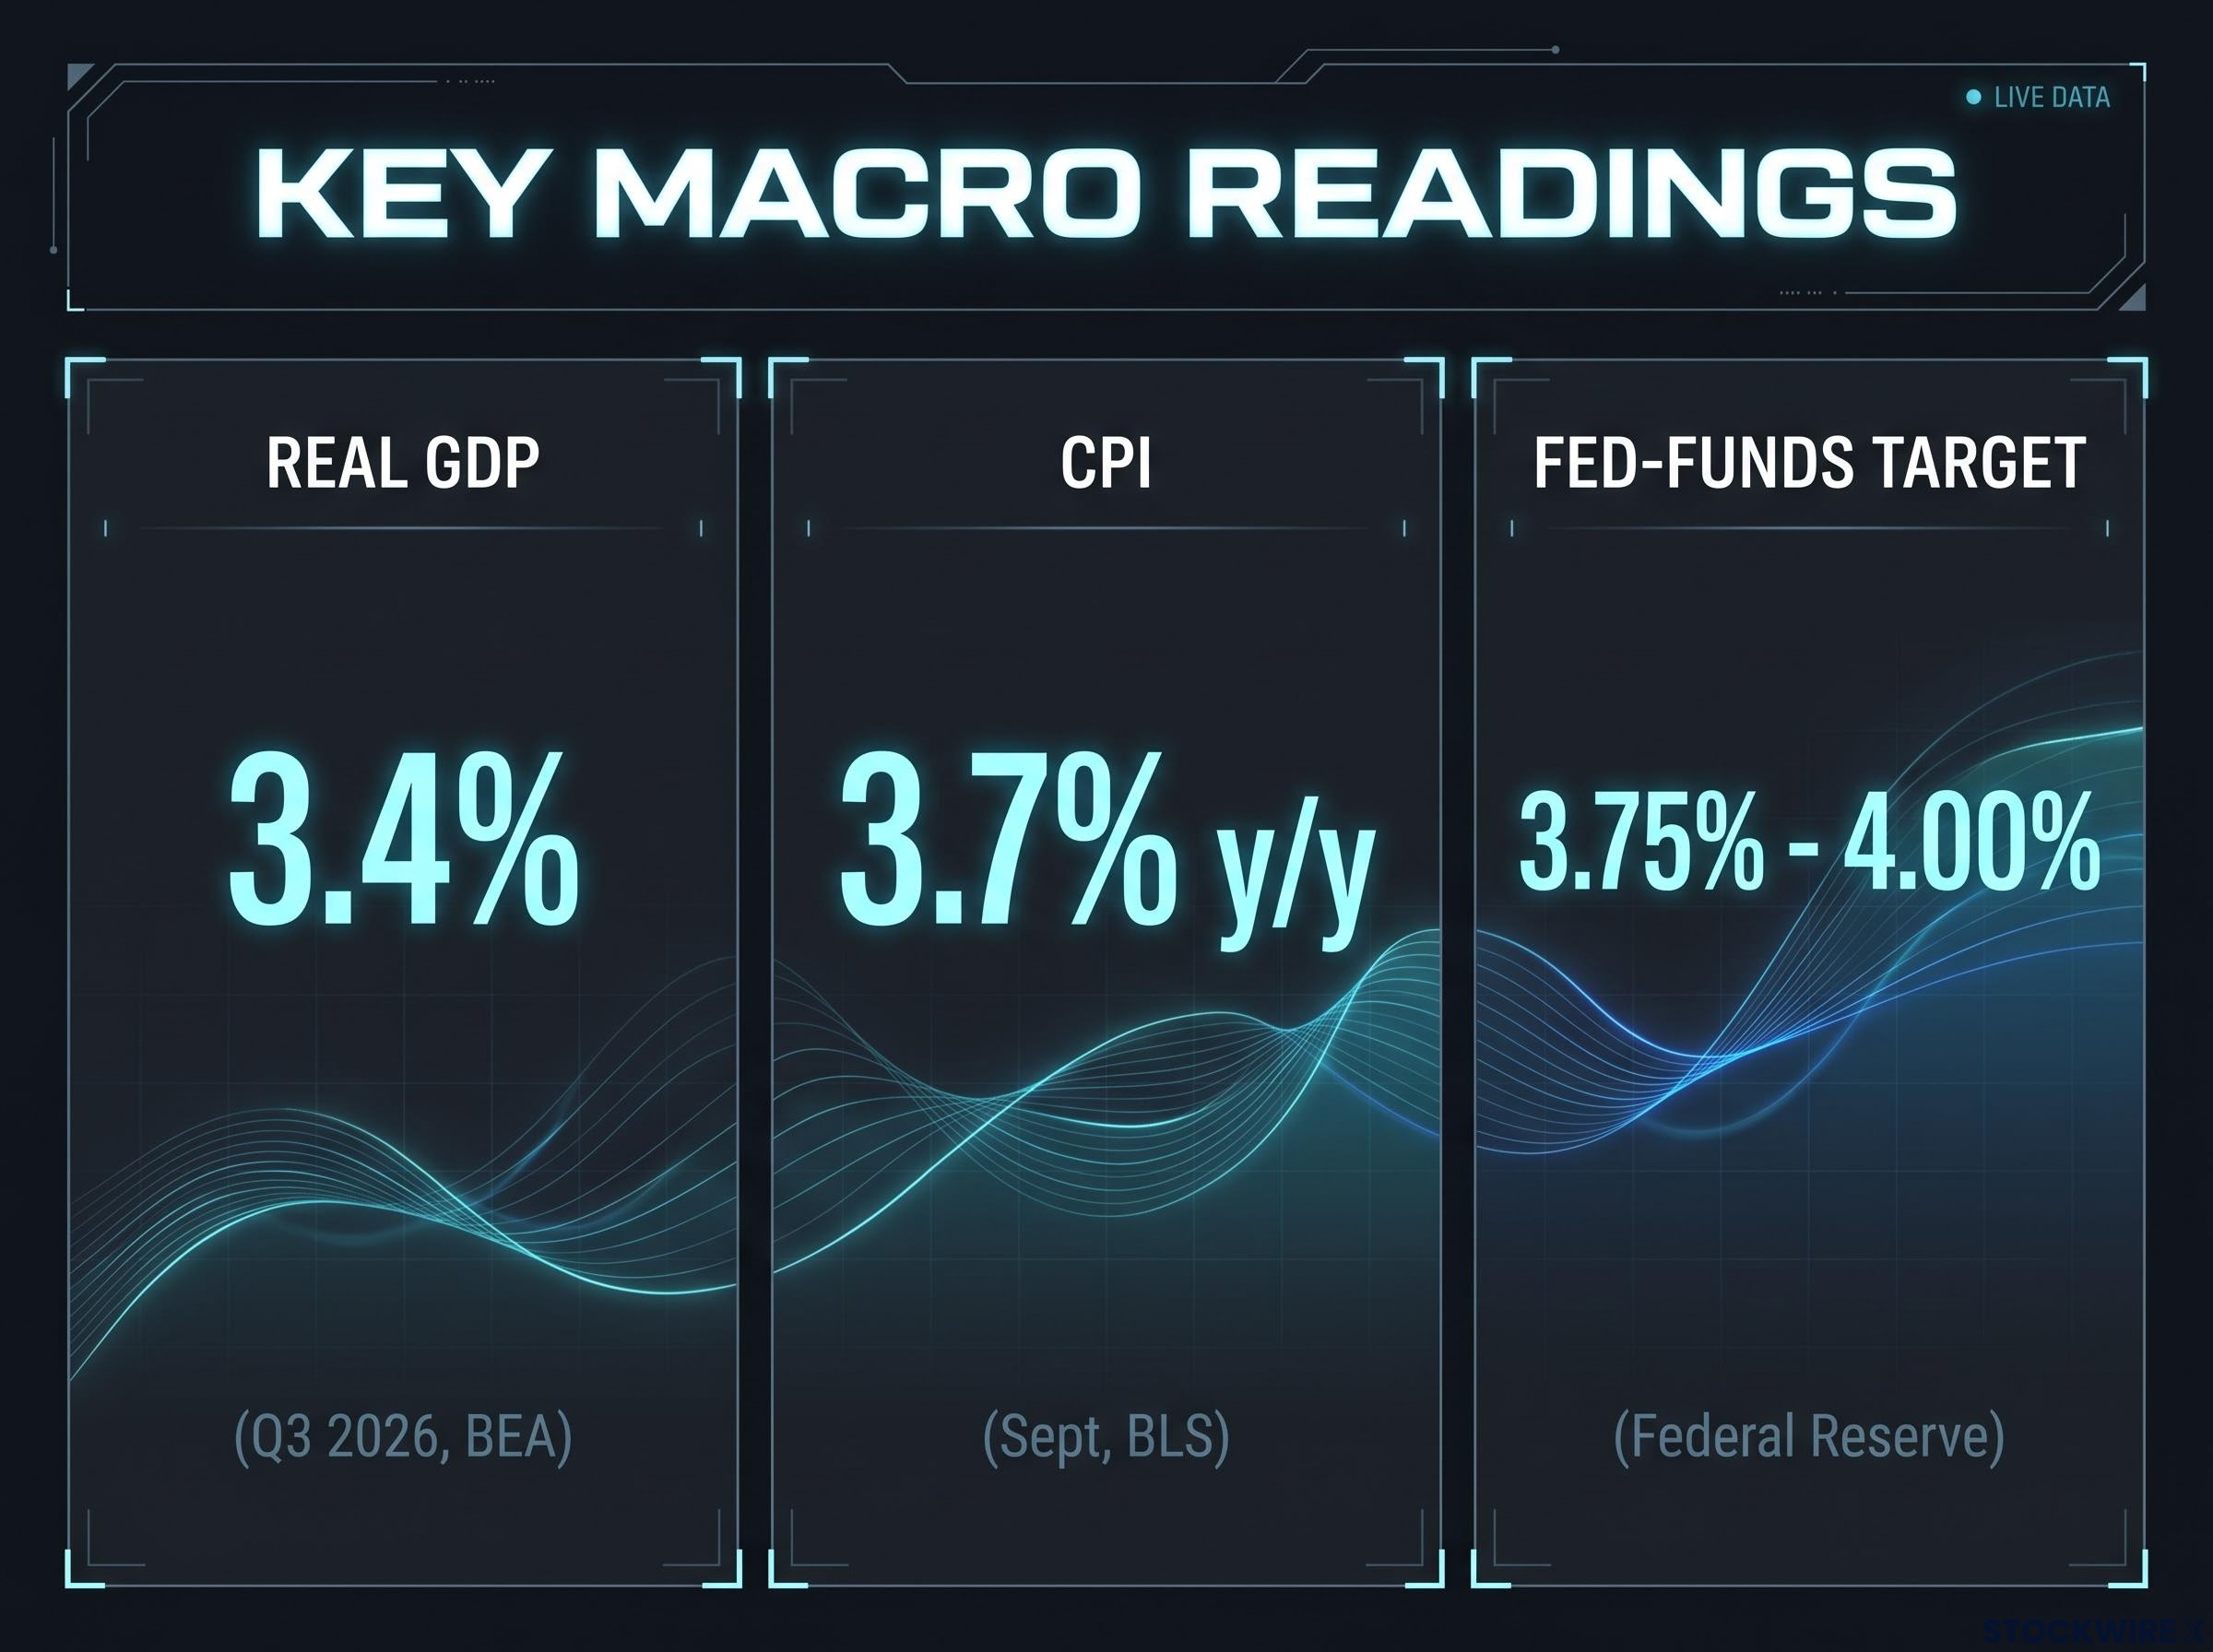
Treat those views as context for the rate backdrop, not forecasts to follow. The rate path and earnings, with October CPI as the next data point, will shape your portfolio more than the House seats still being counted.
The bond market outlook adds a wrinkle to the rate backdrop, because dissent inside the committee and a gap between market pricing and some bank projections leave the path of policy less settled than a steady target range implies.
Why earnings, rates and growth outlast the election result
The Democratic takeover produced a strong first-day rally, probably because investors expected divided government to limit major policy swings. Whether that holds depends on whether congressional conflict actually changes taxes, spending, regulation, trade, deficits, yields, Fed expectations and, ultimately, earnings.
The next inputs are the October CPI release on 10 November and the final House count, both worth folding into your review rather than treating as triggers to trade. Your most useful step now is the one MFS suggests: confirm your portfolio still fits your long-term goals.
This article is for informational purposes only and should not be considered financial advice. Investors should conduct their own research and consult with financial professionals before making investment decisions. Past performance does not guarantee future results.