
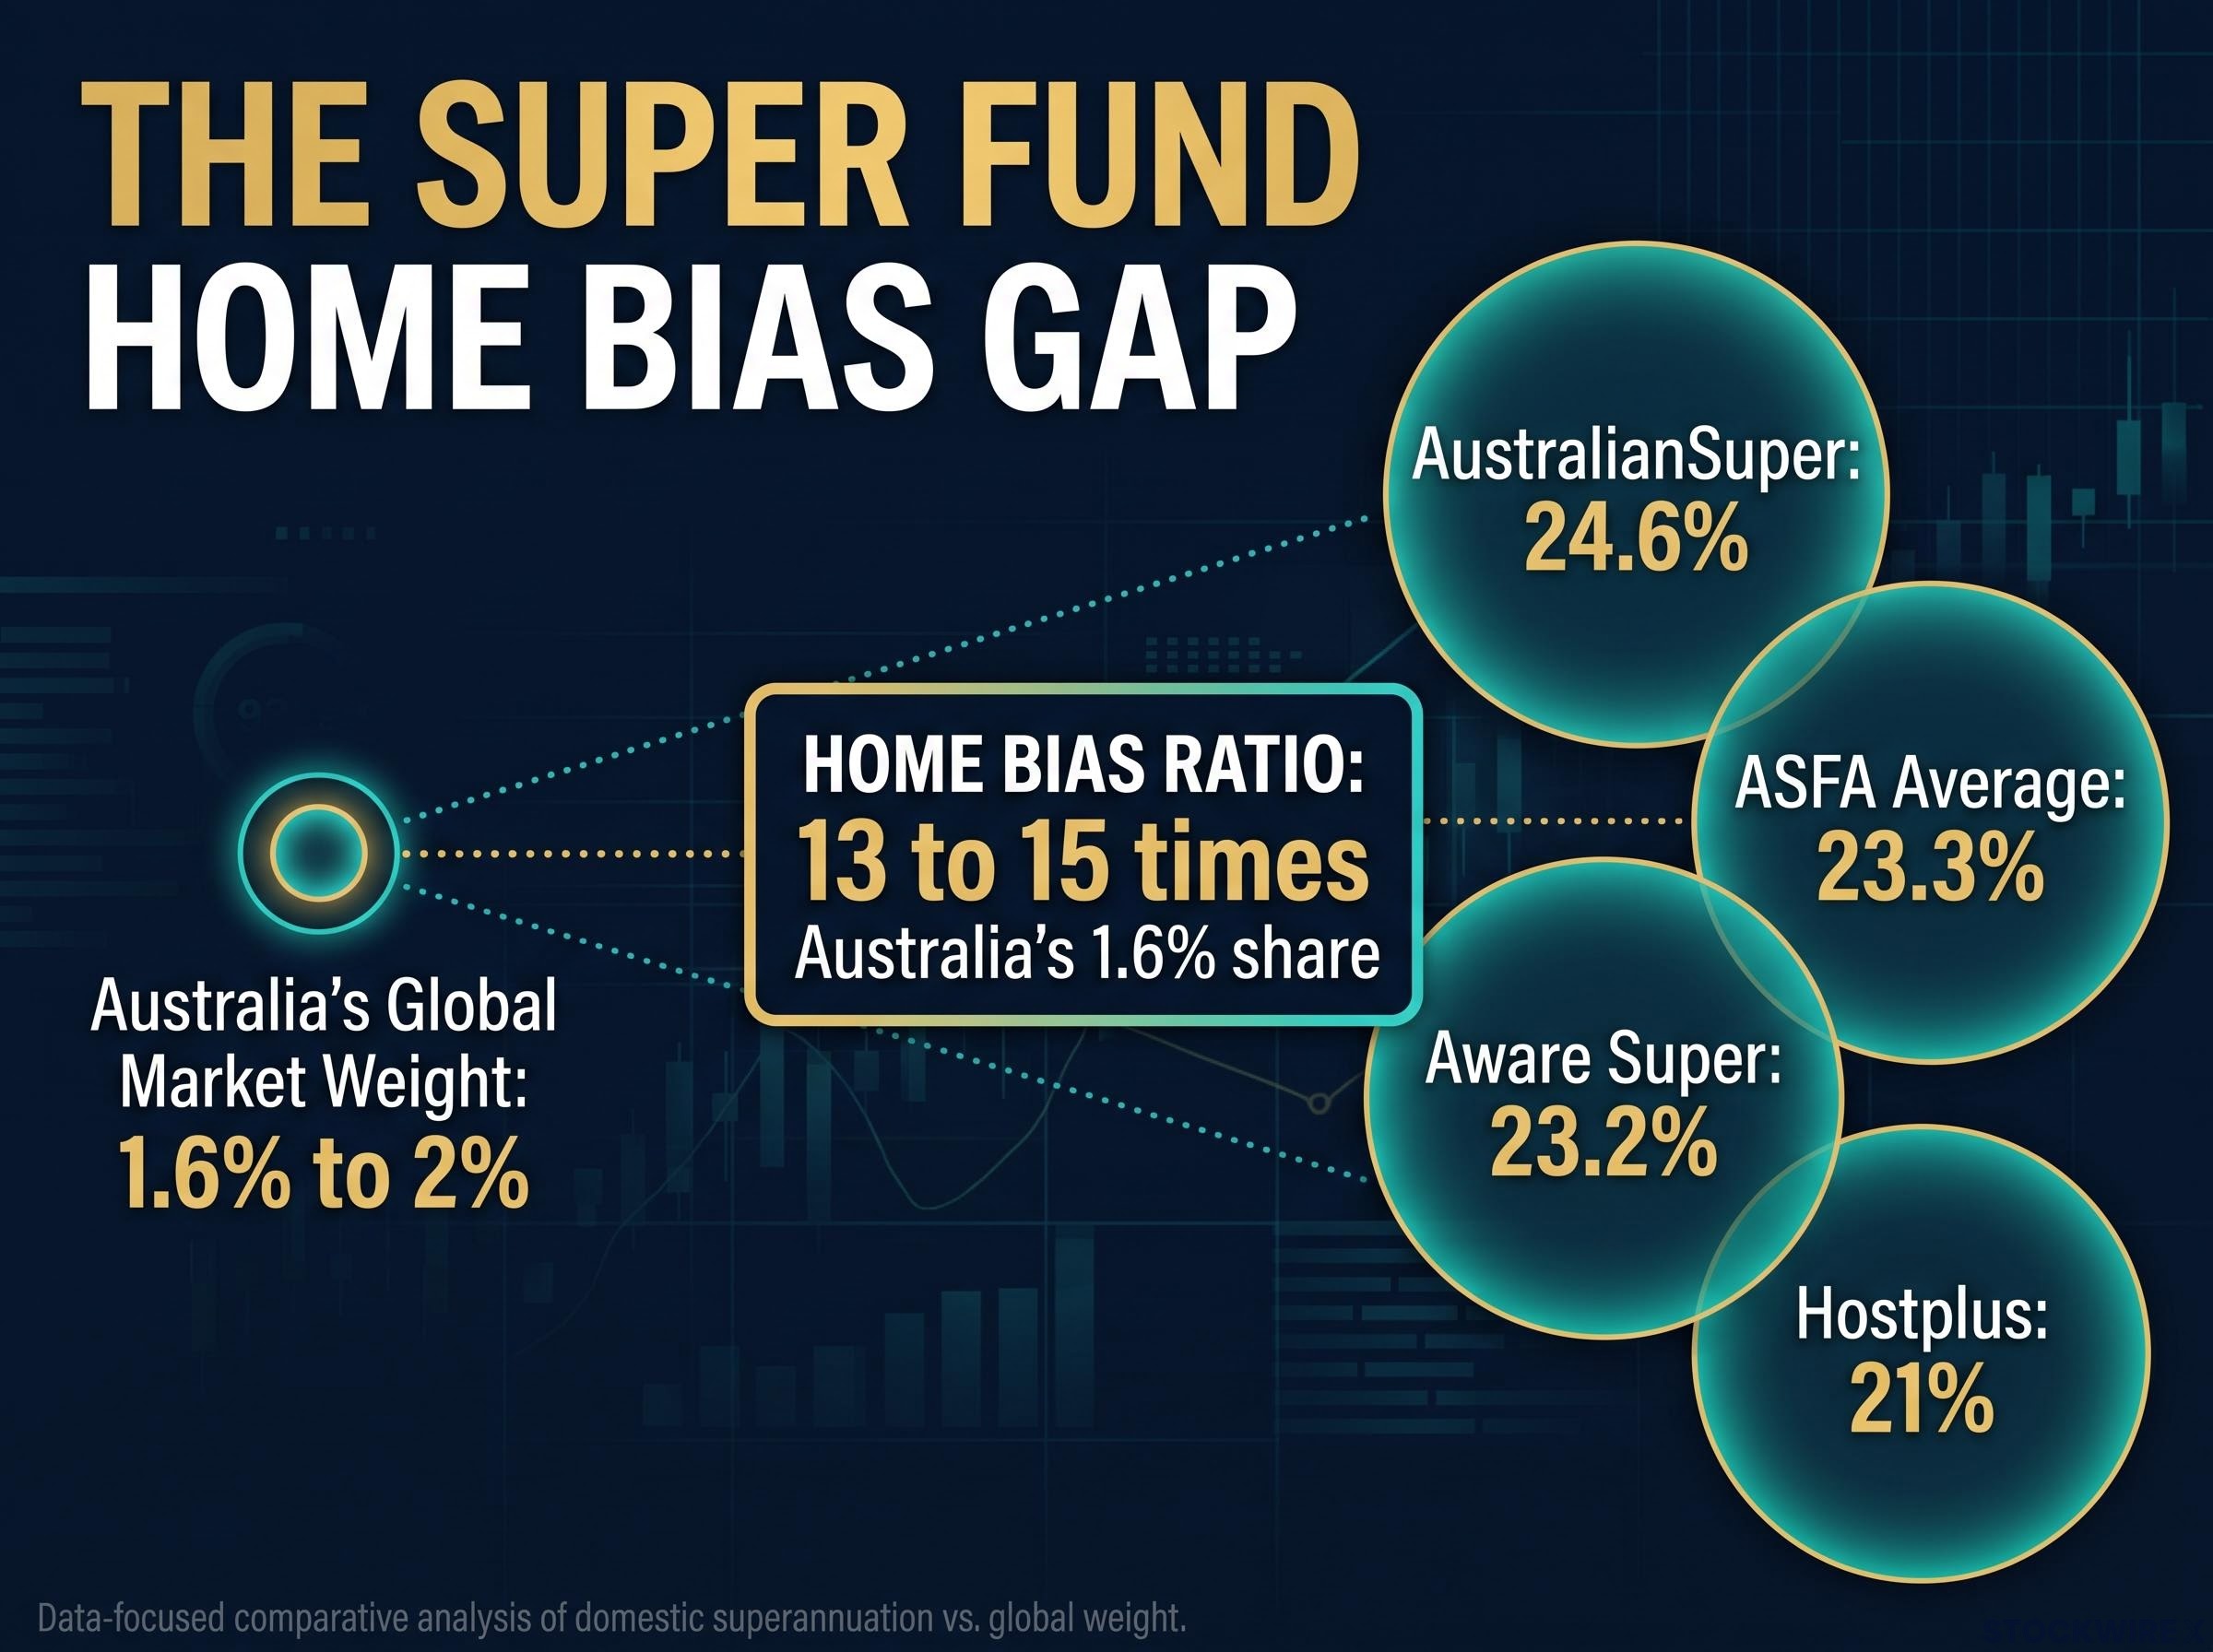
Your super fund’s “balanced” option probably isn’t balanced across the world. Australia makes up roughly 1.6% to 2% of global sharemarkets, yet home bias in super funds means about a quarter of a typical balanced option sits in Australian shares. AustralianSuper’s Balanced option held 24.5% in local shares at 30 June.
The timing makes this worth a closer look. Global equities are trading near record highs, while the S&P/ASX 200 was up just 0.03% for the year at 9 October. On 3 November, the Reserve Bank of Australia (RBA) lifted the cash rate to 4.85%.
If Australian households pull back on spending and borrowing, a large slice of your retirement savings feels it directly.
Here is why the overweight exists, what it concentrates you in, and which questions are worth putting to your fund before its next rebalancing.
How big is the gap between super fund allocations and Australia’s global weight?
Home bias is the tendency to hold more of your own country’s assets than that country’s share of global markets would suggest. A fund with no home bias would hold Australian shares at about their global weight, which is roughly 1.6% on the MSCI ACWI IMI measure, according to Vanguard. The Association of Superannuation Funds of Australia (ASFA) rounds the figure to 2%.
Super funds hold far more than that. ASFA reports that Australian equities made up about 23.3% of super investments at December 2024.
The home bias ratio AustralianSuper, Aware Super and Hostplus target Australian shares at roughly 13-15 times Australia’s 1.6% share of global equity markets.
The pattern holds across the largest funds, so it is not one manager’s quirk.
| Fund option | Australian equities | International equities | Source date |
|---|---|---|---|
| AustralianSuper Balanced/MySuper | 24.6% | 30.65% | Fact sheet effective 1 August 2025 |
| Aware Super Balanced | 23.2% | Not disclosed in sourced material | Updated 27 October 2026 |
| Hostplus Balanced | 21% | 30% (24% developed, 6% emerging) | Updated 5 November 2026 |
AustralianSuper’s figures at 30 June were 24.5% Australian and 32.7% international. The small differences reflect different dates and the gap between actual holdings and strategic targets. Australian Retirement Trust was not documented in enough detail to include.
AustralianSuper’s top ten Australian holdings include:
- Commonwealth Bank
- NAB
- Westpac
- Macquarie
- BHP
- Rio Tinto
“Australian shares” also understates your total domestic exposure, because unlisted assets, property and infrastructure add more on top. In practice, your diversified default is making a large, deliberate bet on one small market.
When big ASX news breaks, our subscribers know first
Why does the overweight persist? Franking, currency, benchmarks and familiarity
None of this is accidental. Each driver behind the overweight makes sense on its own, and together they hold the allocation in place.
Franking and tax efficiency
Franking credits are tax credits attached to dividends from Australian companies that have already paid company tax. They offset tax you would otherwise owe, and they are especially valuable to super funds in low-tax or pension-phase settings.
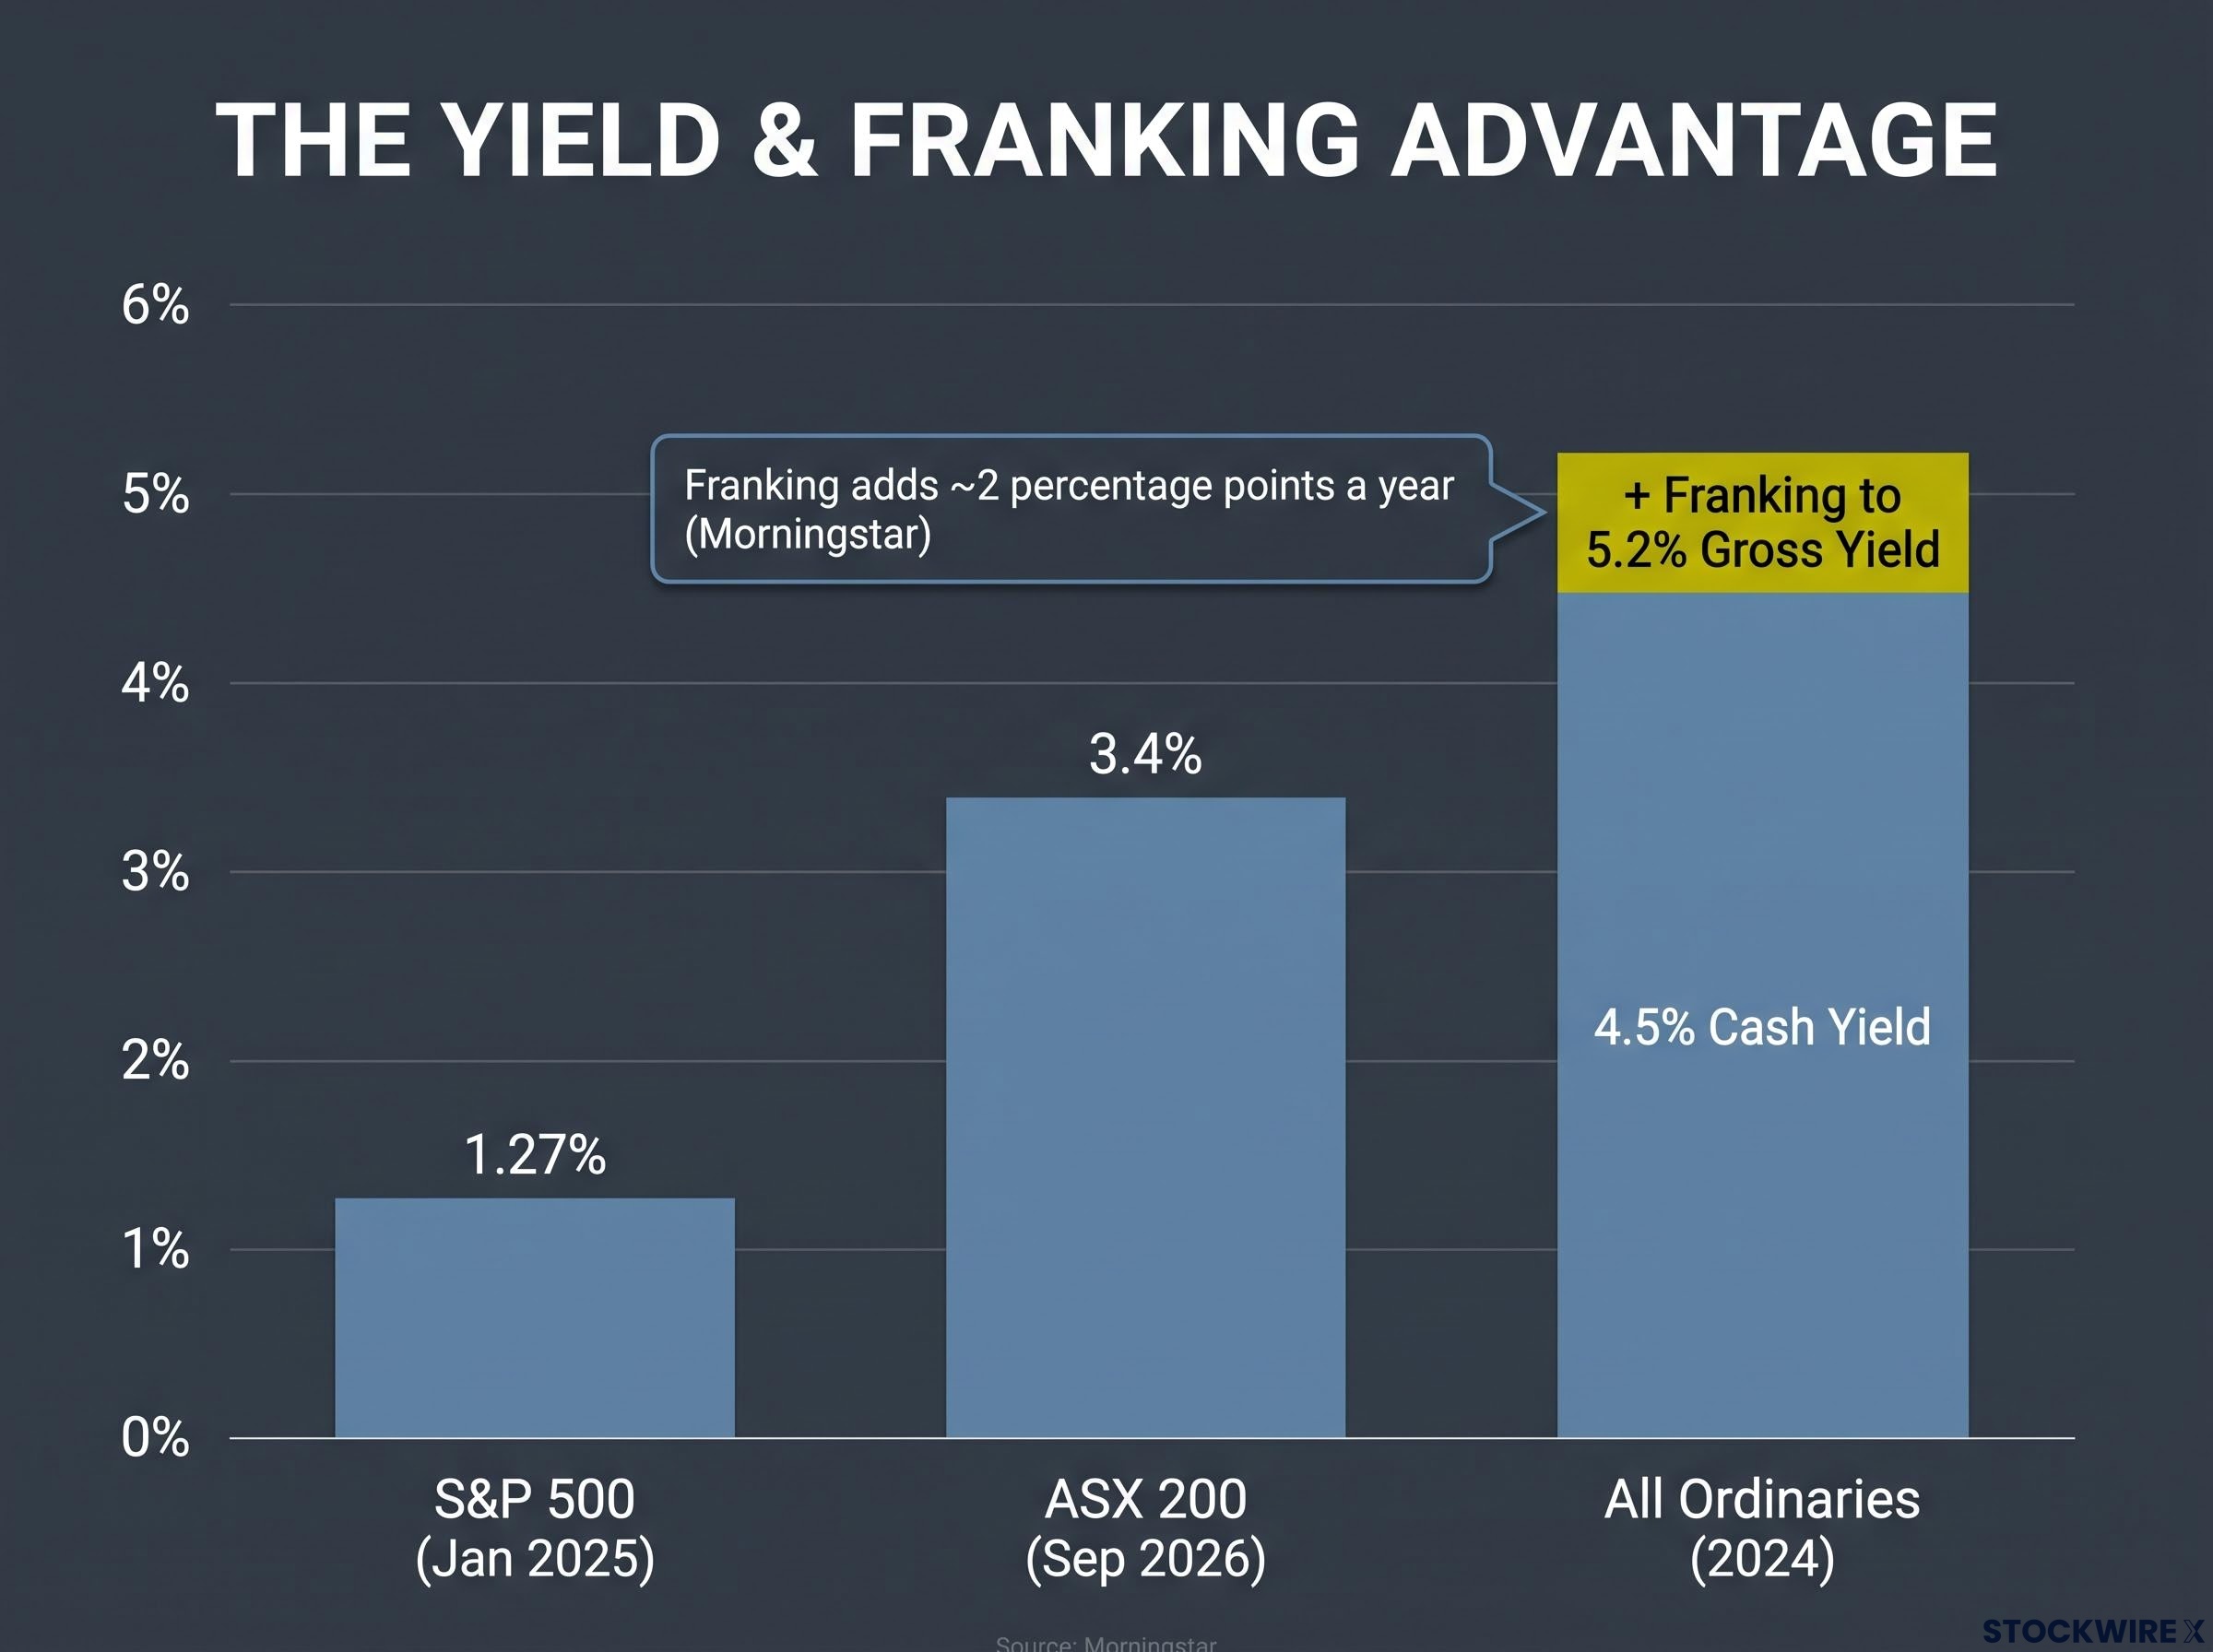
Franking’s contribution Morningstar estimates franking added about 2 percentage points a year to ASX 200 returns, roughly 22% of total return over the period studied.
| Measure | Figure | Date |
|---|---|---|
| ASX 200 dividend yield | 3.4% (10-year average 4.1%) | September 2026 |
| All Ordinaries cash yield | About 4.5% | 2024 |
| All Ordinaries gross yield incl. franking | About 5.2% | 2024 |
| S&P 500 dividend yield | 1.27% | 1 January 2025 |
One commonly cited comparison puts the franked yield at about 4.5% locally against 1.5% offshore. Treat that as directional, because no like-for-like series was located. Franking also lifts your after-tax income without protecting you from falling prices or dividend cuts.
The grossed-up dividend yield adds the franking credit back to the cash payment, which is how a fully franked bank dividend can look materially larger to an eligible investor than the cash figure suggests.
Currency matching
Your super will ultimately pay for spending in Australian dollars. Unhedged foreign assets bring currency swings into your balance. Hedging, which means using contracts to lock in exchange rates, carries costs, counterparty requirements and imperfect timing.
The RBA notes funds already hedge a significant proportion of offshore assets. Domestic shares avoid that complexity entirely.
Benchmark and tracking-error pressure
The Your Future, Your Super performance test has applied to MySuper products since 1 July 2021 and to trustee-directed products since 1 July 2023, using a 10-year horizon. For trustee-directed products, the benchmark is built from the trustee’s own allocation targets reported under SRS 550.0 and set under SPS 530, not from a neutral global portfolio.
That design matters. Cutting Australian shares sharply creates tracking error, meaning returns that drift away from the fund’s own benchmark, and that invites governance scrutiny if the move underperforms.
Familiarity
Local shares trade in local hours, use familiar disclosure rules, have visible liquidity and pay income in Australian dollars. These are behavioural and operational conveniences, not evidence that a quarter of the fund belongs here.
The RBA says tax treatment, the size of the super system and currency management all shape a fund’s neutral allocation. Jeremy Wilmot, principal consultant at JANA, has pointed to a gradual shift toward global equities. For you, that means any rebalancing is likely to be slow.
What does a household-led slowdown do to a portfolio full of banks and retailers?
The ASX is heavily weighted to financials and resources. A domestic-heavy fund therefore takes on bank earnings, housing credit and household spending risk all at once.
The RBA’s latest data shows the pressure building. Housing credit growth was 6.3% on a six-month annualised basis, lower than in August but around its post-GFC average. Household consumption rose 0.4% in the June quarter, year-ended growth slowed to 1.8%, and September-quarter spending looked little changed at a below-trend pace.
After lifting the cash rate 25 basis points to 4.85% on 3 November, the RBA said it expects higher rates, falling housing prices and lower turnover to weigh on consumption. The original source also points to record insolvencies adding to bad-debt pressure on banks.
Net interest margins and bad-debt guidance drive bank earnings far more than headline profit beats, and those signals are what flow through to a fund holding the major banks as its largest domestic positions.
That transmission runs through much of your local equity exposure:
- bank earnings and credit losses
- property and the mortgage cycle
- commodity prices
- China-related demand
- limited exposure to global technology and healthcare
What the performance gap has shown so far
The concentration has already shown up in returns.
Twelve months to the end of May According to Morningstar, Australian shares rose 7% while US shares gained nearly 30%. MSCI World ex Australia was up 14% unhedged and 27% hedged.
The S&P/ASX 200 was down 0.67% over the 12 months to 30 September. Over the 10 years to June 2025, Morningstar found global shares returned about 12.5% a year against 11.1% for Australian shares including franking, with US shares at about 15.5%. Past performance does not guarantee future results.
The Australian dollar sits around 70 US cents, and a weaker dollar modestly flatters unhedged offshore returns. The real risk for you is sector concentration rather than “Australia versus the world”: banks, retailers and property-linked earnings form one correlated bet.
Is the overweight wrong? Trade-offs, hedging and lessons from other markets
The counter-case deserves a fair hearing. Over the 20 years to June 2025, Morningstar found Australian shares with franking were marginally ahead of international shares. Market-cap weights also ignore your tax position and your Australian dollar liabilities.
Morningstar’s broader conclusion is that a mix of domestic and global equities has generally held up better than a strongly domestic portfolio. RBA research material makes a similar point: concentration in financials and mining is a reason to invest overseas, though franking makes home bias likely to persist.
Hedging is the second lever.
| Approach | Benefit | Cost | Best suited when |
|---|---|---|---|
| Unhedged | Natural diversifier when the AUD falls | Adds volatility when the AUD rises | You want a buffer against domestic weakness |
| Fully hedged | Lower volatility, matches AUD liabilities | Forgoes gains from a falling AUD, adds hedging and counterparty costs | Currency stability is the priority |
| Partially hedged | Balances both outcomes | Adds a strategic decision and benchmark-relative risk | You want a middle path |
Yield is not return either. High payouts may reflect payout ratios and sector mix rather than growth, and dividends can be cut.
Lessons from Canada and Japan
Canada is the closest analogue: a small, resource-heavy market where investors have historically held outsized domestic allocations. Japan offers a caution, where prolonged equity underperformance showed the cost of letting familiarity and legacy benchmarks override diversification. No current statistics were found for either market.
The evidence points to a question of how much and how hedged, not whether to hold Australian shares at all. Commentator Matt Sainsbury suggests investment committees consider whether a quarter of the fund ought to be set up around the economy the RBA is aiming for, instead of the one shareholders would favour, and he notes that Robertson is signalling a holding pattern rather than a change of direction.
Questions you can put to your fund:
- How is the Australian share weight sized? Ask whether it reflects franking and liabilities or simply the benchmark.
- What is the hedging policy? Ask what share of offshore assets is hedged and why.
- How concentrated is the domestic portfolio? Ask what portion sits in banks and resources.
- How is household risk assessed? Ask whether the fund stress-tests for a consumer-led slowdown.
What members and committees should weigh before the next rebalancing
The overweight is structural. Franking, Australian dollar liabilities and self-referencing benchmarks keep it in place, yet it leaves you concentrated in banks and resources tied to household conditions.
The variables to watch are clear: the RBA’s next rate decisions, housing credit growth, quarterly consumption data and where the Australian dollar settles around 70 US cents. Each one feeds directly into the earnings that dominate your domestic holdings.
Your next step is practical. Check your option’s Australian share allocation and hedging policy in its product disclosure documents, then compare it against the figures above. This is general information only, not personal advice.
This article is for informational purposes only and should not be considered financial advice. Investors should conduct their own research and consult with financial professionals before making investment decisions.