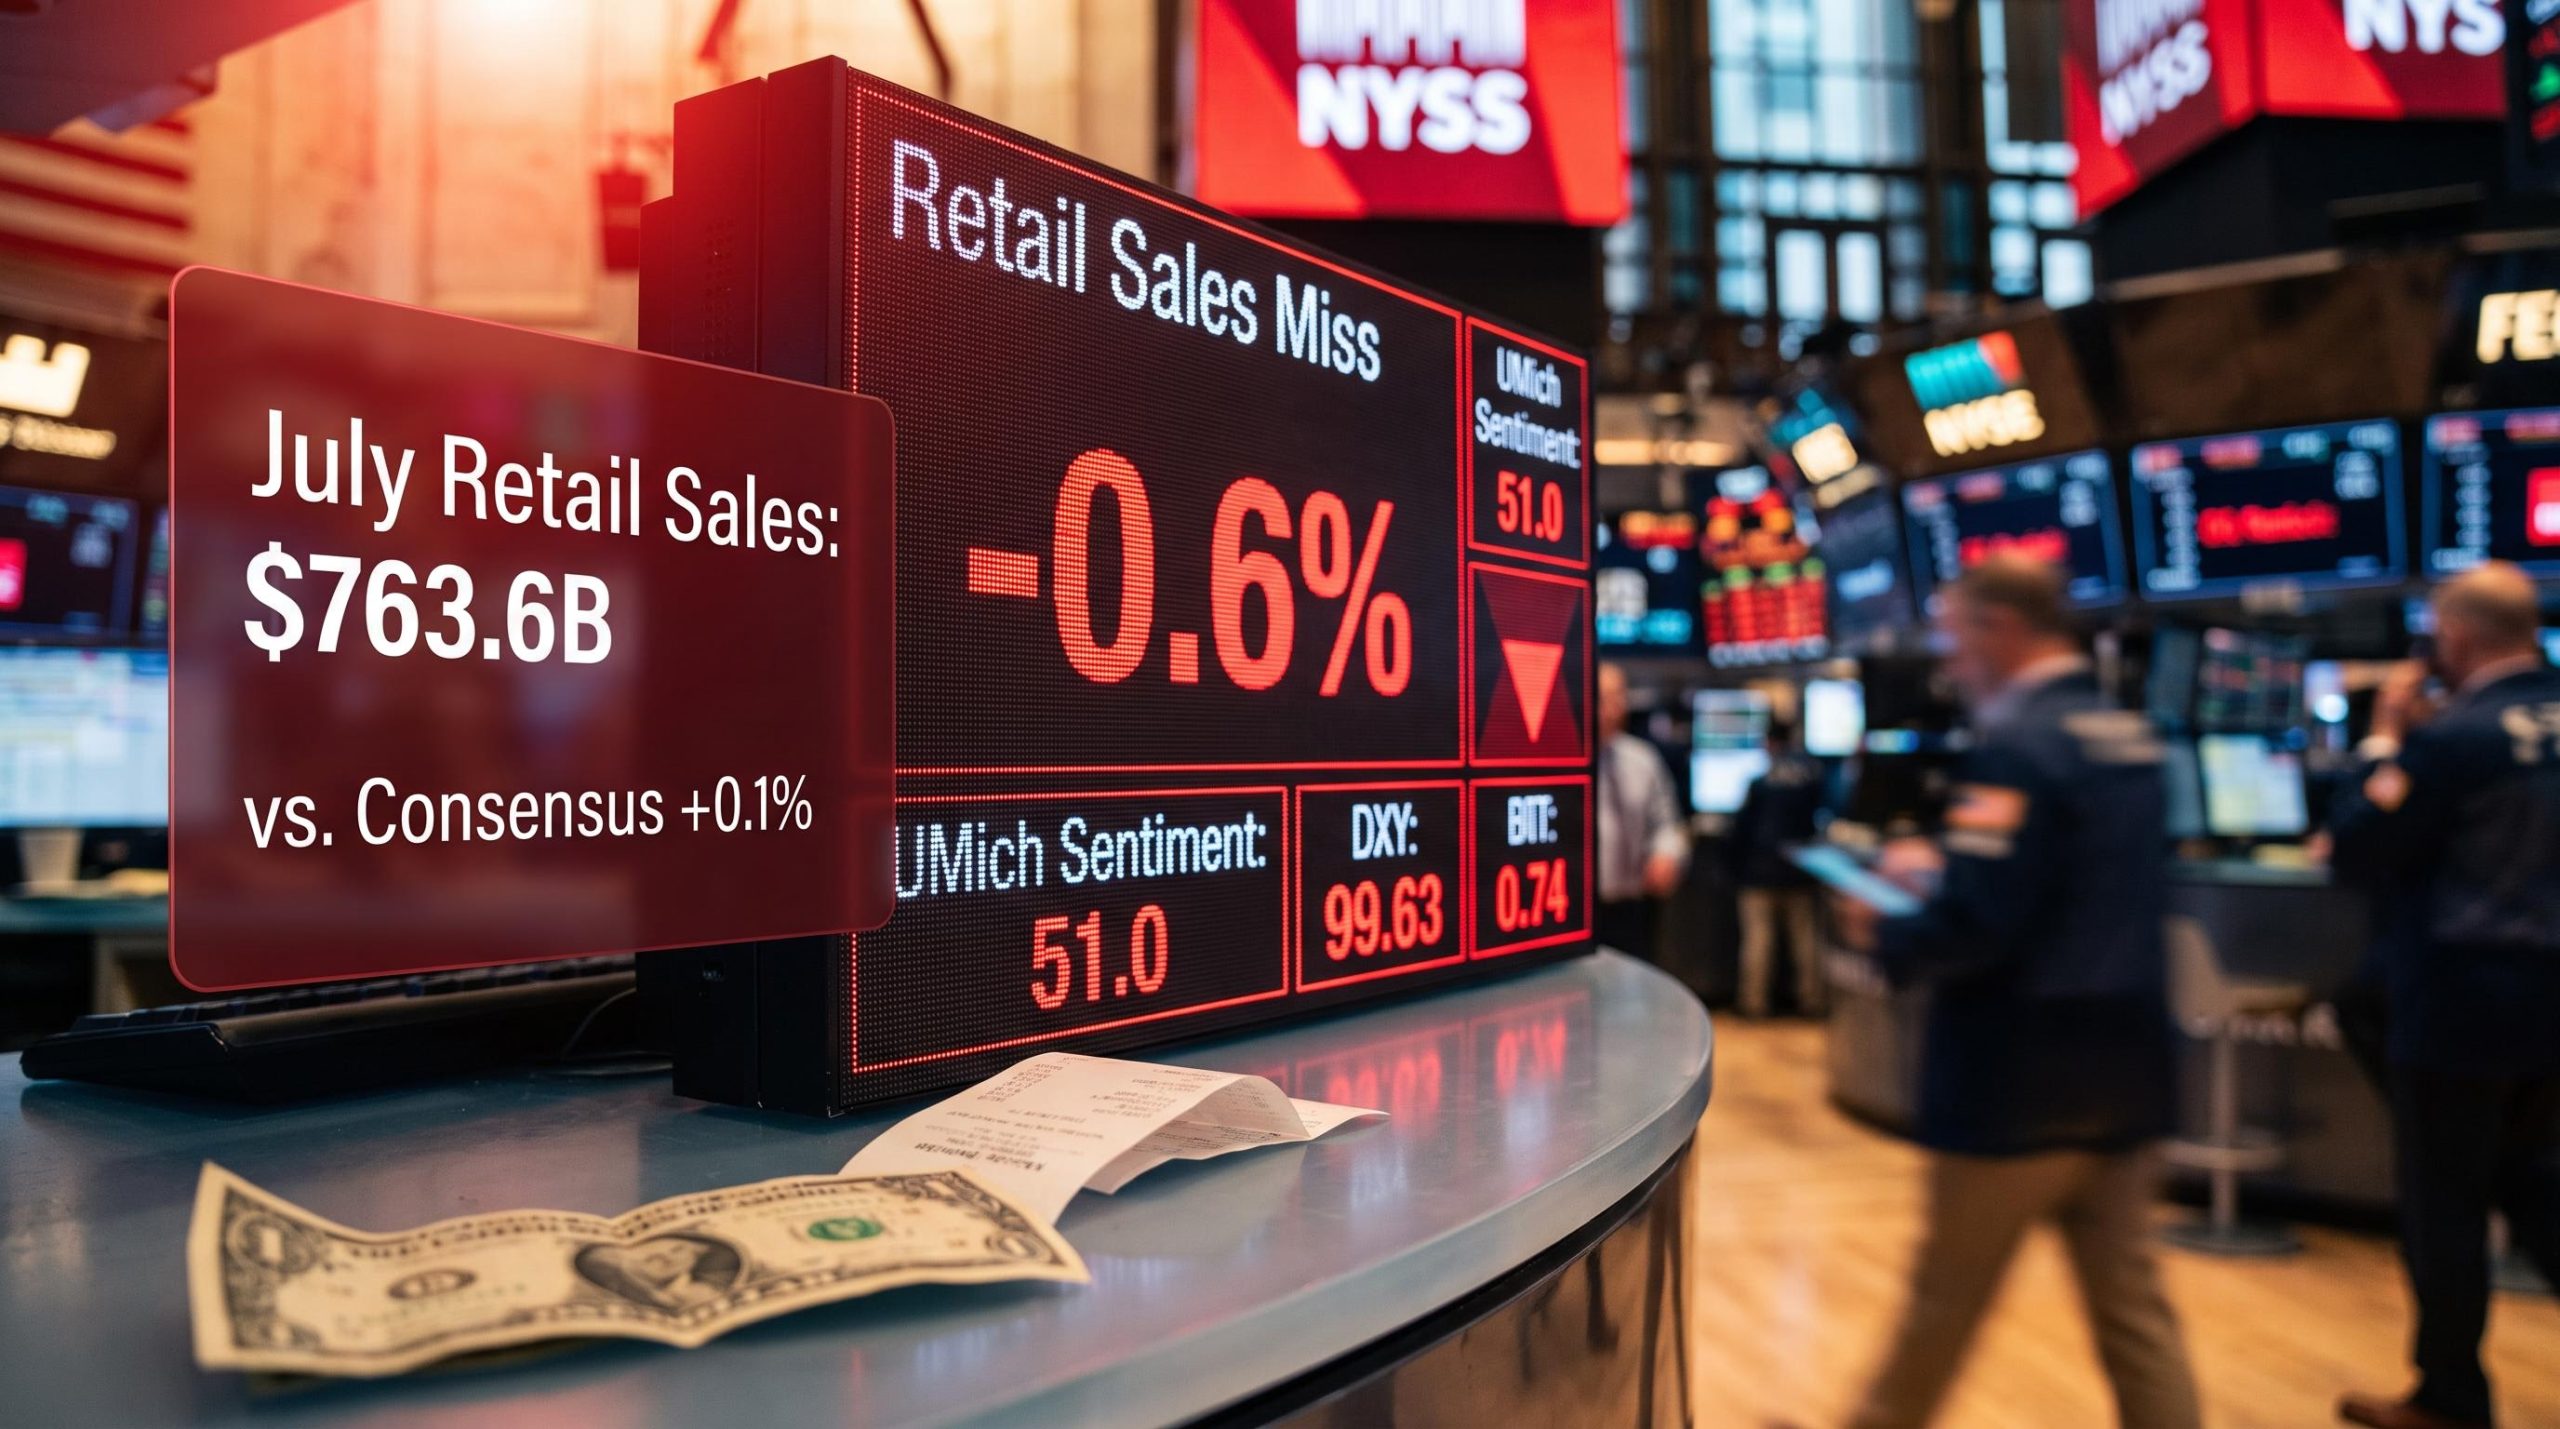
US retail sales fell 0.6% in July, the worst monthly print in over a year, missing analyst forecasts of +0.1% by the widest margin in recent memory. Markets moved immediately: the dollar dropped, front-end Treasury yields dipped, and rate-cut expectations shifted at the margin. But the reasons behind the number are more complicated than the headline suggests.
Two closely watched data points landed on the same day. The Census Bureau retail sales miss arrived alongside the University of Michigan Consumer Sentiment Index, which dropped sharply to 51.0 from 55.2 in July. Together they built a narrative of a consumer losing momentum, even if the arithmetic behind the spending figure contains real distortions that inflate its apparent weakness.
Here is what the data actually shows, and what it means for the dollar, Treasury yields, and the Fed’s rate path going into year-end.
A 0.6% drop that is not quite what it looks like
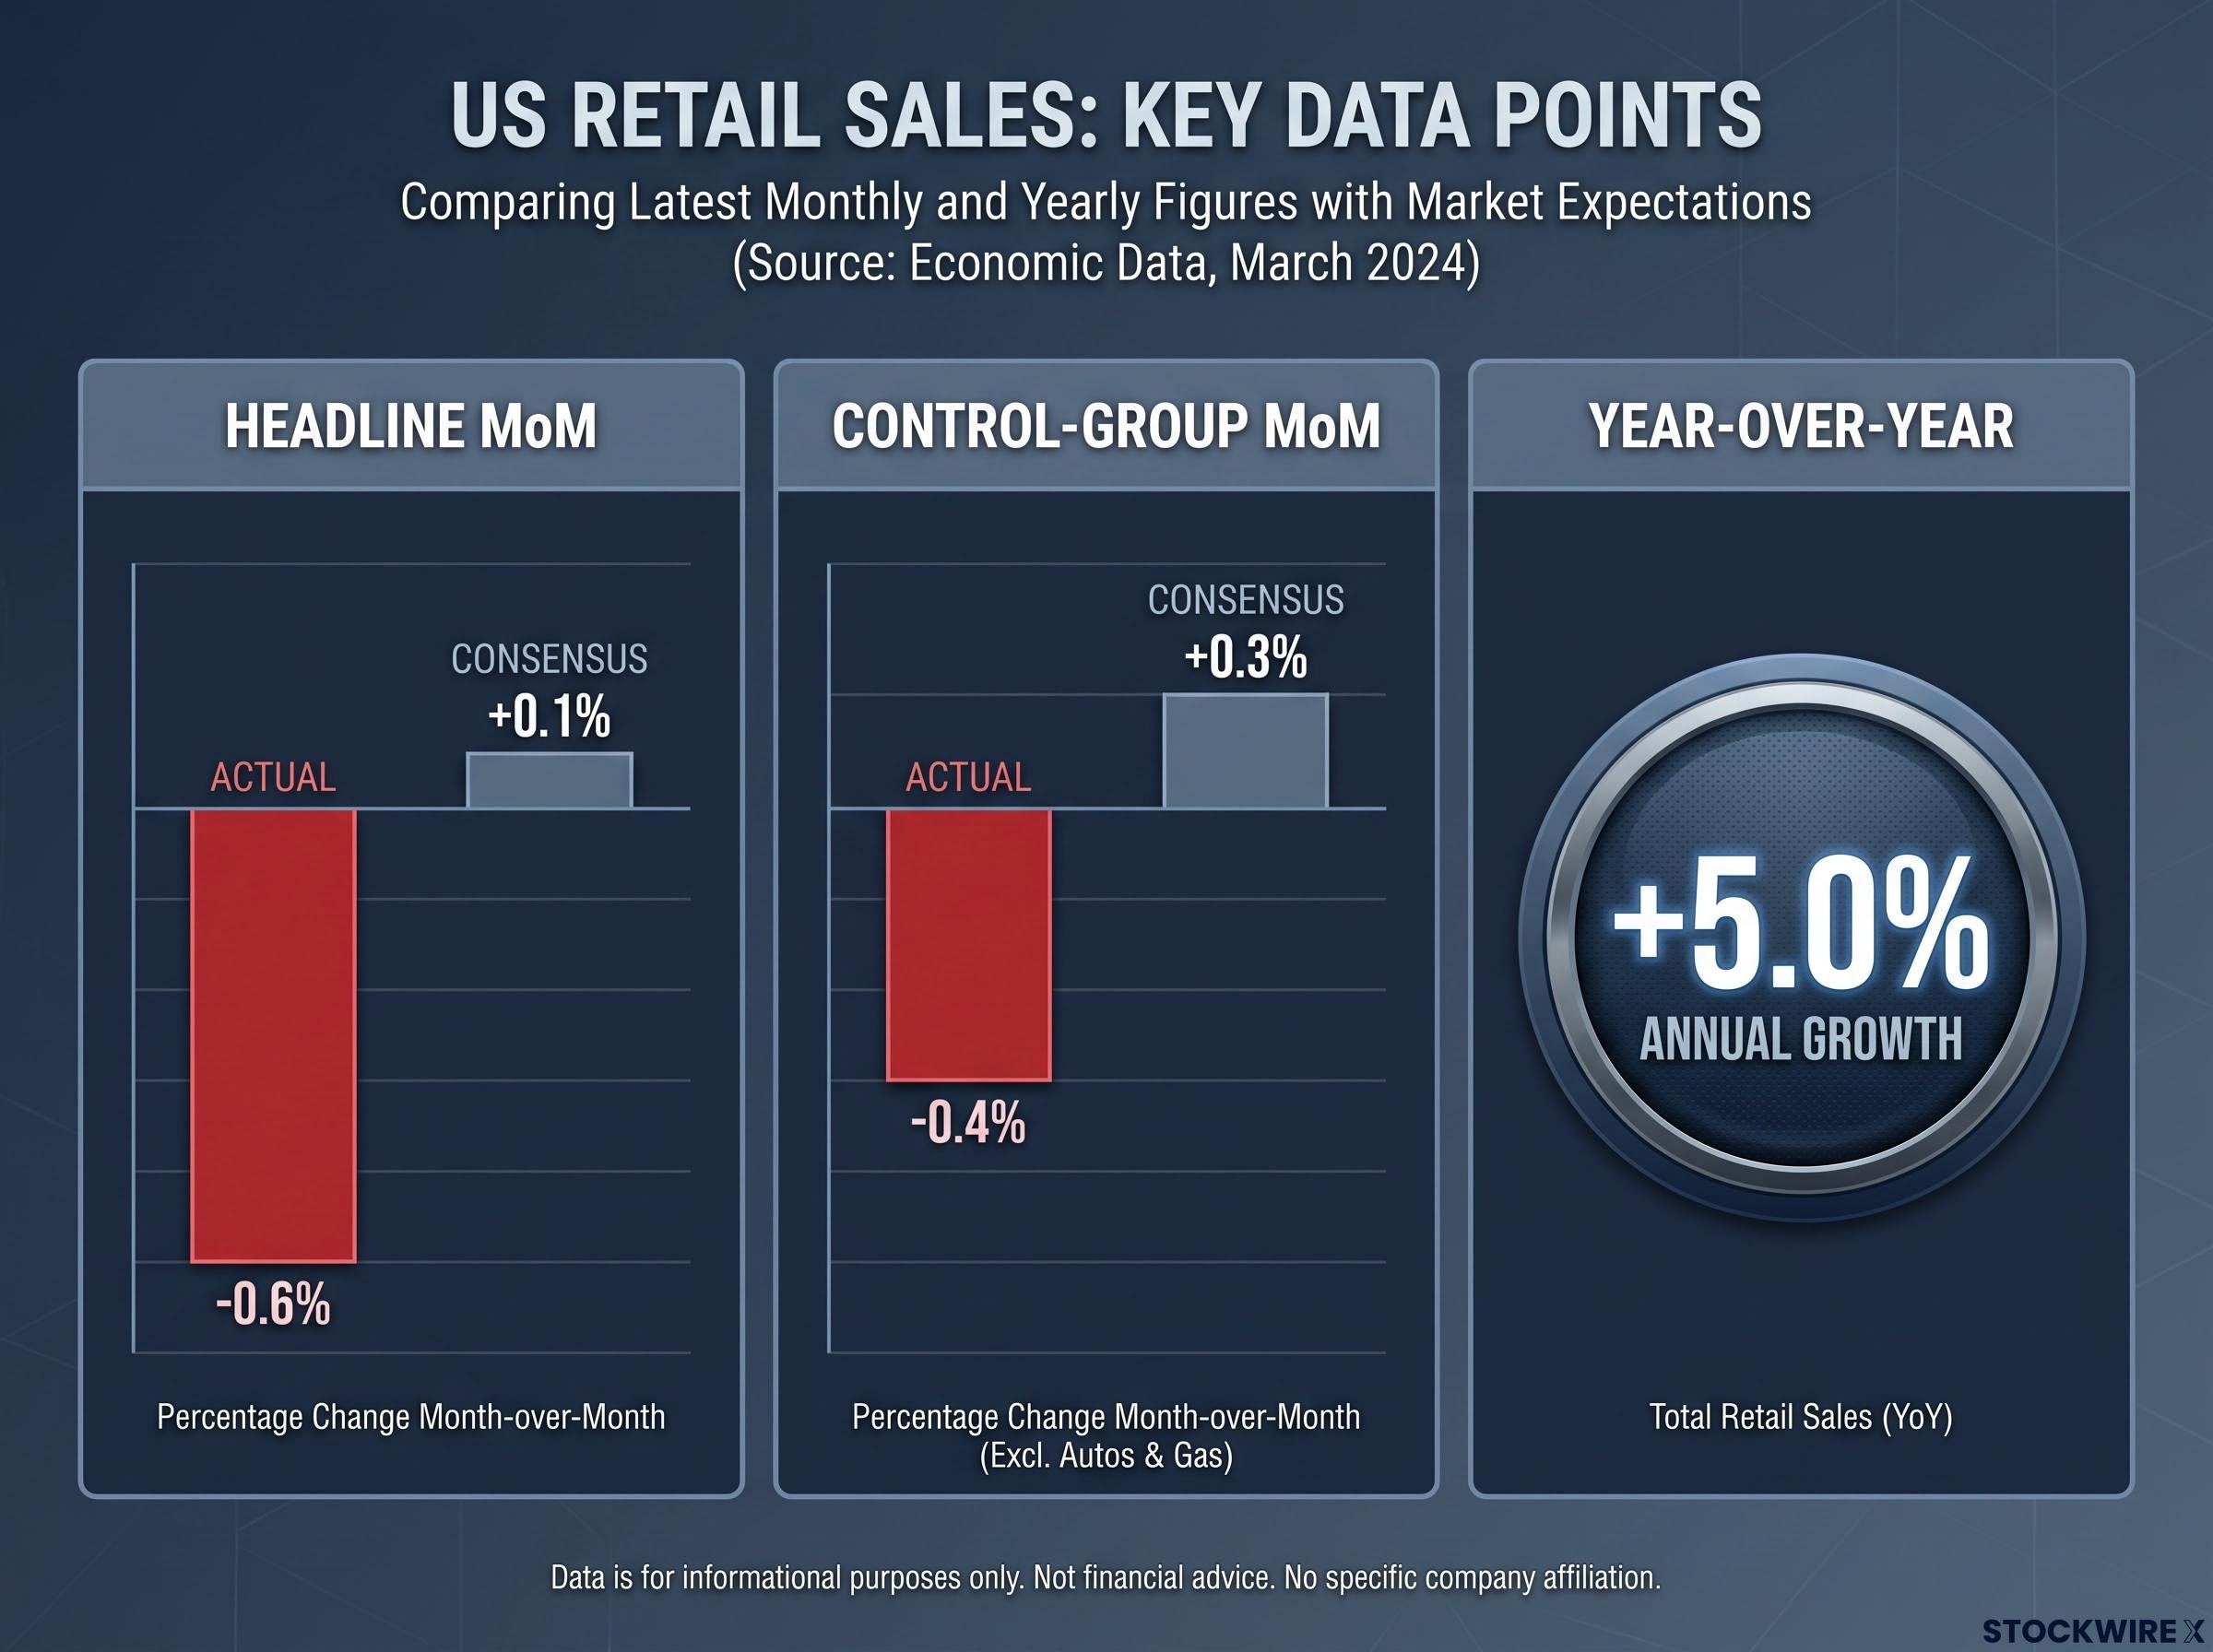
The headline is genuinely bad. July retail and food services sales came in at $763.6 billion, down 0.6% month-over-month against a consensus forecast of +0.1%. That is a miss large enough to move markets on its own.
The control-group measure, which strips out autos, gasoline, and building materials to show underlying consumer demand, fell 0.4% against expectations of +0.3%. That confirmed the weakness was not confined to a single volatile category. June’s figure was revised upward to +0.2%, setting the monthly comparison from a slightly higher base.
The Census Bureau Monthly Retail Trade Survey is the primary source for the headline and control-group figures, with its methodology stripping building materials, autos, and gasoline from the control measure to isolate underlying consumer demand.
But here is the tension worth sitting with: year-over-year, retail spending is still growing at +5.0%. The gap between a -0.6% monthly print and a +5.0% annual growth rate is where the real story lives. The monthly number is real, but distorted. Knowing the difference is what separates a reactive read from an informed one.
The interpretive discipline required for reading economic releases without overreacting applies directly here: advance estimates carry average absolute revisions of roughly 0.6 percentage points, and the gap between a bad monthly print and the longer trend is standard operating procedure for macroeconomic data rather than a signal requiring immediate repositioning.
| Metric | July 2026 | Consensus |
|---|---|---|
| Headline MoM | -0.6% | +0.1% |
| Control-group MoM | -0.4% | +0.3% |
| Year-over-year | +5.0% | |
| June revised | +0.2% |
When big ASX news breaks, our subscribers know first
Why Prime Day and cheap gasoline made July look worse than it was
Two distortions did measurable damage to the headline, and both are mechanical rather than behavioural.
- Amazon Prime Day calendar shift. Prime Day promotional activity occurred in June this year rather than July, pulling a wave of online spending into the earlier month. Household demand did not necessarily fall; the timing of a major promotional event redistributed spending between months. This effect is expected to reverse in August and September data.
- Falling gasoline prices. Lower pump prices reduced nominal fuel receipts without reducing physical consumption. Households drove the same number of miles but paid less per litre, which cuts the headline figure even as real purchasing power improved. This distortion also fades in subsequent reports as the base effect normalises.
Both factors are temporary. Neither reflects a structural shift in consumer behaviour.
The gasoline distortion is not new to this cycle. June’s headline retail figure similarly understated consumer spending resilience because lower pump prices suppressed gas-station receipts, with the underlying ex-petrol measure advancing 0.7% that month, a pattern that recurred in July and reinforces the case for looking past the headline.
Year-over-year retail growth: +5.0%. That figure sits beneath the monthly noise and tells a different story about the consumer’s actual spending trajectory.
For anyone watching this data as a signal about consumer health, the practical implication is straightforward: August retail sales deserve more weight than July’s as a genuine read on demand momentum.
How one retail print moves the dollar and Treasury markets
What the dollar move tells you
DXY, the index that gauges the dollar’s value against a basket of six major currencies, declined more than 0.31% on the session to settle at 99.63. The mechanism is direct: a weaker-than-expected demand print lowers expectations for US growth and rate paths relative to other economies, which reduces the dollar’s carry and growth premium.
DXY: 99.63, down over 0.31% on the session.
But the weekly performance remained approximately flat. That detail matters. Professional currency markets are treating this miss as incremental evidence of cooling rather than a regime change, which is the calibration that counts for anyone watching the dollar’s directional trend.
What happened at the front end of the yield curve
At two years, the Treasury maturity most closely tied to where the Federal Reserve sets rates in the near term, tends to rally (yield falls) when demand data surprise to the downside and rate-cut odds increase at the margin. With both the headline and the control-group measures weaker than forecast, the data supported a modest bid in front-end Treasuries.
Longer maturities are less directly affected. Year-over-year spending growth remains positive at +5.0%, and the broader growth picture has not deteriorated enough to compress the long end meaningfully. The action, for now, is concentrated where Fed policy expectations live: at the front of the curve.
How economic data like retail sales shapes Fed thinking
The Federal Reserve uses consumption data as one of several inputs when assessing economic momentum. It does not look at retail sales in isolation. The typical data checklist runs in roughly this order:
- Spending and demand data (retail sales, personal consumption expenditures)
- Employment data (nonfarm payrolls, jobless claims, wage growth)
- Inflation data (CPI, PCE price index)
- Financial conditions (credit spreads, equity markets, lending standards)
When the Fed describes itself as “data-dependent,” it means it is looking for patterns across multiple releases before adjusting its rate path. A single miss, especially one with known calendar and price distortions, does not mechanically trigger a rate cut. It nudges the balance of probabilities.
FOMC dissent dynamics matter to how this data lands inside the committee: three officials voted for an immediate hike on 29 July 2026, meaning today’s softer demand print arrives at a moment when the hawkish bloc needs only two more votes to command a majority, a context that shapes how much weight any single dovish data point can actually carry.
The control-group retail sales measure is often more closely watched than the headline precisely because it strips out the most volatile and price-sensitive categories. It is designed to show underlying consumer demand, and it fell 0.4% against expectations of a 0.3% gain. That is a genuine disappointment, but one data point in a longer sequence.
Money market pricing and the CME FedWatch tool currently assign approximately a 63% probability that the Fed holds rates steady at the December 2026 FOMC meeting. That probability is the market’s current read of how much signal the Fed is extracting from this data, and for anyone trying to anticipate policy, it is more useful than the retail sales number itself.
Stable longer-term inflation expectations in the University of Michigan survey give the Fed room to respond to demand weakness without being forced to defend its inflation credibility simultaneously. That flexibility matters more than it sounds.
This article is for informational purposes only and should not be considered financial advice. Investors should conduct their own research and consult with financial professionals before making investment decisions.
Consumer sentiment adds a harder signal to a noisy release
The preliminary August reading of the University of Michigan Consumer Sentiment Index came in at 51.0, retreating from 55.2 the prior month, reversing two consecutive months of gains and falling short of consensus expectations. That is a drop of 4.2 points in a single month.
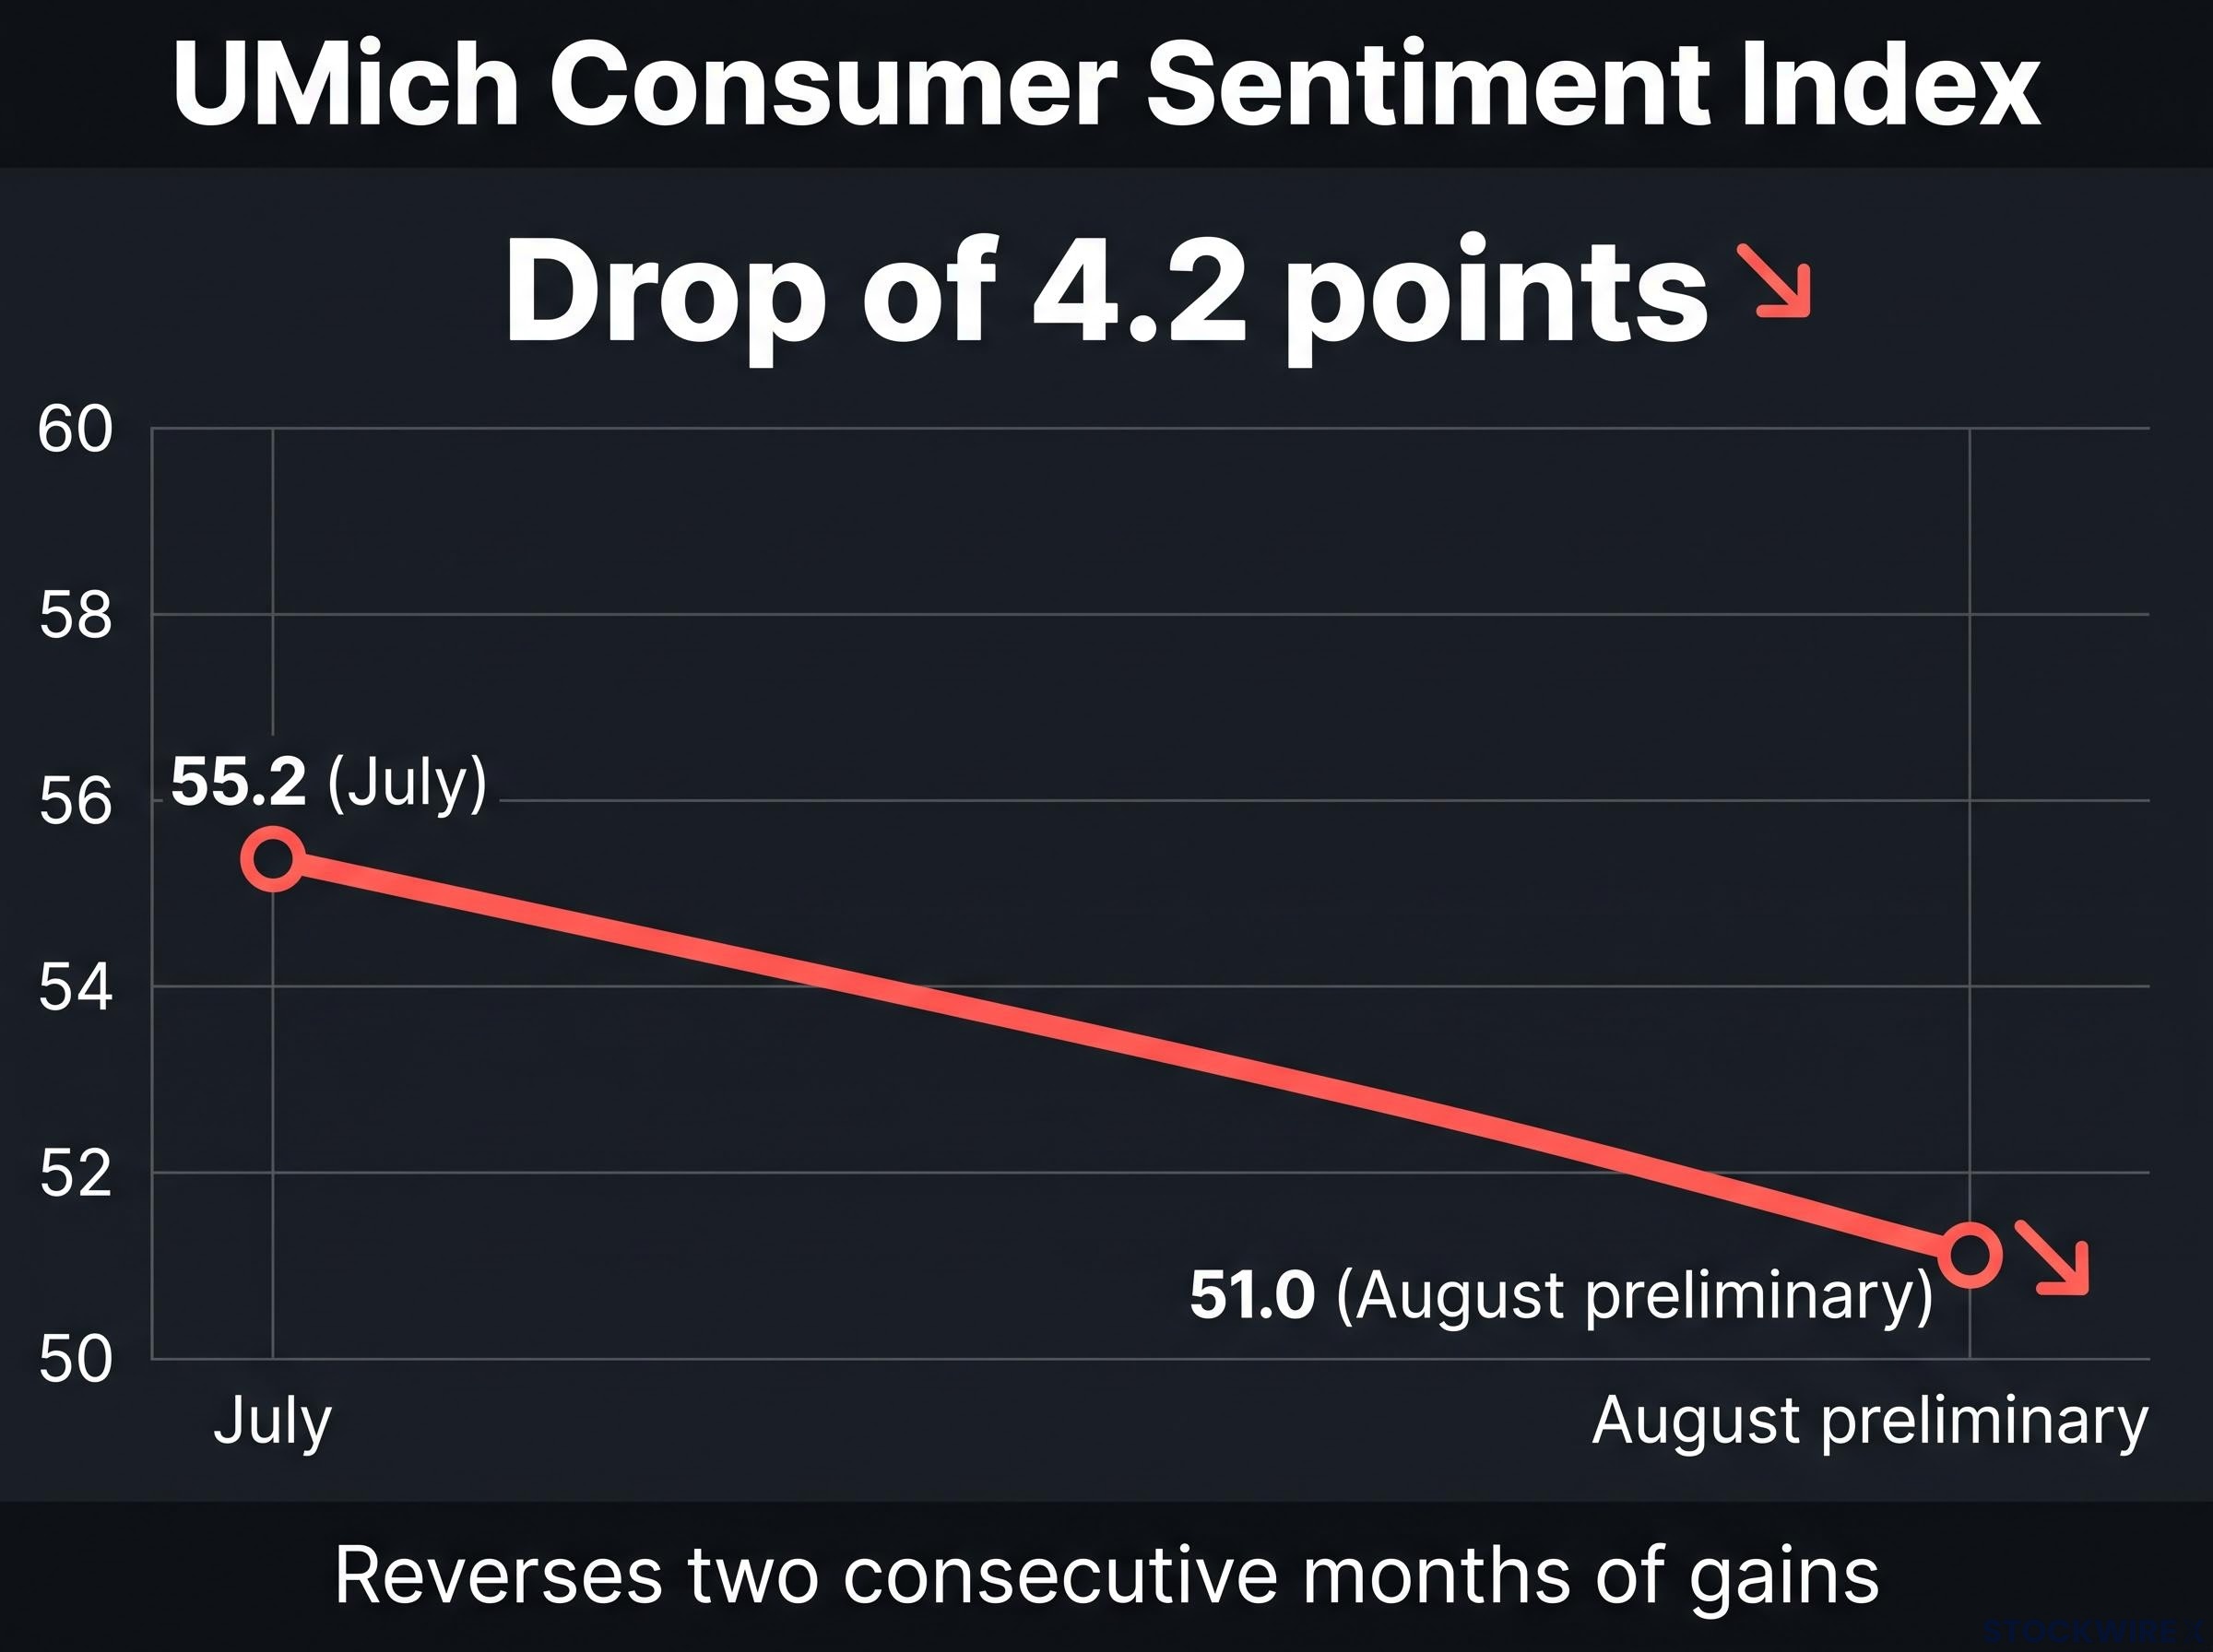
UMich Consumer Sentiment: 51.0, down from 55.2 in July. Two months of improvement, reversed.
This is the number that cannot be explained away by calendar effects. Sentiment reflects households’ own assessment of their financial situation and expectations. It is not distorted by Prime Day timing or petrol prices.
- What it confirms: Households feel more pessimistic about both current conditions and the outlook, even though nominal spending is still rising year-over-year. A reading of 51.0 is historically weak.
- What the offset tells you: Longer-term inflation expectations in the same survey remained stable, which means the public’s confidence in price stability is intact. That preserves the Fed’s room to ease without triggering an inflation-expectations spiral.
Because this deterioration cannot be attributed to statistical distortions, it deserves more weight as a genuine consumer mood signal than the retail sales headline that accompanied it. For anyone assessing whether July’s data represents a turning point or a blip, sentiment is the more honest leading indicator.
For readers wanting the full macro backdrop behind today’s 51.0 print, our dedicated guide to the August sentiment release examines how a 15% energy surge, the first nonfarm payrolls contraction of the cycle, and a sub-53 threshold interact to shift the interpretation from consumer fragility to a stagflation signal.
What the next few months of data will actually tell you
July’s retail print is not the verdict. It is the opening of a three-to-four month data sequence that will determine whether the Fed is cutting cautiously into stabilising demand or racing to catch up with a deteriorating consumer. Two scenarios frame what comes next.
| Dimension | Base case: data stabilises | Risk scenario: weakness persists |
|---|---|---|
| Retail trend | August/September return to modest positive MoM growth | Control-group spending remains negative |
| Dollar outlook | Sideways to slightly softer | Materially lower as growth expectations reprice |
| Yield curve | Front-end yields range-bound | Bull-steepening; 2-year falls faster than longer maturities |
| Fed policy | Cautious, data-dependent easing continues | Markets price quicker, deeper cutting cycle |
The four data points to watch in the months ahead:
- August and September retail sales, especially control-group measures
- Nonfarm payrolls and broader labour market data
- CPI and PCE inflation prints
- University of Michigan sentiment follow-on readings
The December 2026 FOMC hold probability sits at approximately 63%. That is the current market anchor. Each of the releases above will either reinforce it or pull it lower.
Past performance does not guarantee future results. Financial projections are subject to market conditions and various risk factors.
What this data actually changes, and what it does not
Taken together, the retail sales miss and the sentiment deterioration paint a picture of a consumer that is cooling but not collapsing. Year-over-year spending growth of +5.0% is the floor beneath the monthly noise, and it remains solid by any recent historical standard.
What has genuinely shifted is the balance of risks around the Fed’s easing timeline. It has tilted slightly more dovish. The probability of holding through year-end is now modestly lower than it was before today’s releases, even if the 63% December hold figure still represents the base case.
The distortions, Prime Day timing and lower gasoline prices, are expected to reverse in August and September data. If August’s control-group retail measure rebounds into positive territory, the July print will be footnoted as a distortion. If it does not, the conversation about the Fed’s pace of easing will accelerate materially.
+5.0% year-over-year retail growth. That is the number that anchors the consumer story. The monthly prints are the noise around it.
July’s data is the opening of a sequence, not its conclusion. August’s retail release is the next checkpoint that matters for the dollar, yields, and the rate-path narrative.
—