The industrial sector employs roughly 21.8 million Americans and accounts for a substantial share of U.S. GDP, yet most investors struggle to define exactly what it includes. The term appears in earnings calls, economic data releases, and portfolio reports with a frequency that implies a settled definition. It does not have one. Depending on the source, the sector’s GDP contribution ranges from 16-17% to approximately 22.5%, its sub-industries respond to different economic drivers, and its equity market weighting in the S&P 500 sits at roughly 8.7-8.99% as of March 2026. For readers beginning to explore sector-based investing or trying to interpret macroeconomic data, the industrial sector is one of the most frequently referenced but least clearly explained segments of the U.S. economy. This article breaks down what the sector is, how it is organised, what each sub-industry does, and why its performance functions as a barometer for broader economic health.
What the industrial sector actually covers (and what it does not)
The word “industrial” tends to conjure images of factory floors. The reality is substantially wider. The industrial sector is a broad economic category that encompasses three core sub-industries:
- Manufacturing: The conversion of raw materials into finished goods through labour and machinery
- Construction: The building and maintenance of residential, commercial, and industrial structures
- Utilities: The delivery of electricity, gas, and water to businesses and households
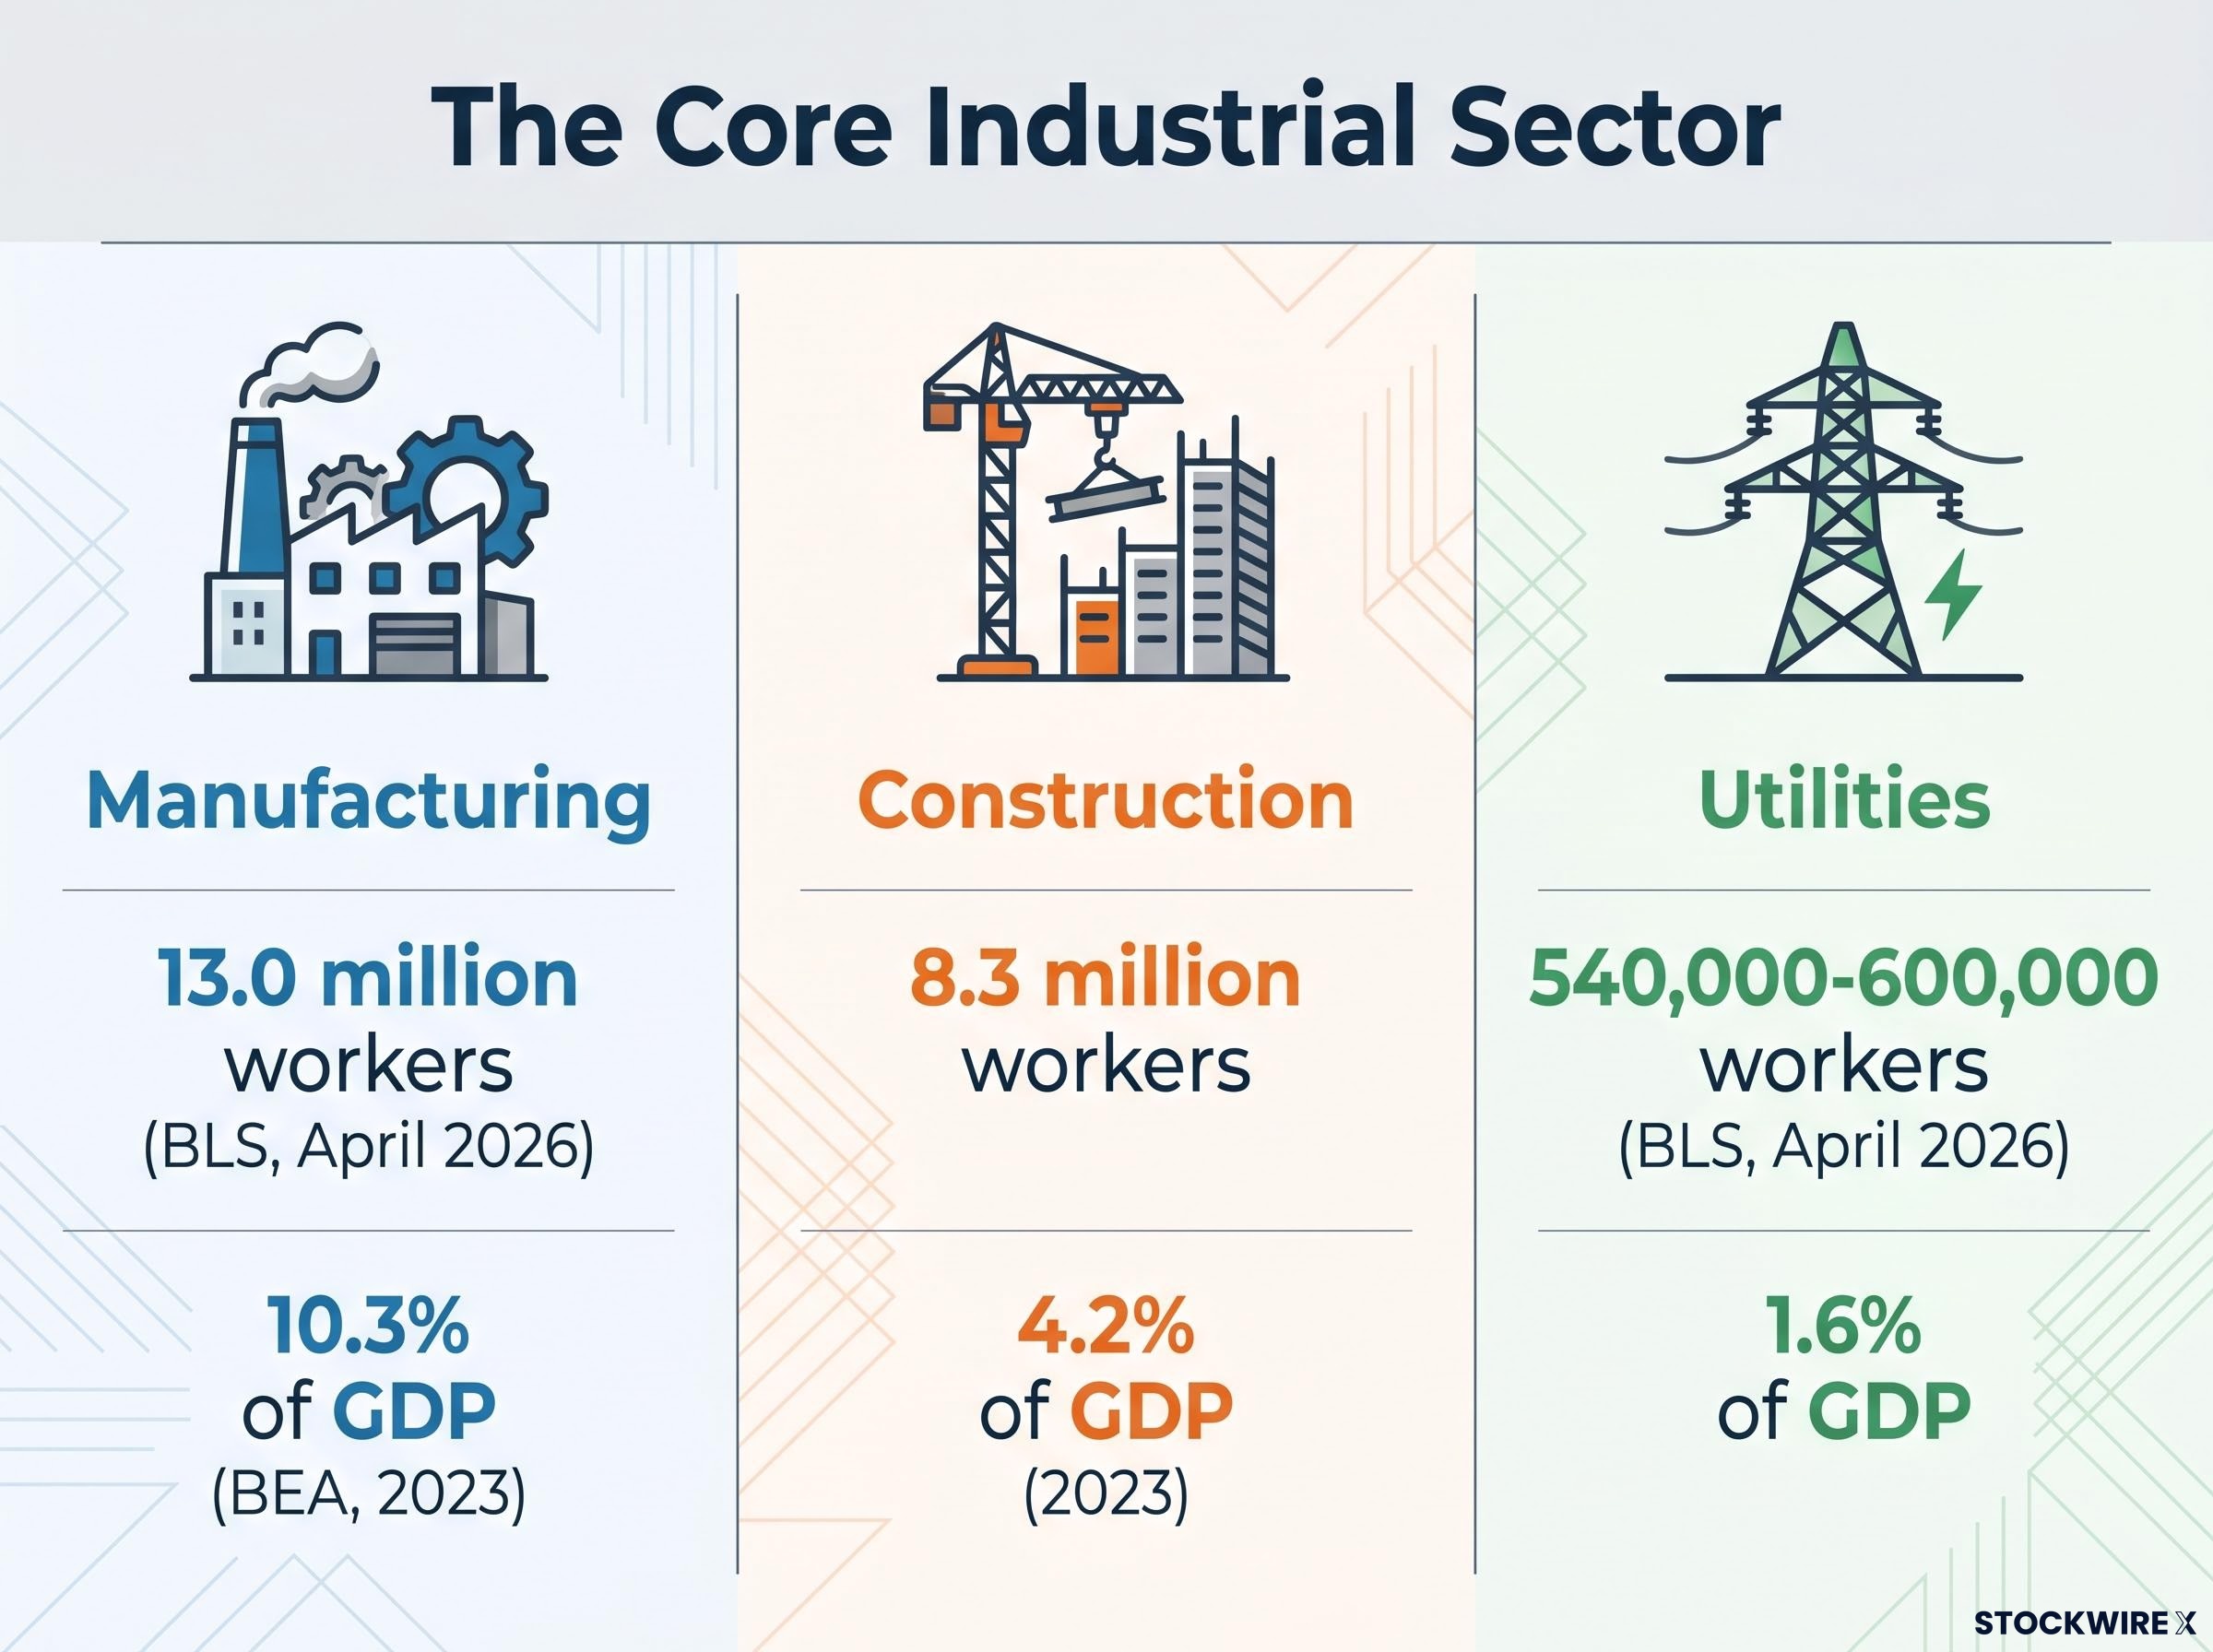
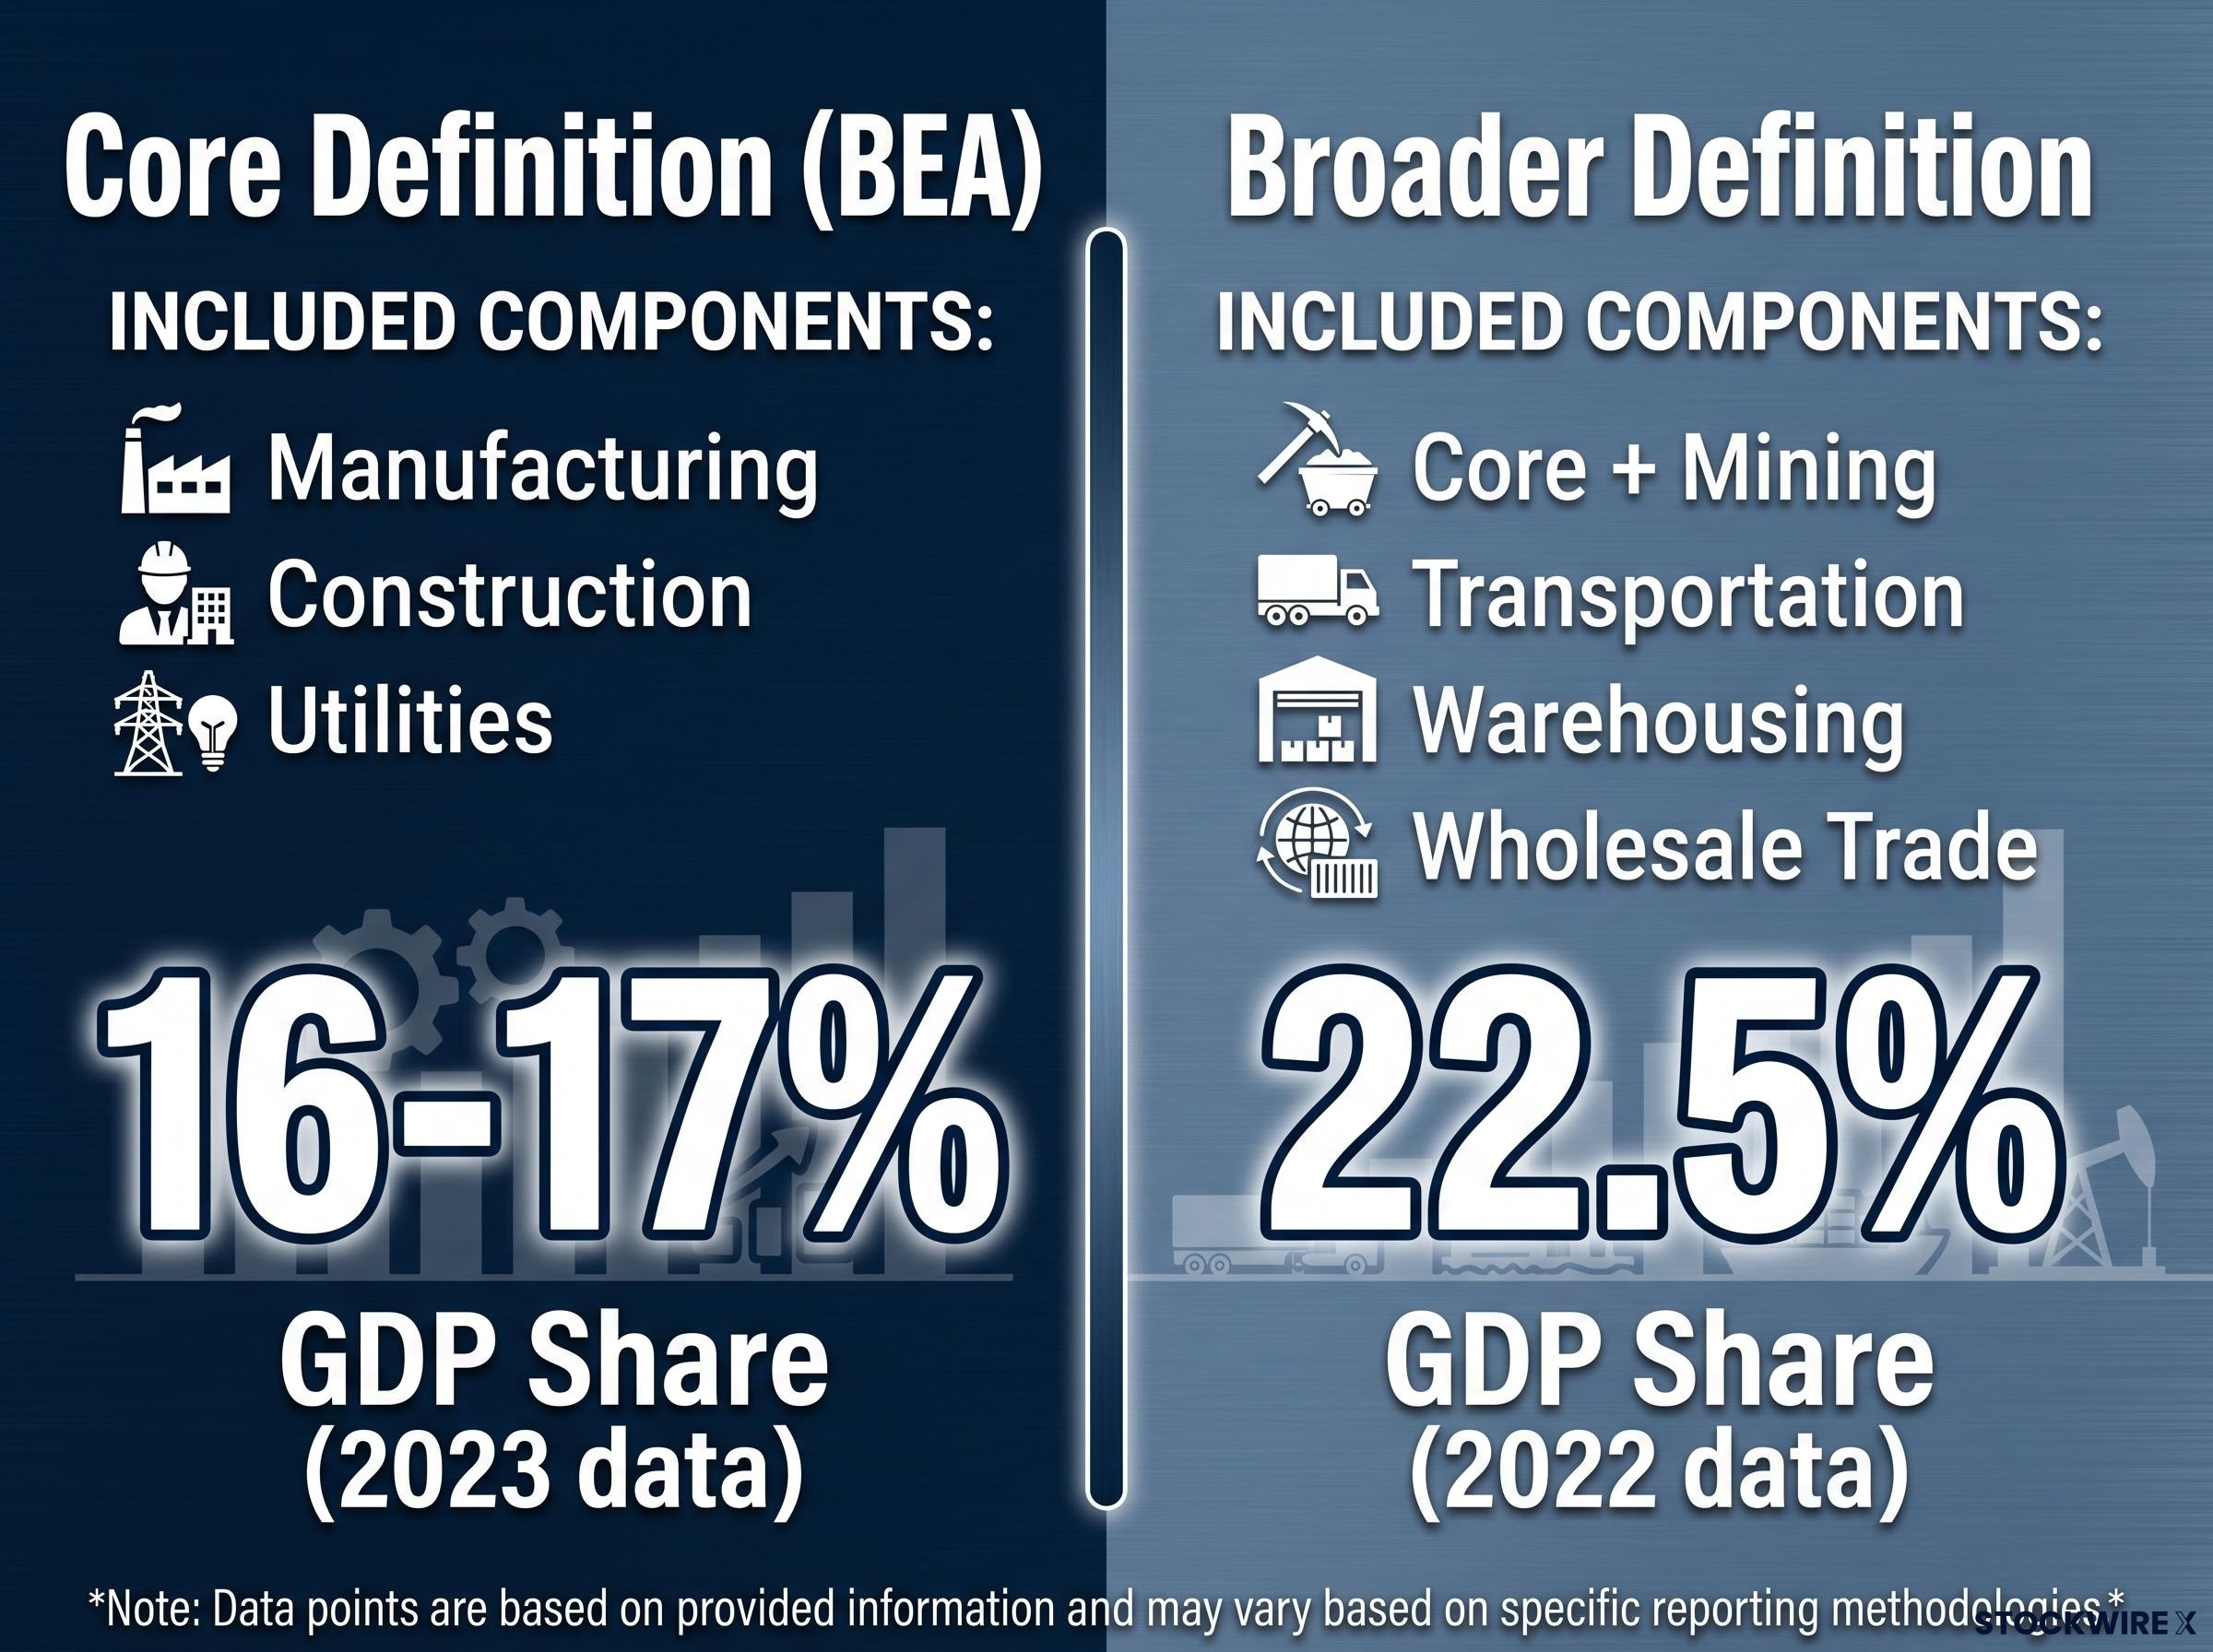
That three-part definition, used by the Bureau of Economic Analysis (BEA), produces a combined GDP share of roughly 16-17% based on 2023 data. Manufacturing alone contributed approximately 10.3%, construction approximately 4.2%, and utilities approximately 1.6%.
The complication arises when broader definitions enter the picture. Some financial data providers and industry sources use a composite “industrial sector” definition that folds in mining, transportation, warehousing, and wholesale trade. Under that wider lens, the sector’s GDP contribution rises to approximately 22.5%, based on 2022 data.
The gap between 16-17% and 22.5% is not a rounding error. It reflects genuinely different definitions of what “industrial” means. Readers encountering GDP figures for the sector should check which industries a given source includes before drawing conclusions.
The S&P 500 Industrials sector, which uses its own classification framework (the Global Industry Classification Standard), carried a weighting of approximately 8.7-8.99% of index market capitalisation as of 31 March 2026, according to S&P Dow Jones Indices. That weighting makes it a meaningful allocation in any diversified index fund.
When big ASX news breaks, our subscribers know first
How the sector’s internal categories define what its companies produce and sell
The industrial sector’s internal logic becomes clearer when viewed through the four groupings that classify what its companies actually produce and sell. These groupings do not describe which industry a company belongs to. They describe the economic role its products or services play in the production chain.
The distinction matters for investors. A company selling capital items (factory equipment, for instance) is likely to see revenues fall sharply when businesses cut capital expenditure budgets during a downturn. A company selling business services (consulting, maintenance advisory) tends to hold contracts through the early stages of a slowdown. The grouping tells the reader something about revenue cyclicality before a single earnings report is opened.
| Grouping | Economic Function | Examples | Cyclicality Profile |
|---|---|---|---|
| Materials and Parts | Raw and processed inputs that feed into production | Steel, plastics, component parts | Moderate to high; tracks production volumes |
| Capital Items | Installations and equipment that build production capacity | Factory machinery, turbines, heavy equipment | High; capex is among the first budget lines cut |
| Supplies | Consumables that maintain and operate existing capacity | Lubricants, safety equipment, cleaning products | Low to moderate; operations continue even in downturns |
| Business Services | Advisory and consulting that improve operational performance | Engineering consulting, IT services, maintenance contracts | Low to moderate; contracts provide revenue visibility |
This framework gives readers a mental model for categorising unfamiliar industrial companies. When a company’s revenues are concentrated in capital items, its earnings will tend to amplify business-cycle swings. When revenues sit in supplies or business services, the earnings profile is typically smoother.
Manufacturing, construction, and utilities: what each sub-industry does and why it matters
Manufacturing and construction: the high-employment core
Manufacturing is the sector’s largest employer, with approximately 13.0 million workers on payrolls as of April 2026, according to the Bureau of Labor Statistics (BLS). Its 10.3% share of GDP (BEA, 2023) anchors the sector’s economic weight. The Institute for Supply Management (ISM) Manufacturing PMI returned to expansion territory (above 50) in early 2025 after a prolonged contraction period through 2023-2024, signalling renewed momentum in new orders and production.
Construction employs approximately 8.3 million workers and contributed roughly 4.2% of GDP in 2023. The sub-industry’s recent trajectory has been shaped by a factory-building surge: the U.S. Census Bureau reported that manufacturing construction spending was more than double its pre-pandemic level by early 2025, driven primarily by semiconductor, electric vehicle, and clean-energy facilities. The Bipartisan Infrastructure Law has added further demand, with more than 56,000 projects announced or launched as of March 2025.
A manufacturing slowdown and a construction slowdown carry different economic signatures. Manufacturing contractions tend to ripple through supply chains and show up in trade data within weeks. Construction slowdowns take longer to materialise because projects run on multi-year timelines, but they affect local employment and housing markets more directly.
Utilities: smaller workforce, systemic importance
Utilities employ a comparatively small workforce of approximately 540,000-600,000 (BLS, April 2026) and contribute roughly 1.6% of GDP. The numbers understate the sub-industry’s systemic role: every manufacturing plant and construction site depends on reliable electricity, gas, and water delivery.
The structural story for utilities investors centres on grid modernisation. The U.S. Energy Information Administration (EIA) projected in January 2025 that solar and wind would supply roughly 30% of U.S. electricity generation by 2026, up from approximately 22% in 2023. Rising electricity demand from AI data centres, electric vehicle charging networks, and broader electrification is pushing utilities to revise load forecasts sharply higher and commit to sustained capital expenditure on transmission and interconnection.
| Sub-Industry | GDP Share (2023) | Employment (April 2026) | Key Demand Driver | Current Structural Theme |
|---|---|---|---|---|
| Manufacturing | ~10.3% | ~13.0 million | Consumer and industrial goods demand | Reshoring, CHIPS Act, ISM PMI recovery |
| Construction | ~4.2% | ~8.3 million | Infrastructure and factory-building | IIJA pipeline, manufacturing construction surge |
| Utilities | ~1.6% | ~540,000-600,000 | Electricity, gas, water delivery | Grid modernisation, renewables, AI/EV demand |
How the industrial sector’s scale shapes the broader U.S. economy
Combined industrial employment of approximately 21.8-21.9 million workers as of April 2026 represents roughly one in seven nonfarm payroll jobs in the United States, according to BLS data. That concentration means industrial hiring and layoffs do not stay contained within the sector. Industrial jobs generate downstream demand for services, retail, and housing in the communities where they are located, making employment trends in manufacturing and construction a leading indicator for broader regional economic health.
The sector’s investment role has become inseparable from national policy priorities. The CHIPS and Science Act directed substantial direct funding to domestic semiconductor manufacturing:
- Intel: up to $8.5 billion in grants plus $11 billion in loans for fabrication facilities in Arizona, New Mexico, Ohio, and Oregon
- TSMC: up to $6.6 billion in direct funding plus up to $5 billion in loans for Arizona facilities
- Micron: up to $6.1 billion for memory fabrication plants in New York and Idaho
These commitments, announced by the U.S. Department of Commerce in April 2024, represent tens of billions in new domestic manufacturing investment tied to national security and advanced-technology supply chains.
The Reshoring Initiative reported that companies announced approximately 287,000 reshored and foreign direct investment manufacturing jobs in 2023, with the 2024 total reaching approximately 244,000. Semiconductors, electric vehicles, and clean-energy equipment are the largest drivers.
The Bipartisan Infrastructure Law has added a parallel layer of public-sector demand, with more than 56,000 projects announced or launched as of March 2025, spanning highways, bridges, ports, airports, and transit systems. The sector is not a passive reflection of economic conditions; it is an active driver of them, and policy-driven investment cycles can create tailwinds that outlast normal business-cycle fluctuations.
How the industrial sector is valued and positioned in equity markets
The structural features established in the sections above have direct consequences for how the sector behaves in equity markets. Three characteristics define the S&P 500 Industrials sector for investors:
- Index weighting: approximately 8.7-8.99% of S&P 500 market capitalisation as of 31 March 2026, making it a meaningful allocation in any diversified index portfolio
- Cyclical positioning: Goldman Sachs described industrials as “late-cycle cyclicals” in its September 2024 U.S. sector outlook, meaning the sector tends to perform well when the economy runs at or near full capacity but carries more risk as growth decelerates
- Growth-value bridge: Morgan Stanley characterised the sector as occupying a dual role in portfolios
Morgan Stanley, in a January 2025 U.S. equity strategy note, argued that industrials could serve as a “bridge between growth and value,” given exposure to AI-enabled factory automation and clean-energy infrastructure alongside traditional cyclical demand.
That dual characterisation reflects the sector’s structural evolution. Industrial companies are no longer confined to the cyclical revenue patterns of legacy manufacturing. Firms with exposure to data centre construction, grid modernisation, and factory automation carry growth characteristics that appeal to investors who would not traditionally allocate to cyclicals.
S&P Global Market Intelligence projected mid-single-digit annual revenue growth for U.S. industrials in 2025-2026 in its December 2024 sector outlook, with order backlogs in aerospace, defence, and industrial machinery supporting earnings. Goldman Sachs, in a November 2024 research note, described the industrial complex as a “multi-year capex story,” forecasting earnings growth for the S&P 500 Industrials sector above the broader index average in 2025.
Demand drivers, constraints, and the forces shaping mid-decade industrial activity
Tailwinds: fiscal policy, reshoring, and digital-physical infrastructure
Three forces are already visible in the data and are expected to sustain above-trend industrial activity through mid-decade:
- Fiscal policy support: The Bipartisan Infrastructure Law, CHIPS Act, and Inflation Reduction Act collectively direct hundreds of billions in public and incentivised private investment into manufacturing, construction, and energy infrastructure. The OECD, in its November 2024 Economic Outlook, projected continued above-trend levels of U.S. public infrastructure and green investment through mid-decade.
- Supply-chain reshoring: The Reshoring Initiative’s data on 287,000 job announcements in 2023 and 244,000 in 2024 reflects a structural shift in where companies locate production, driven by supply-chain resilience concerns, geopolitical risk, and policy incentives.
- Physical infrastructure for AI, electrification, and decarbonisation: Every AI data centre requires electricity, cooling, and physical construction. Every electric vehicle requires charging infrastructure. Every renewable energy installation requires grid interconnection. These are industrial demands, and Goldman Sachs described the resulting investment cycle as a “multi-year capex story” in November 2024.
Constraints: labour, permitting, and financing costs
The sector’s expansion faces three primary constraints, and none of them is a lack of demand:
- Labour shortages: The AGC/Autodesk 2024 Workforce Survey found that more than 80% of U.S. construction firms reported difficulty filling hourly craft positions. The Edison Electric Institute flagged that roughly one-third of utility workers are eligible to retire within ten years.
- Permitting bottlenecks: Interconnection backlogs and permitting delays are slowing some renewable energy and transmission projects, constraining the pace at which utilities can build out grid capacity.
- Financing costs: Higher interest rates create headwinds for rate-sensitive construction segments, particularly private commercial building. Moody’s, in a January 2025 outlook, warned of potential slowdowns in nonresidential private construction if rates remain elevated.
McKinsey Global Institute projected in June 2024 that up to 25% of production tasks could be automated by 2030, with net employment effects expected to be neutral to modestly positive as output grows and new technical roles expand. Automation, in this context, addresses labour shortages more than it displaces workers.
The industrial sector is a lens, not just a label
The industrial sector’s value to investors and economic observers extends beyond its GDP contribution and employment figures, though both are substantial. Its three sub-industries respond to different drivers, move at different speeds, and carry different risk profiles. Its four organisational groupings provide a framework for anticipating how individual companies will behave across the business cycle.
The sector’s relevance is growing rather than contracting. AI, electrification, and supply-chain reshoring all require physical infrastructure that only industrial companies can build and maintain. Understanding how the sector is structured, where it sits in equity markets, and what forces are shaping its trajectory gives readers a usable framework for interpreting the earnings reports, economic data releases, and policy announcements that will continue to reference it.
This article is for informational purposes only and should not be considered financial advice. Investors should conduct their own research and consult with financial professionals before making investment decisions.