AI Stocks Split in Two as CoreWeave Falls 14% and Meta Surges 9%
3 hrs ago
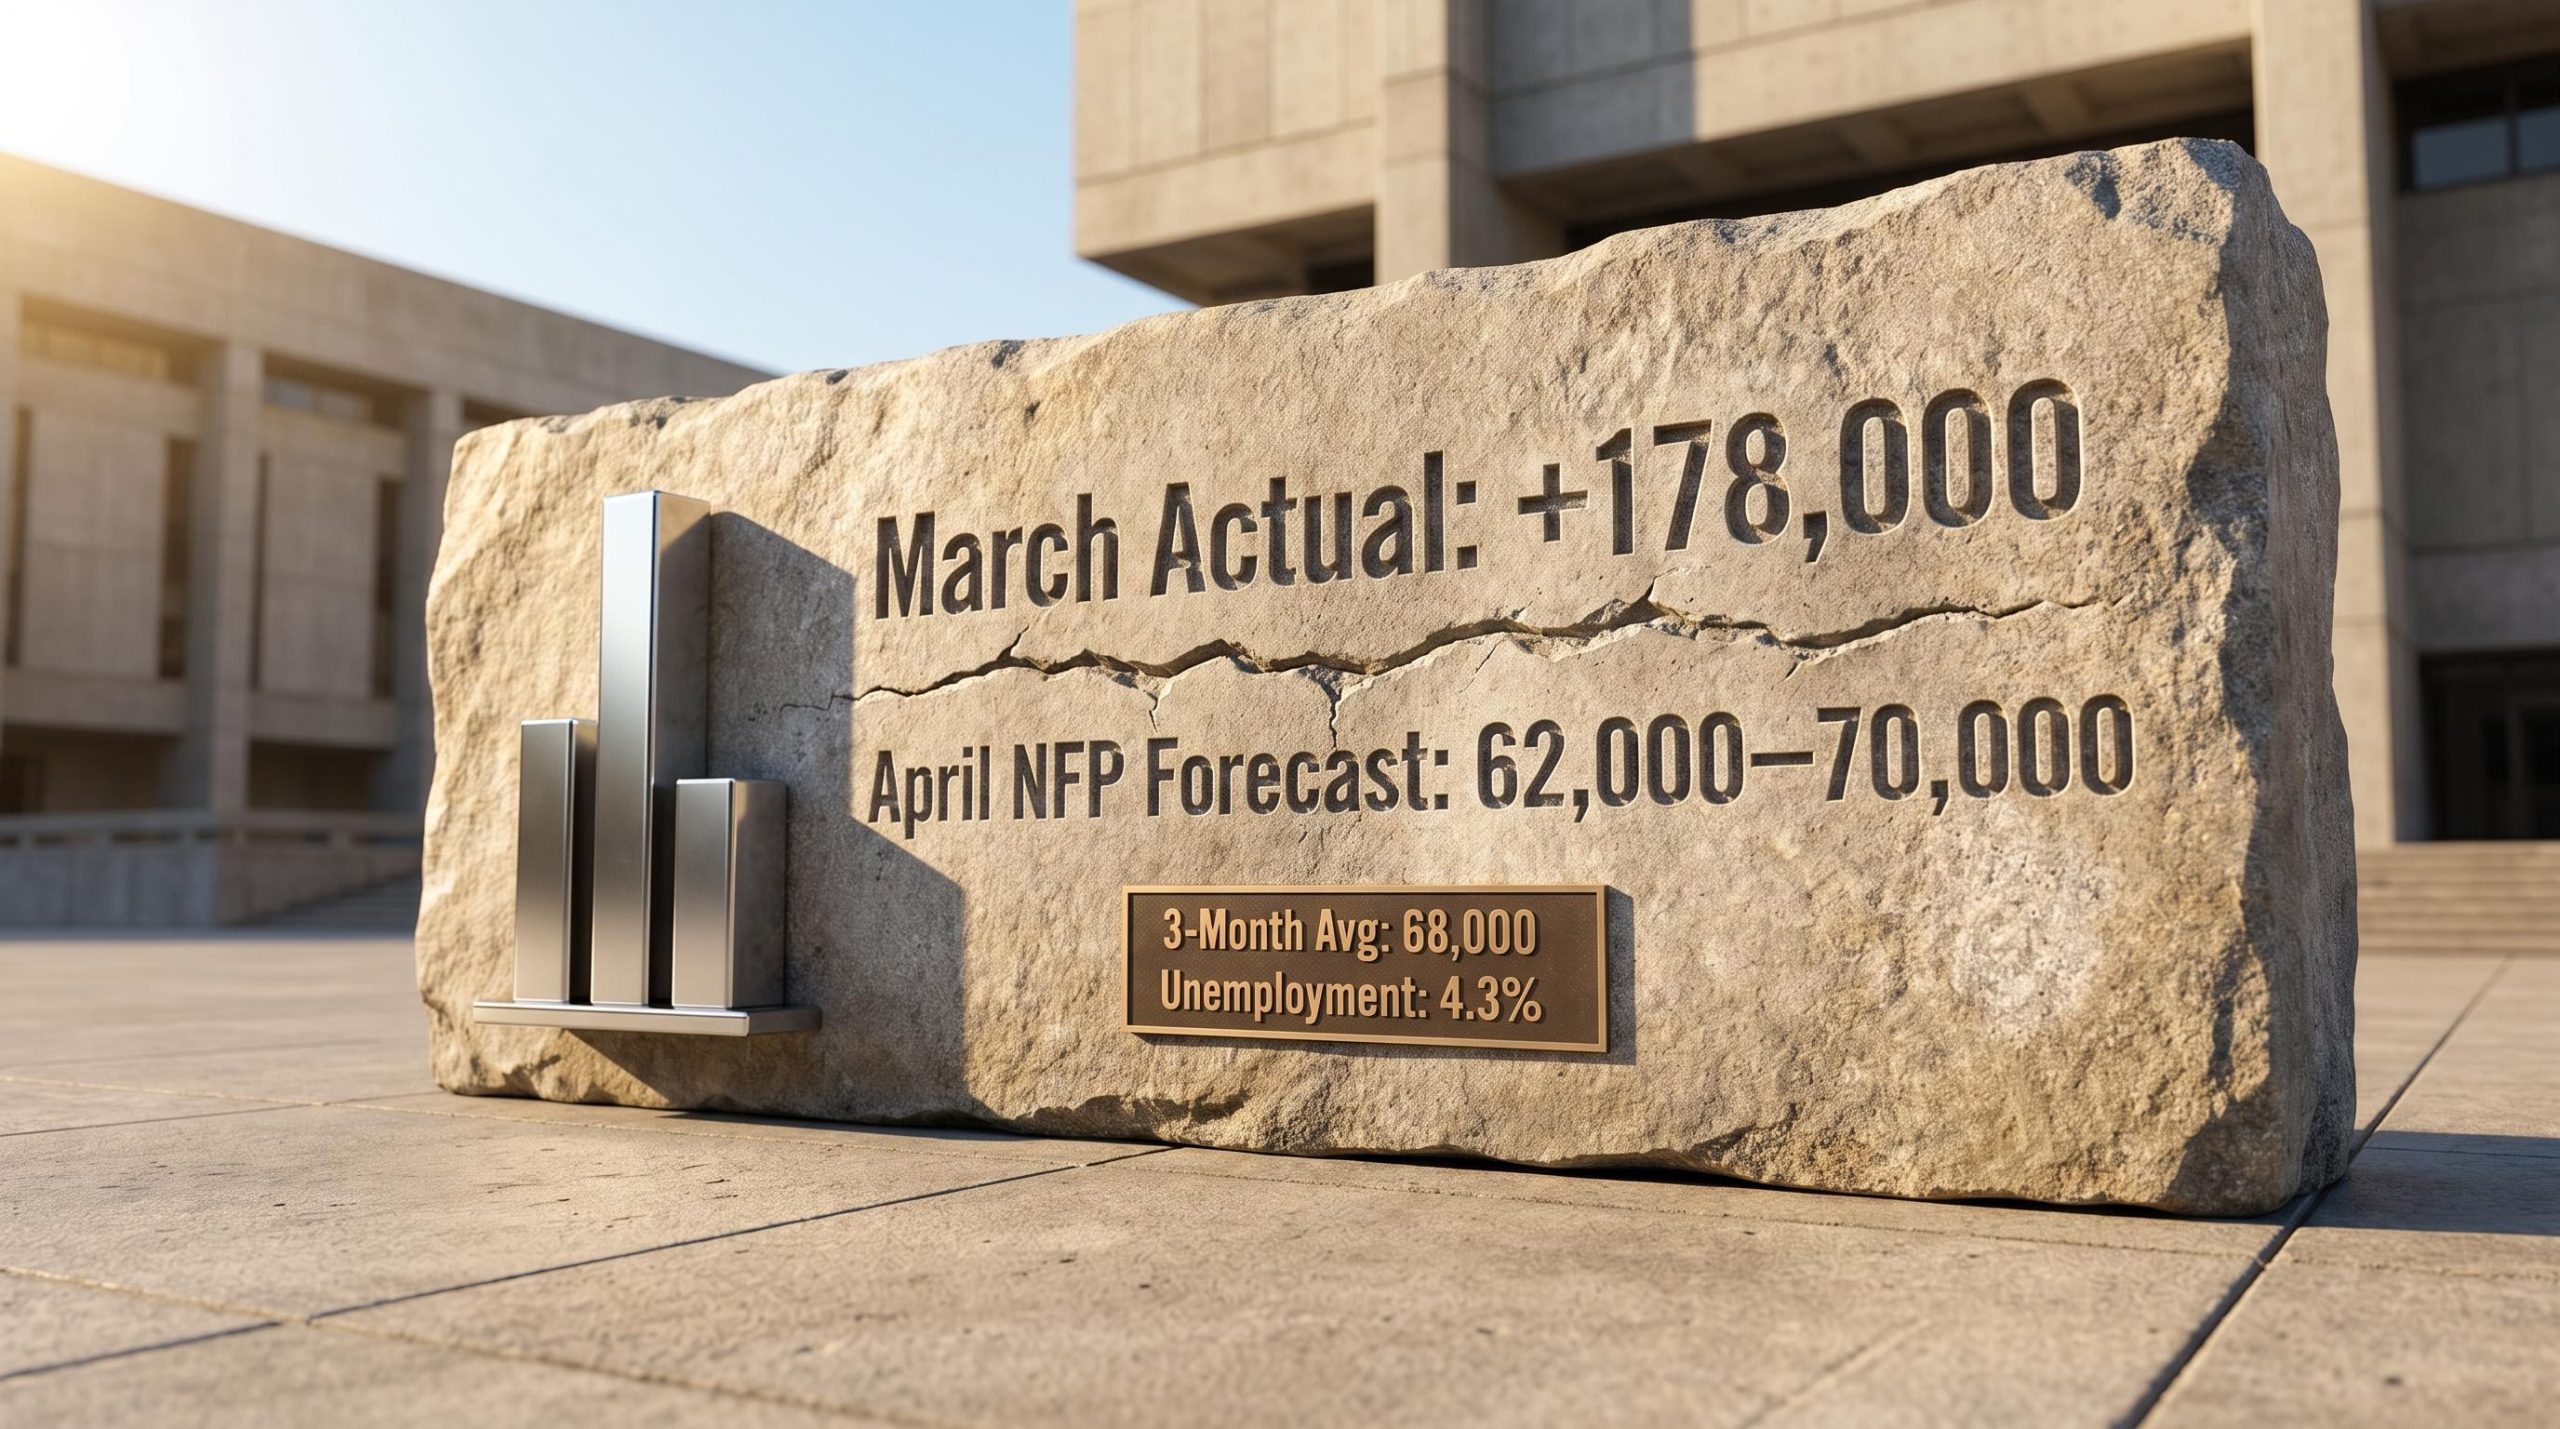
The April US Non-Farm Payrolls report, due Friday 8 May, carries a consensus forecast of roughly 62,000 to 70,000 new jobs. That would represent a steep drop from March’s 178,000 print. The question facing investors this week is whether the expected deceleration reflects a labour market that is genuinely cracking, or a statistical reversion that the Federal Reserve will treat as noise. The answer depends less on the headline number than on what sits beneath it: wage growth, revision patterns, and a three-month trend that already tells a more honest story than any single month can. What follows is a breakdown of what the consensus actually reflects, why this particular release is harder to forecast than most, what the Fed is watching inside the data, and how markets are positioned for a surprise in either direction.
March’s 178,000 figure overstates the underlying pace of hiring. A significant portion of that print reflected healthcare workers returning from a strike, a one-off boost that inflated the base and now makes the April comparison inherently difficult. Strip that effect away and the trajectory looks less alarming.
The three-month average of 68,000 jobs tells the more reliable story. Since January 2025, monthly gains have averaged just 20,000, a pace that confirms deceleration has been underway for over a year, not arriving suddenly in April.
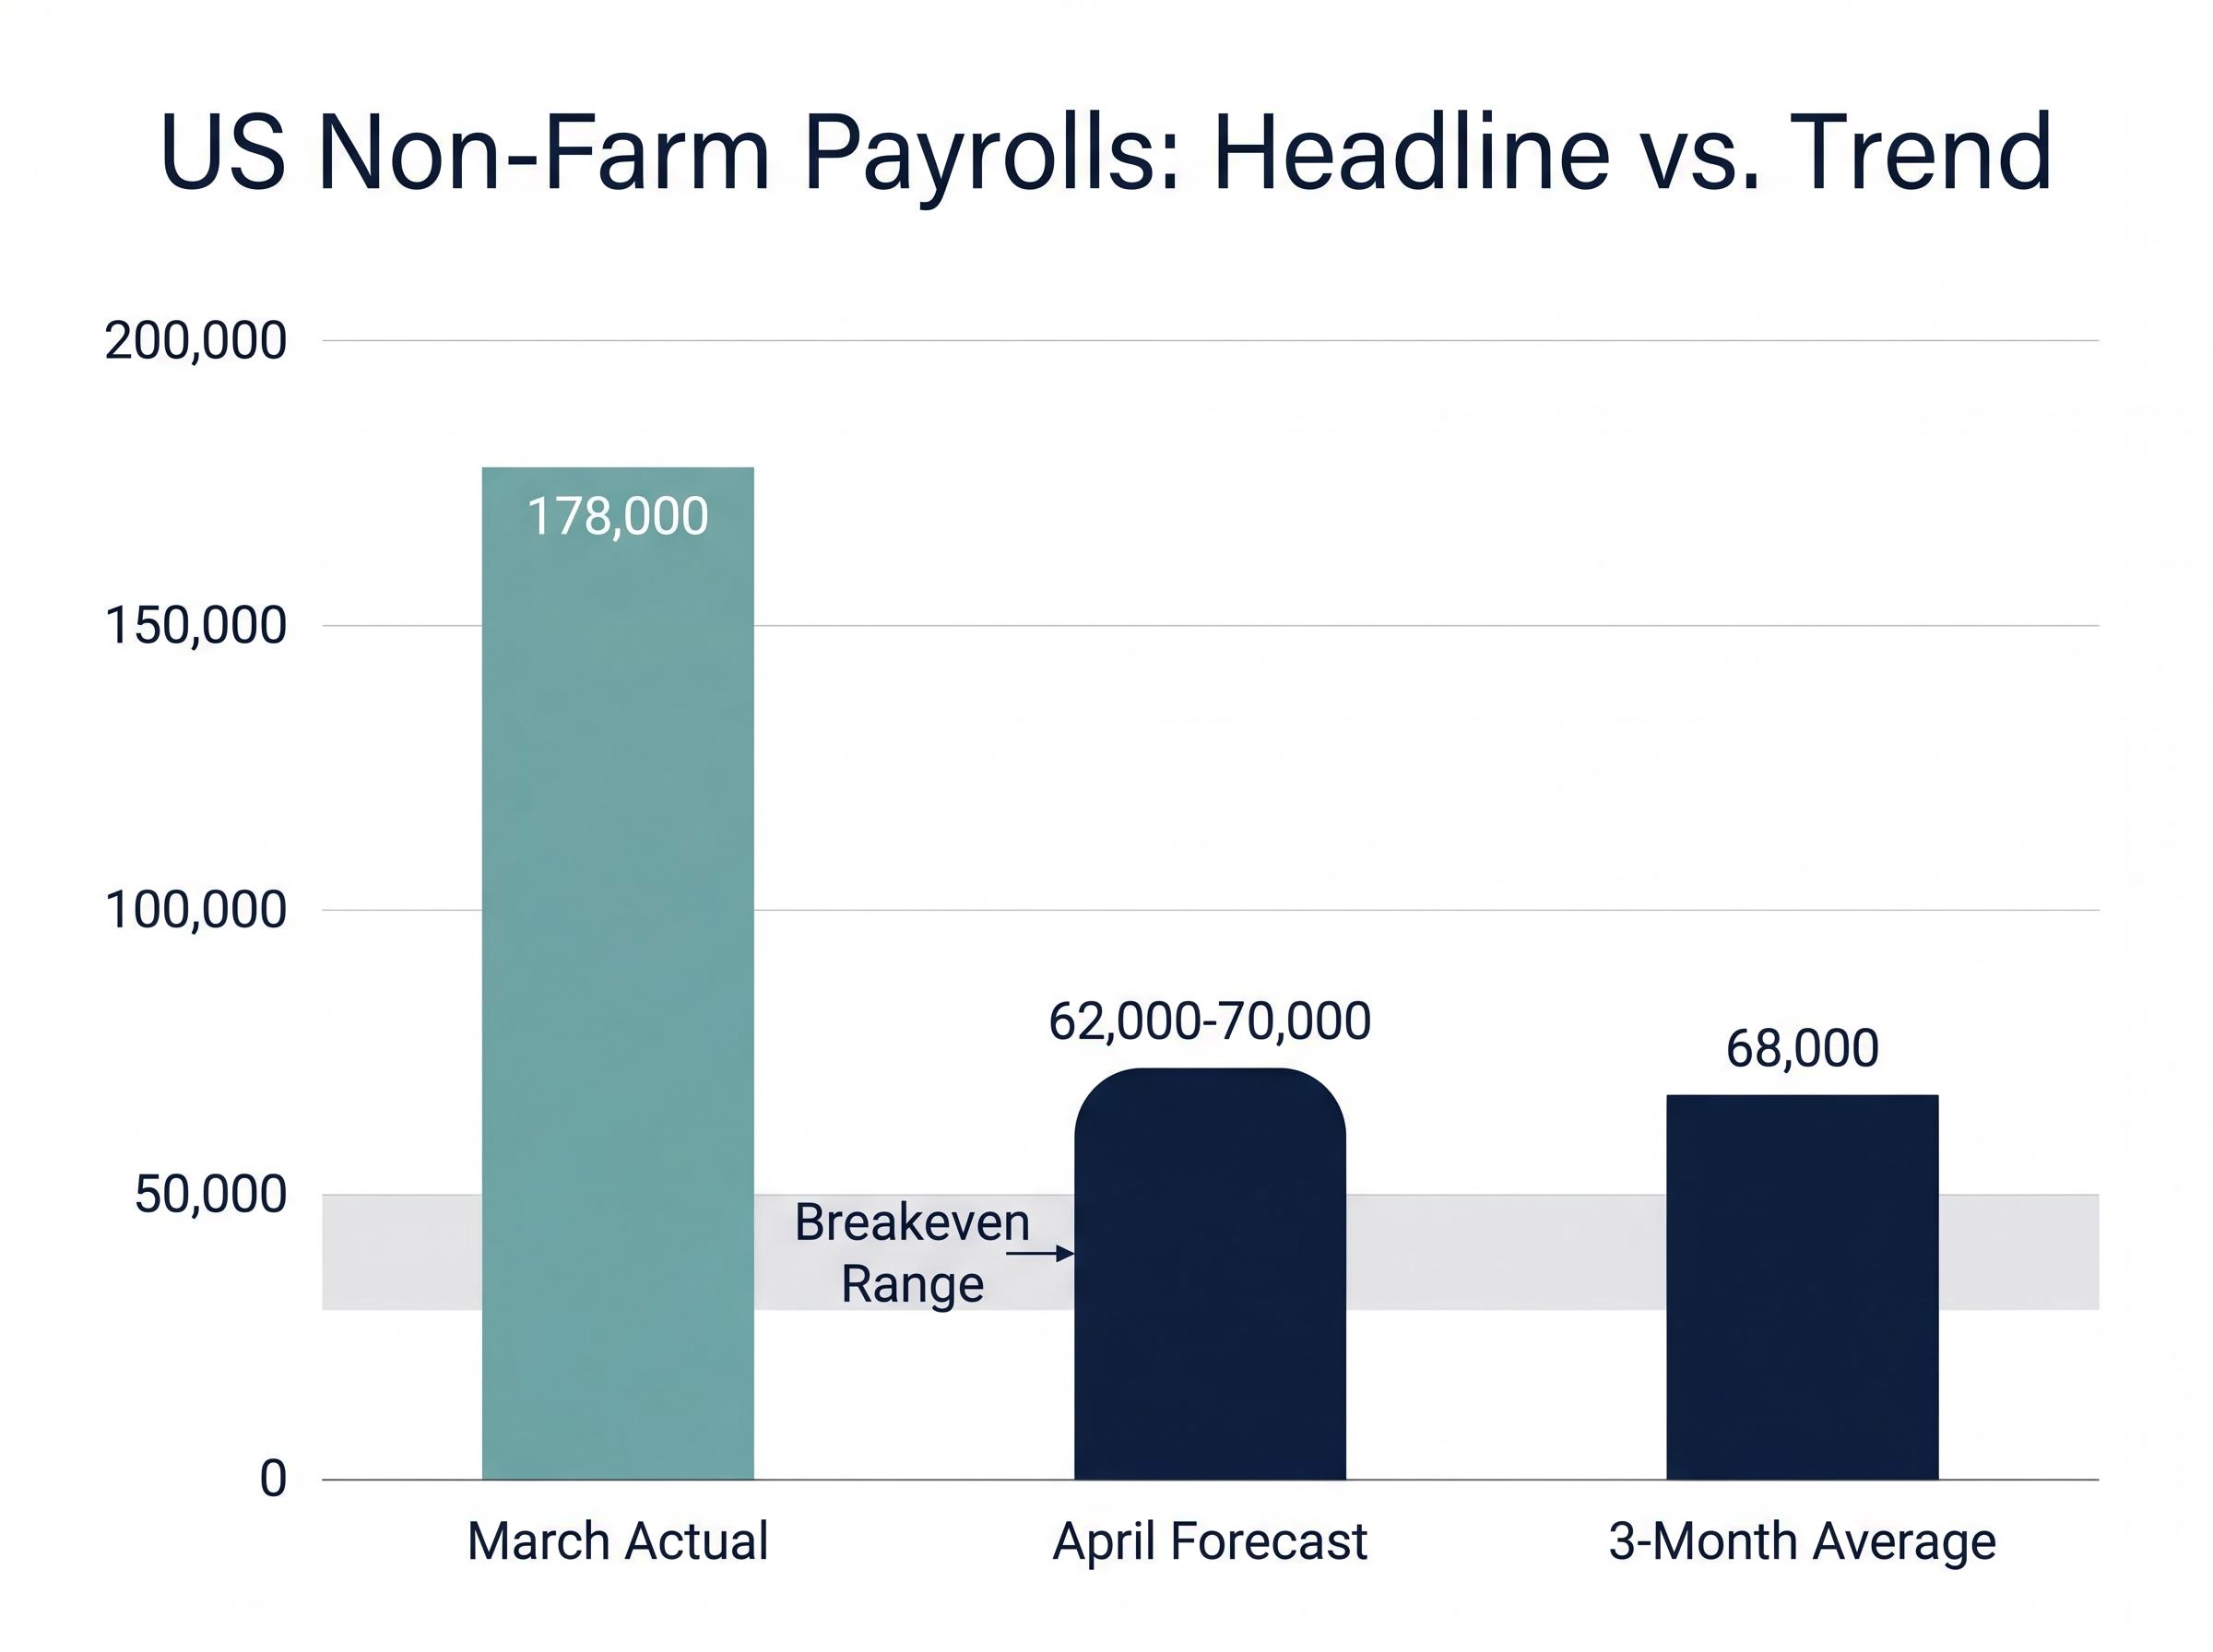
The three-month average of 68,000 monthly jobs sits uncomfortably close to the 30,000 to 50,000 breakeven range, the threshold economists estimate the US economy needs simply to absorb population growth. The Fed is more likely to anchor on this trend than on any single print.
The unemployment rate is expected to hold at 4.3%, and monthly wage growth is forecast at 0.3%, one-tenth above the prior reading. That wage figure may matter more than the headline.
| Metric | March Actual | April Forecast |
|---|---|---|
| Headline payrolls | +178,000 | ~62,000-70,000 |
| Unemployment rate | 4.3% | 4.3% |
| Wage growth (m/m) | 0.2% | 0.3% |
| Private payrolls | +186,000 | Below March level |
Understanding the composition of the slowdown, not just the headline figure, is what separates a knee-jerk reaction from an informed read. The strike-return effect is a distortion, not a structural deterioration signal.
The 70,000 consensus looks precise. It is not. Three compounding sources of forecasting error make this particular release unusually treacherous:
Each of these sources operates independently, meaning their errors can compound rather than cancel.
Octagon AI’s model shows neutral positioning with low mispricing signals detected, suggesting the market has priced the consensus range reasonably. Neither bulls nor bears appear to be leaning heavily into a directional bet. That neutrality itself is informative: it implies the market recognises the forecast uncertainty.
The BLS revises the prior two months with every release. The true picture of the labour market often only emerges weeks after the initial headline reaction.
March’s report illustrated this directly. January was revised up by 34,000 jobs while February was revised down by 41,000, producing a net revision of negative 7,000. Investors who traded on the original January or February prints acted on numbers that turned out to be materially different from the final figures. The same revision risk applies to whatever number the BLS prints on Friday.
The headline payrolls figure will dominate Friday morning coverage. The Fed’s reading of the data will be narrower and more specific.
Chair Powell and the Federal Open Market Committee (FOMC) have signalled a hierarchy within their dual mandate: price stability currently takes precedence over labour market conditions when interpreting incoming data. A soft payrolls print alone is unlikely to trigger a shift toward rate cuts. The bar is higher than one weak month.
Powell has clarified that most FOMC members did not wish to signal a rate increase as probable as a rate reduction, framing the current stance as a genuine hold rather than a lean in either direction.
Within the payrolls release, three components will receive the closest scrutiny from policymakers:
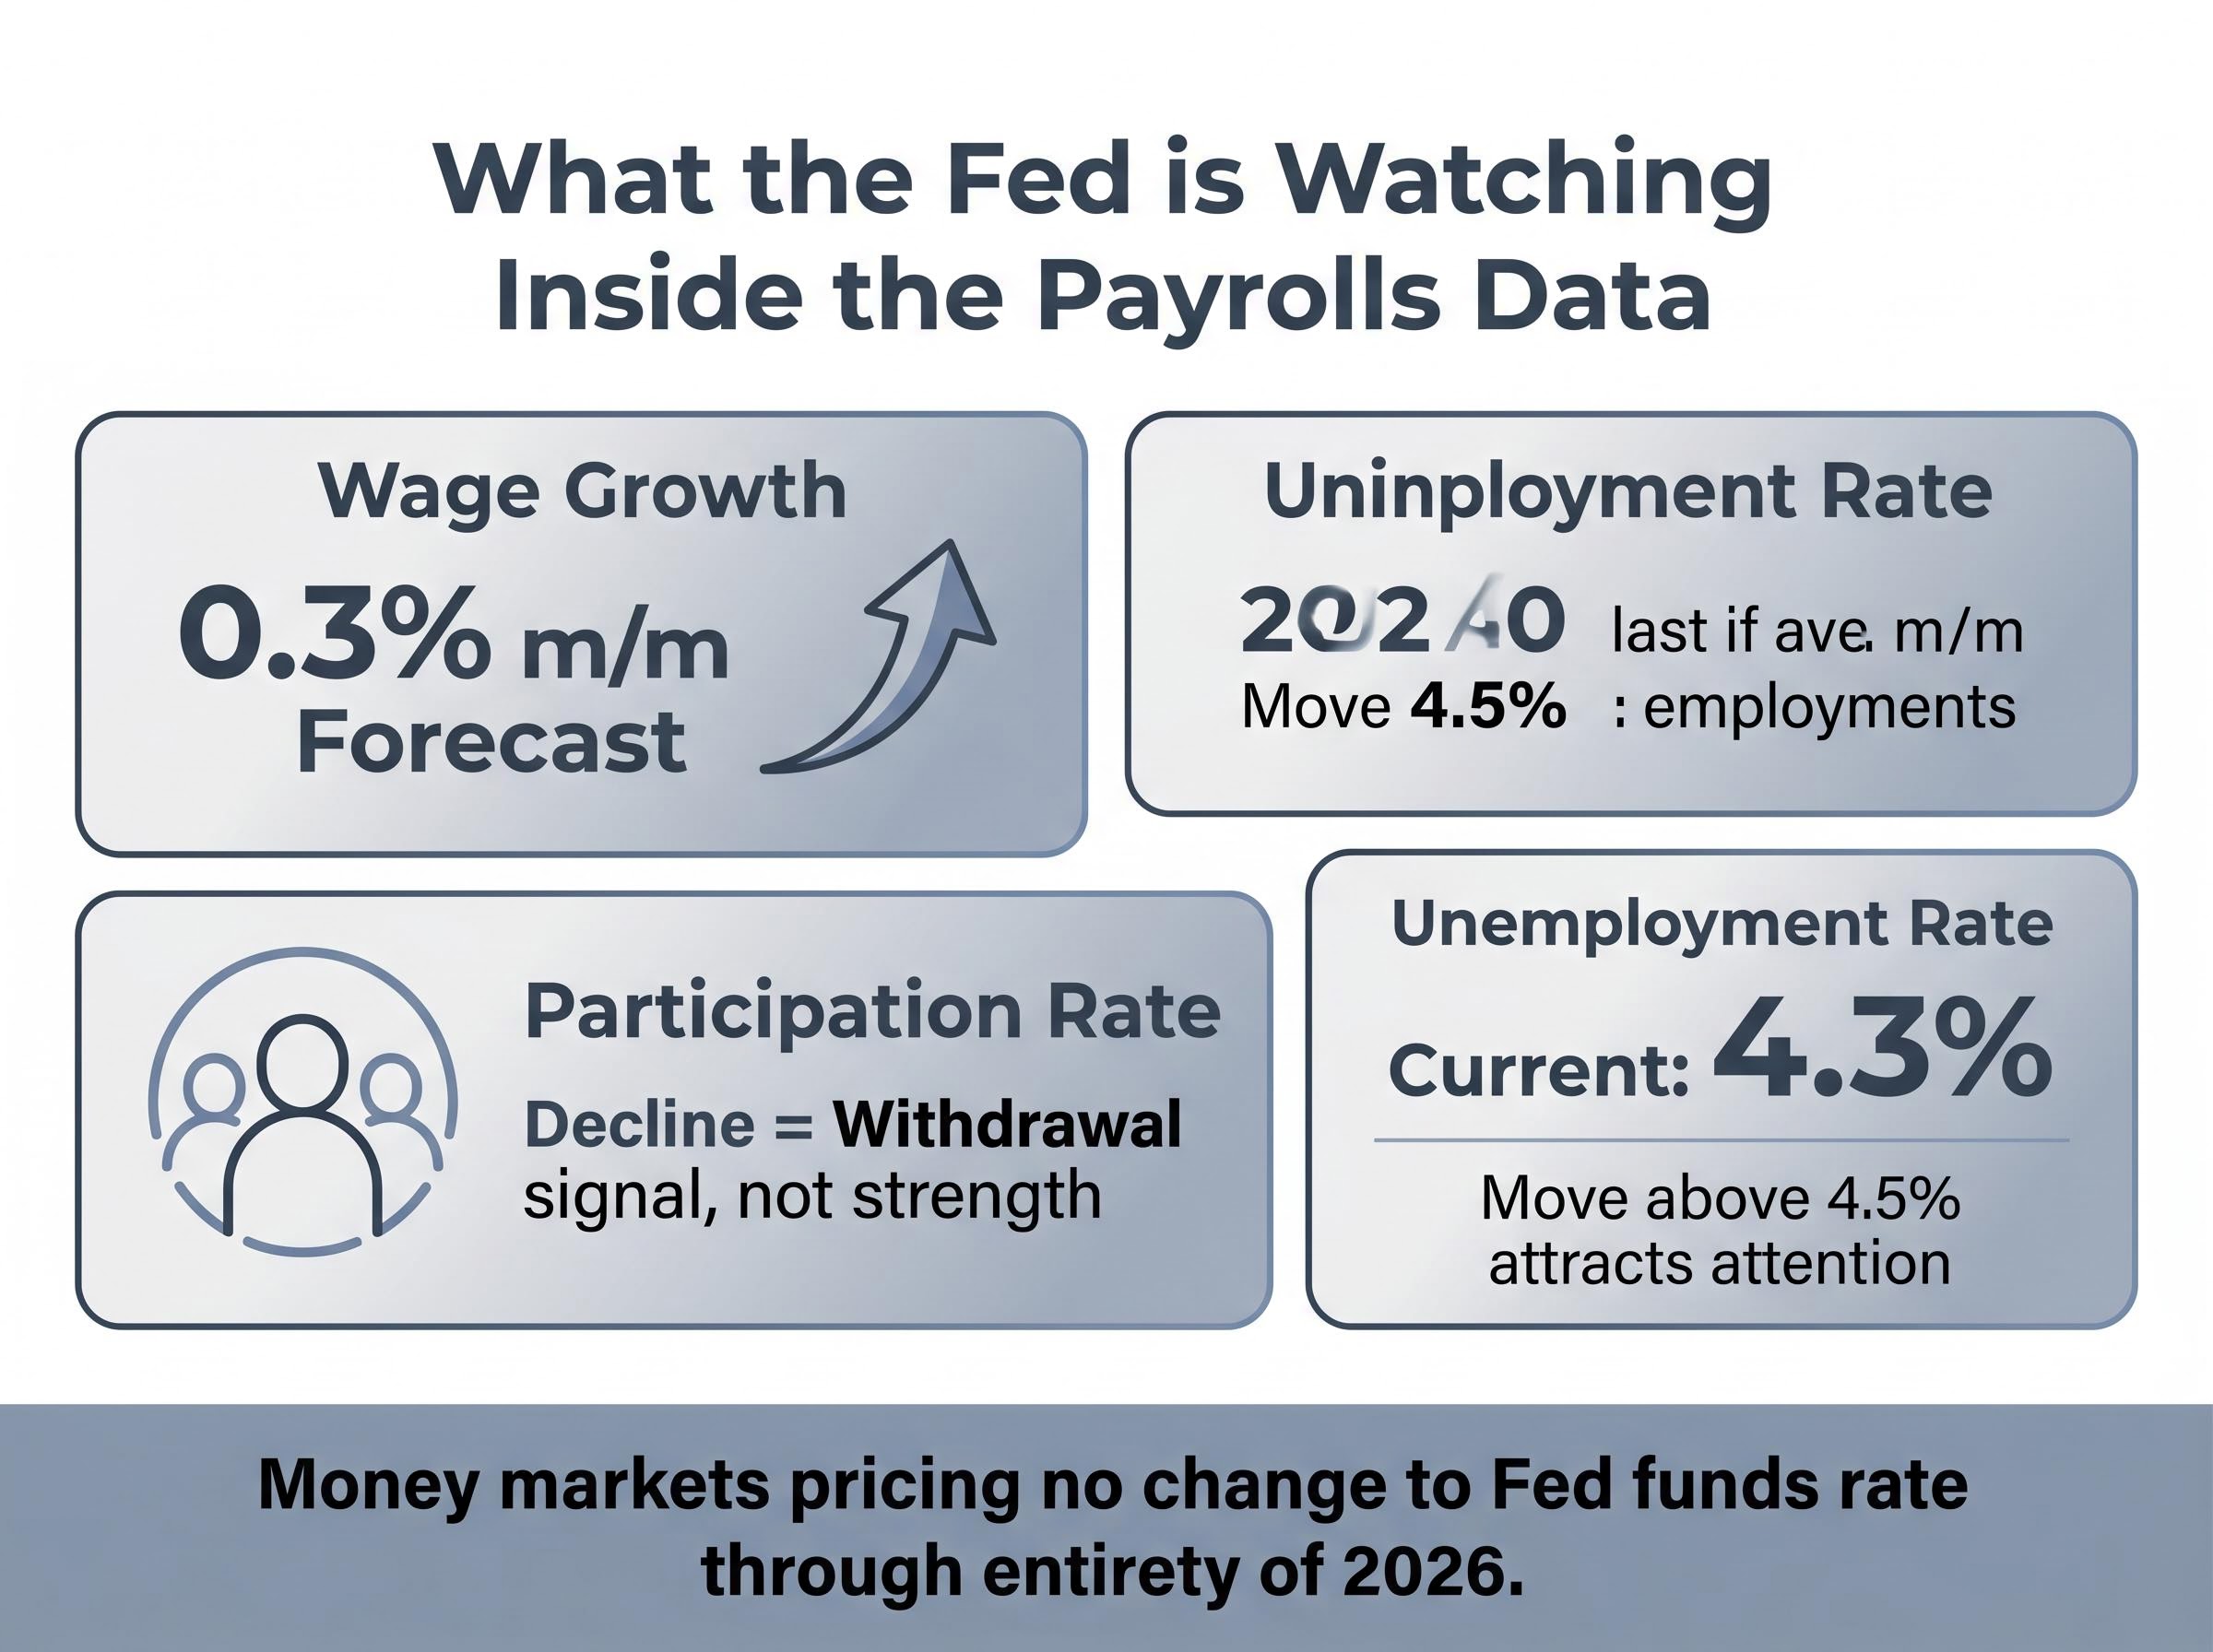
Money markets are pricing no change to the Fed funds rate through the entirety of 2026. Breaking that consensus would require a sustained sequence of weak prints, not a single miss. Investors who treat a soft April number as an automatic catalyst for rate-cut repricing may be misreading the Fed’s reaction function.
The risk is not symmetric. A large upside miss and a large downside miss would not produce mirror-image market responses, given the Fed’s current stance and the earnings season backdrop.
Approximately 82% of S&P 500 companies have beaten earnings estimates this season, compared with 77% in the prior full-year cycle. Equity markets enter the Friday release from a position of relative strength.
| Scenario | Payrolls Range | Likely Market Response | Fed Implication |
|---|---|---|---|
| Significant beat | Above 100,000 | Rate-cut expectations compress further; Treasury yields rise | Reinforces hold-for-longer stance |
| In-line | 60,000-80,000 | Muted reaction; confirms existing trend | No policy signal change |
| Significant miss | Below 40,000 | Recession fears rise; equity volatility increases | Rate-cut debate reopens, but not immediate action |
The services ISM employment sub-index for April, forecast at 53.7 (down from 54.0), is released on Tuesday 6 May and provides a real-time leading signal worth watching ahead of Friday’s print.
A print below 40,000 would nominally support a rate-cut narrative. That does not make it automatically positive for equities. The distinction that matters is composition.
A soft print driven by temporary distortions (weather, seasonal noise, strike normalisation) is one the Fed can dismiss. It is bullish for rates and broadly neutral for equities. A soft print that signals genuine labour market deterioration, rising layoffs, falling participation, broadening sectoral weakness, is negative for equities even if it brings rate cuts closer. In that scenario, the damage to earnings expectations outweighs the benefit of cheaper money.
The three-month average of 68,000 is the anchor the Fed will use, not the single April print. One report, however dramatic, does not rewrite a trend that has been building for more than a year.
The number will also be revised twice over the following two months. Investors who act on the initial headline without accounting for revision risk are treating noise as signal.
The April payrolls report is one data point in a labour market that has been decelerating since early 2025. Its significance lies in whether it confirms, accelerates, or disrupts that trend. Friday will provide a signal. It will not deliver a sentence.
This article is for informational purposes only and should not be considered financial advice. Investors should conduct their own research and consult with financial professionals before making investment decisions. Past performance does not guarantee future results. Financial projections are subject to market conditions and various risk factors.
US Non-Farm Payrolls is a monthly report measuring the number of new jobs added outside the farming sector, and it is one of the most closely watched economic indicators because it signals the health of the labour market and influences Federal Reserve interest rate decisions.
The consensus forecast for April 2025 US Non-Farm Payrolls is approximately 62,000 to 70,000 new jobs, a sharp drop from March's 178,000 print, partly due to the reversal of a one-off boost from healthcare workers returning after a strike.
A single soft payrolls print is unlikely to trigger a Fed rate cut, as the FOMC has signalled that price stability currently takes precedence and money markets are pricing no change to the Fed funds rate through all of 2026.
The Fed is closely watching wage growth (forecast at 0.3% month-on-month), labour force participation rate movements, and the unemployment rate trend, rather than the headline jobs number alone.
A print below 40,000 is not automatically bullish for equities; if the weakness reflects temporary distortions it may be broadly neutral, but if it signals genuine labour market deterioration through rising layoffs and falling participation, it could hurt earnings expectations even if it brings rate cuts closer.