
Record Highs Are Not the Risk Most Investors Think They Are
6 hrs ago

Options markets are pricing above-average single-stock swings this week as roughly half of the Russell 1000 prepares to report, and JPMorgan is warning investors not to underestimate the magnitude. The week of April 27, 2026 represents the peak of Q1 2026 earnings season, with five Magnificent Seven names, hundreds of mid-cap companies, and a cluster of historically volatile individual stocks all reporting within days of one another. That concentration, layered on top of a geopolitical risk premium tied to Iran-related oil price pressure, has pushed implied moves to elevated levels across the board.
What follows is the full picture: what JPMorgan is flagging and why, which mega-cap names carry the biggest expected swings, which individual stocks outside the tech giants could move 10%, 20%, or even 29% in a single session, and how investors can interpret these signals without overreacting or dismissing them.
JPMorgan has explicitly warned investors to expect elevated implied stock price moves this week. The warning is not a directional call; it is a magnitude signal derived from options pricing, indicating that the market consensus expects larger-than-normal swings around earnings releases regardless of whether results surprise to the upside or downside.
JPMorgan’s framing: Elevated implied moves reflect the market’s expectation of the size of post-earnings price swings, not whether those swings will be positive or negative. Magnitude, not direction, is what options pricing embeds.
The structural reason is straightforward: approximately half of the Russell 1000 index constituents report this week. The Russell 1000 covers roughly 93% of total US equity market capitalisation, meaning the majority of investable US equity value faces an earnings event in a compressed five-day window.
JPMorgan also cited an Iran war-related oil price increase as an embedded geopolitical risk premium amplifying implied volatility beyond what earnings uncertainty alone would generate. The VIX closed at 19.31 on April 23, 2026, a level indicating moderate caution without outright panic.
Iran tensions transmitting through oil into equity valuations have produced a multi-asset tightening effect, with Brent crude surging more than 5% on 20 April alone, bond yields rising on inflation fears, and Federal Reserve rate cut expectations being priced out simultaneously — a set of conditions that explains why the geopolitical risk premium in this week’s options pricing extends well beyond the Energy sector.
Five of the seven mega-cap tech names report this week. Tesla has already reported, and Nvidia is not expected until around May 20. That leaves Alphabet, Apple, Microsoft, Amazon, and Meta all crowded into the same few days, with Wednesday standing out as the single most concentrated session.
On Wednesday alone, Amazon, Alphabet, Microsoft, and Meta all report simultaneously. The options-implied moves for each name give a concrete sense of how much capital is at stake in that 24-hour window.
The earnings-day implied moves are only one layer of the catalyst convergence facing markets this week; the Federal Reserve’s final Jerome Powell-era rate decision and the Q1 2026 GDP advance estimate both land within 48 hours of Wednesday’s four-name mega-cap reporting event, creating a rare simultaneous repricing environment for the S&P 500 and Nasdaq 100.
| Company | Report Day | Projected Options-Implied Move |
|---|---|---|
| Meta | Wednesday | 7%+ |
| Amazon | Wednesday | ~6.5% |
| Microsoft | Wednesday | ~6% |
| Alphabet | Wednesday | ~4% |
| Apple | This week | ~2.2% |
Meta carries the largest projected swing at more than 7%, while Apple sits at the other end with approximately 2.2%, the smallest of the group. Pre-earnings consensus for the Information Technology sector projects +45.0% year-on-year growth, the highest of any sector this quarter.
Apple’s added narrative layer: This week’s report marks the first earnings release since John Ternus was designated as successor to CEO Tim Cook, adding a leadership transition dimension to an already closely watched result.
For investors holding any of these names, the projected swings translate directly into dollars of portfolio exposure per share. Wednesday’s four-name overlap means a single session could move multiple large positions simultaneously.
The early scoreboard is strong. As of April 17, 2026, approximately 10% of S&P 500 companies had reported Q1 results, with 88% beating EPS estimates by an aggregate surprise of 10.8%. That beat rate sits well above the five-year average of 78% and the 10-year average of 76%.
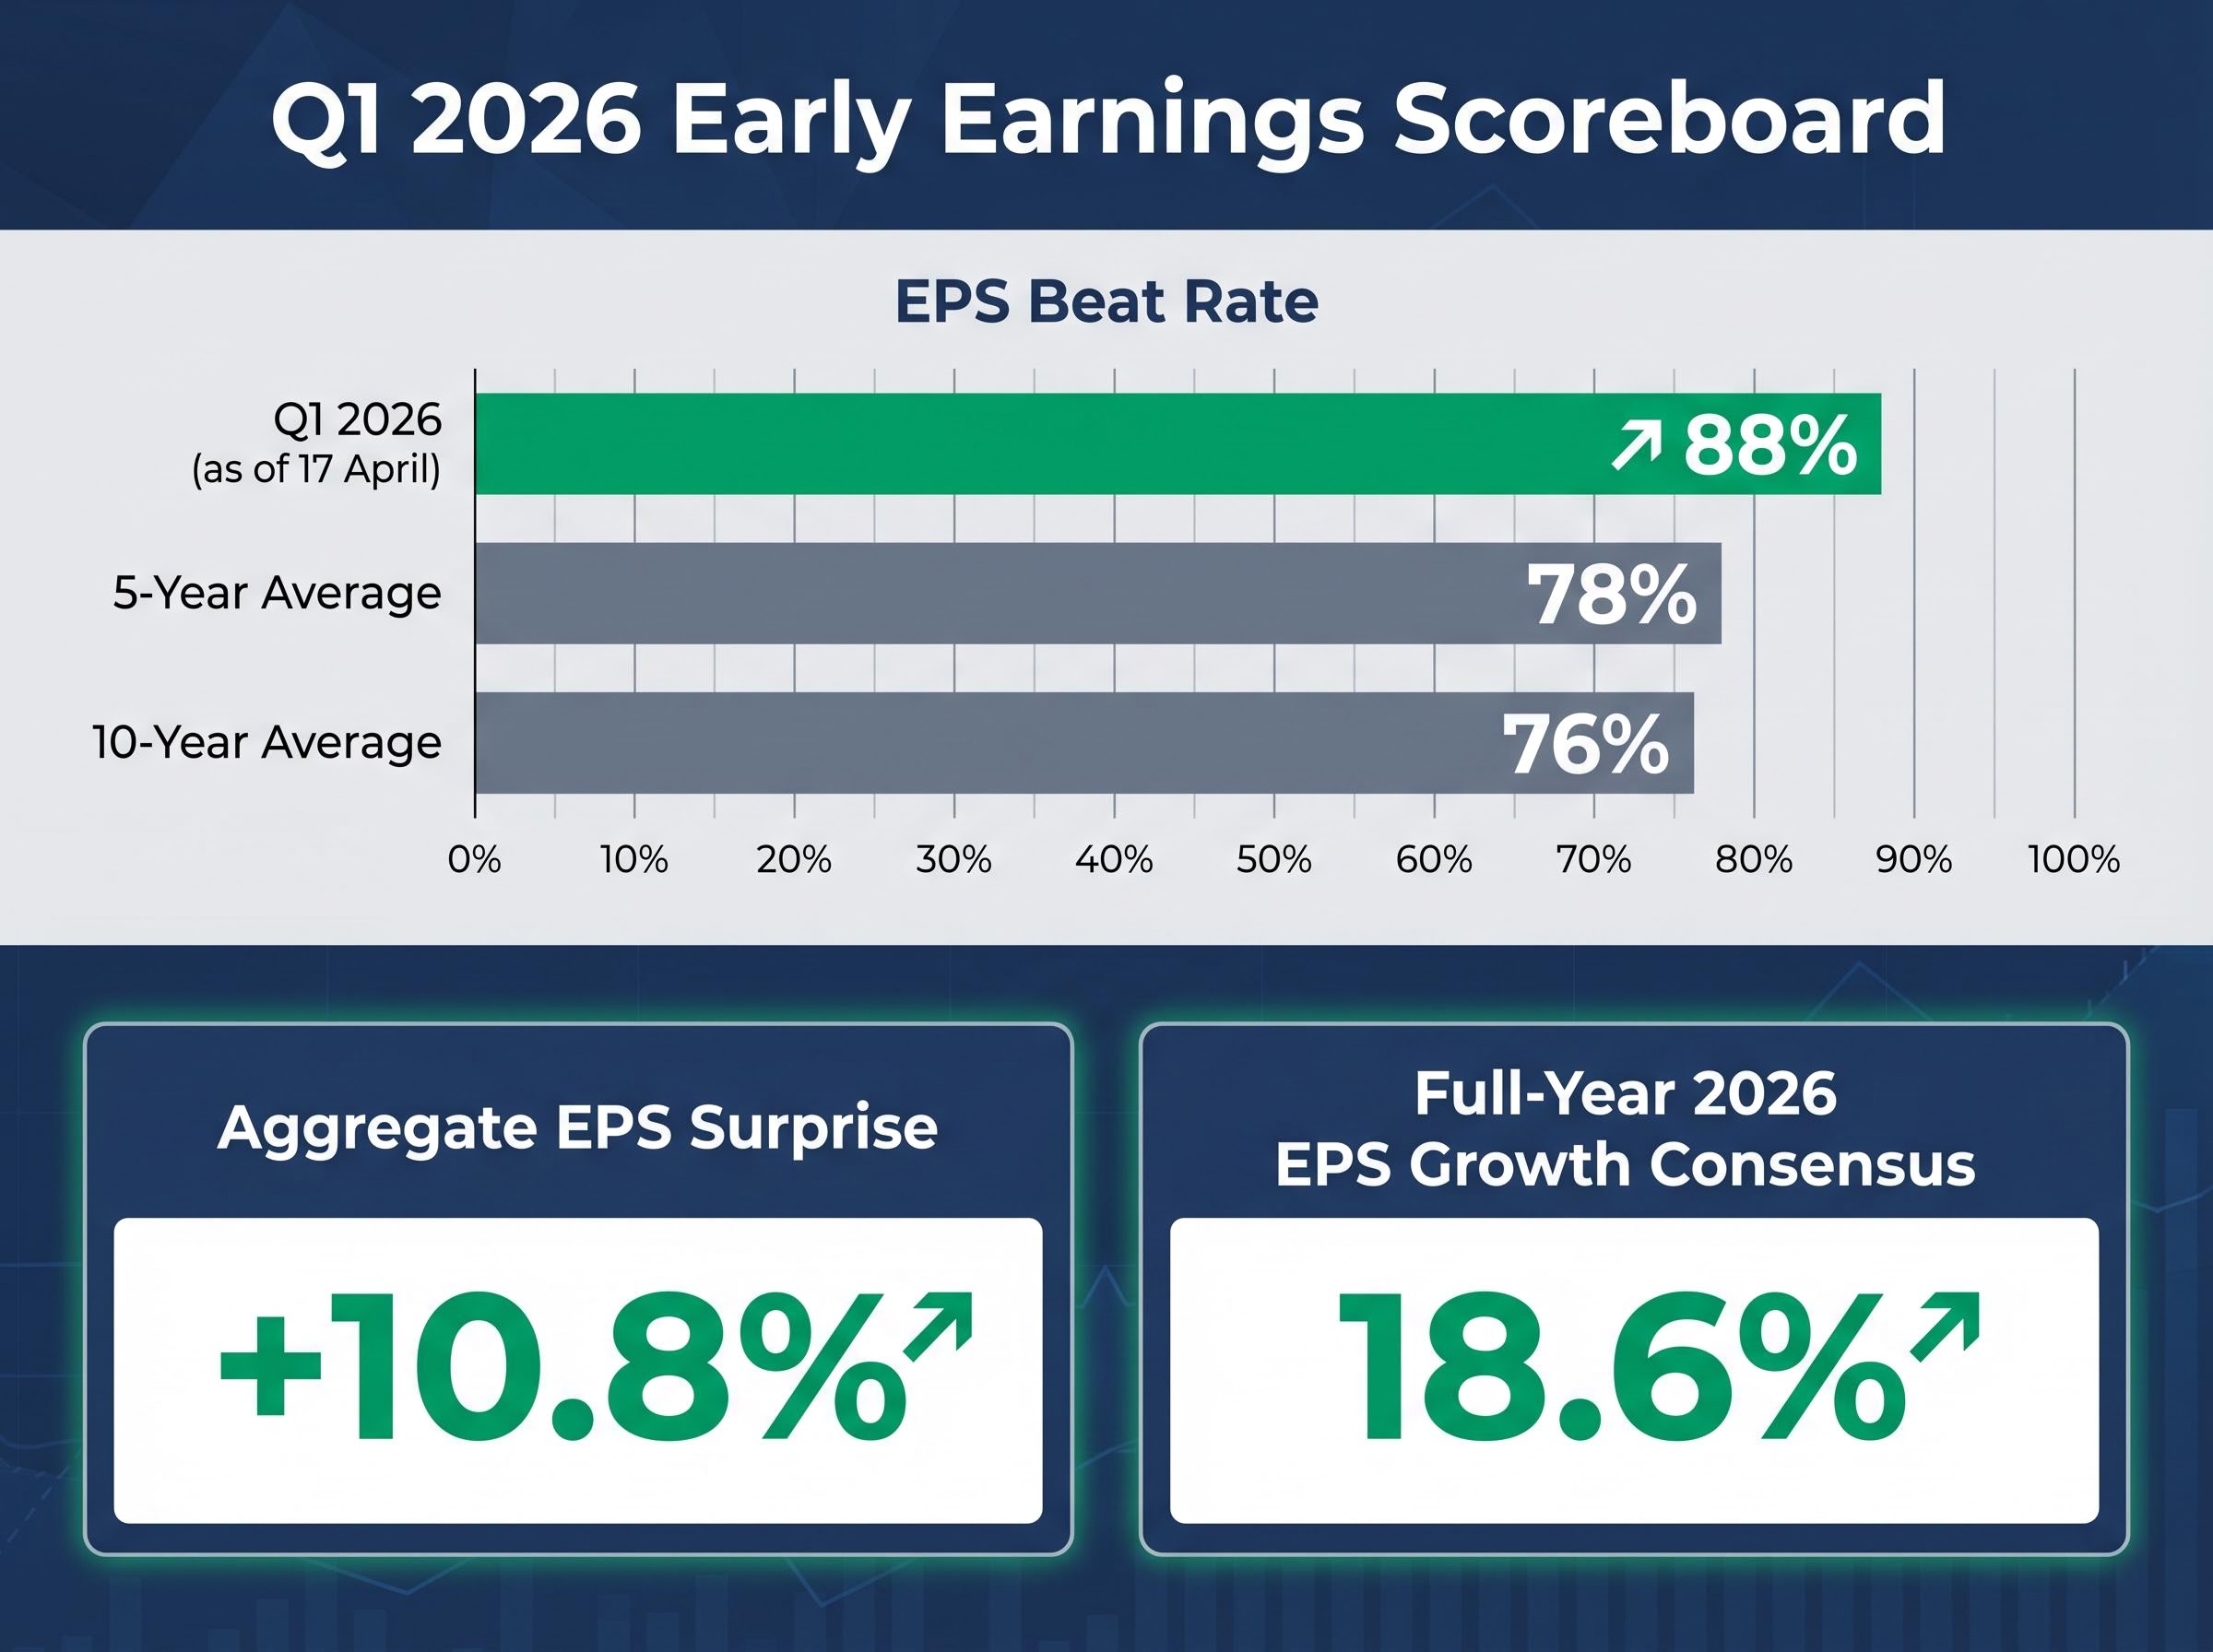
Full-year CY2026 S&P 500 EPS growth consensus stands at 18.6%, according to FactSet. If current beat rates hold, analysts project approximately 19% actual earnings growth for the quarter.
The FactSet Earnings Insight consensus data for CY2026 S&P 500 EPS growth places the full-year estimate at 18.6%, a figure that becomes the primary benchmark against which any downward guidance revision this week will be measured by institutional investors reassessing their annual outlooks.
| Metric | Value | Date / Source |
|---|---|---|
| Q1 EPS beat rate (early) | 88% | As of 17 April 2026 |
| Aggregate EPS surprise | +10.8% | As of 17 April 2026 |
| 5-year average beat rate | 78% | Historical |
| Full-year 2026 EPS growth consensus | 18.6% | FactSet |
| IT sector Q1 growth projection | +45.0% YoY | Pre-earnings consensus |
| Energy sector EPS revision | +12.9% to -0.1% | Commodity/hedging impact |
| VIX level | 19.31 | 23 April 2026 close |
The complication sits in the Energy sector. EPS estimates for the sector swung from +12.9% to -0.1%, driven directly by the Iran-related commodity price pressure and hedging losses that JPMorgan flagged as an embedded risk premium.
With beat rates already elevated, the market’s real focus this week shifts to forward guidance. Goldman Sachs analysis suggests potential US tariffs could add 5-10% to input costs in manufacturing and retail sectors, placing particular pressure on companies with significant commodity or import exposure.
Any downward revision to full-year guidance against that 18.6% consensus is likely to be the primary source of stock-specific volatility beyond the earnings-day implied moves themselves. Guidance language from industrial and consumer-facing names could prove more market-moving than the headline EPS figures.
Avis Budget: options markets project a post-earnings move of more than 29%, the largest single-stock projection in JPMorgan’s analysis this week.
That figure stops the scroll. Avis Budget has exhibited meme-stock-style volatility in recent quarters, and options pricing reflects the expectation that this earnings release will produce an outsized reaction in either direction. But the pattern of projected double-digit moves extends well beyond one name.
JPMorgan flagged several categories of stocks where earnings-week swings could be significant:
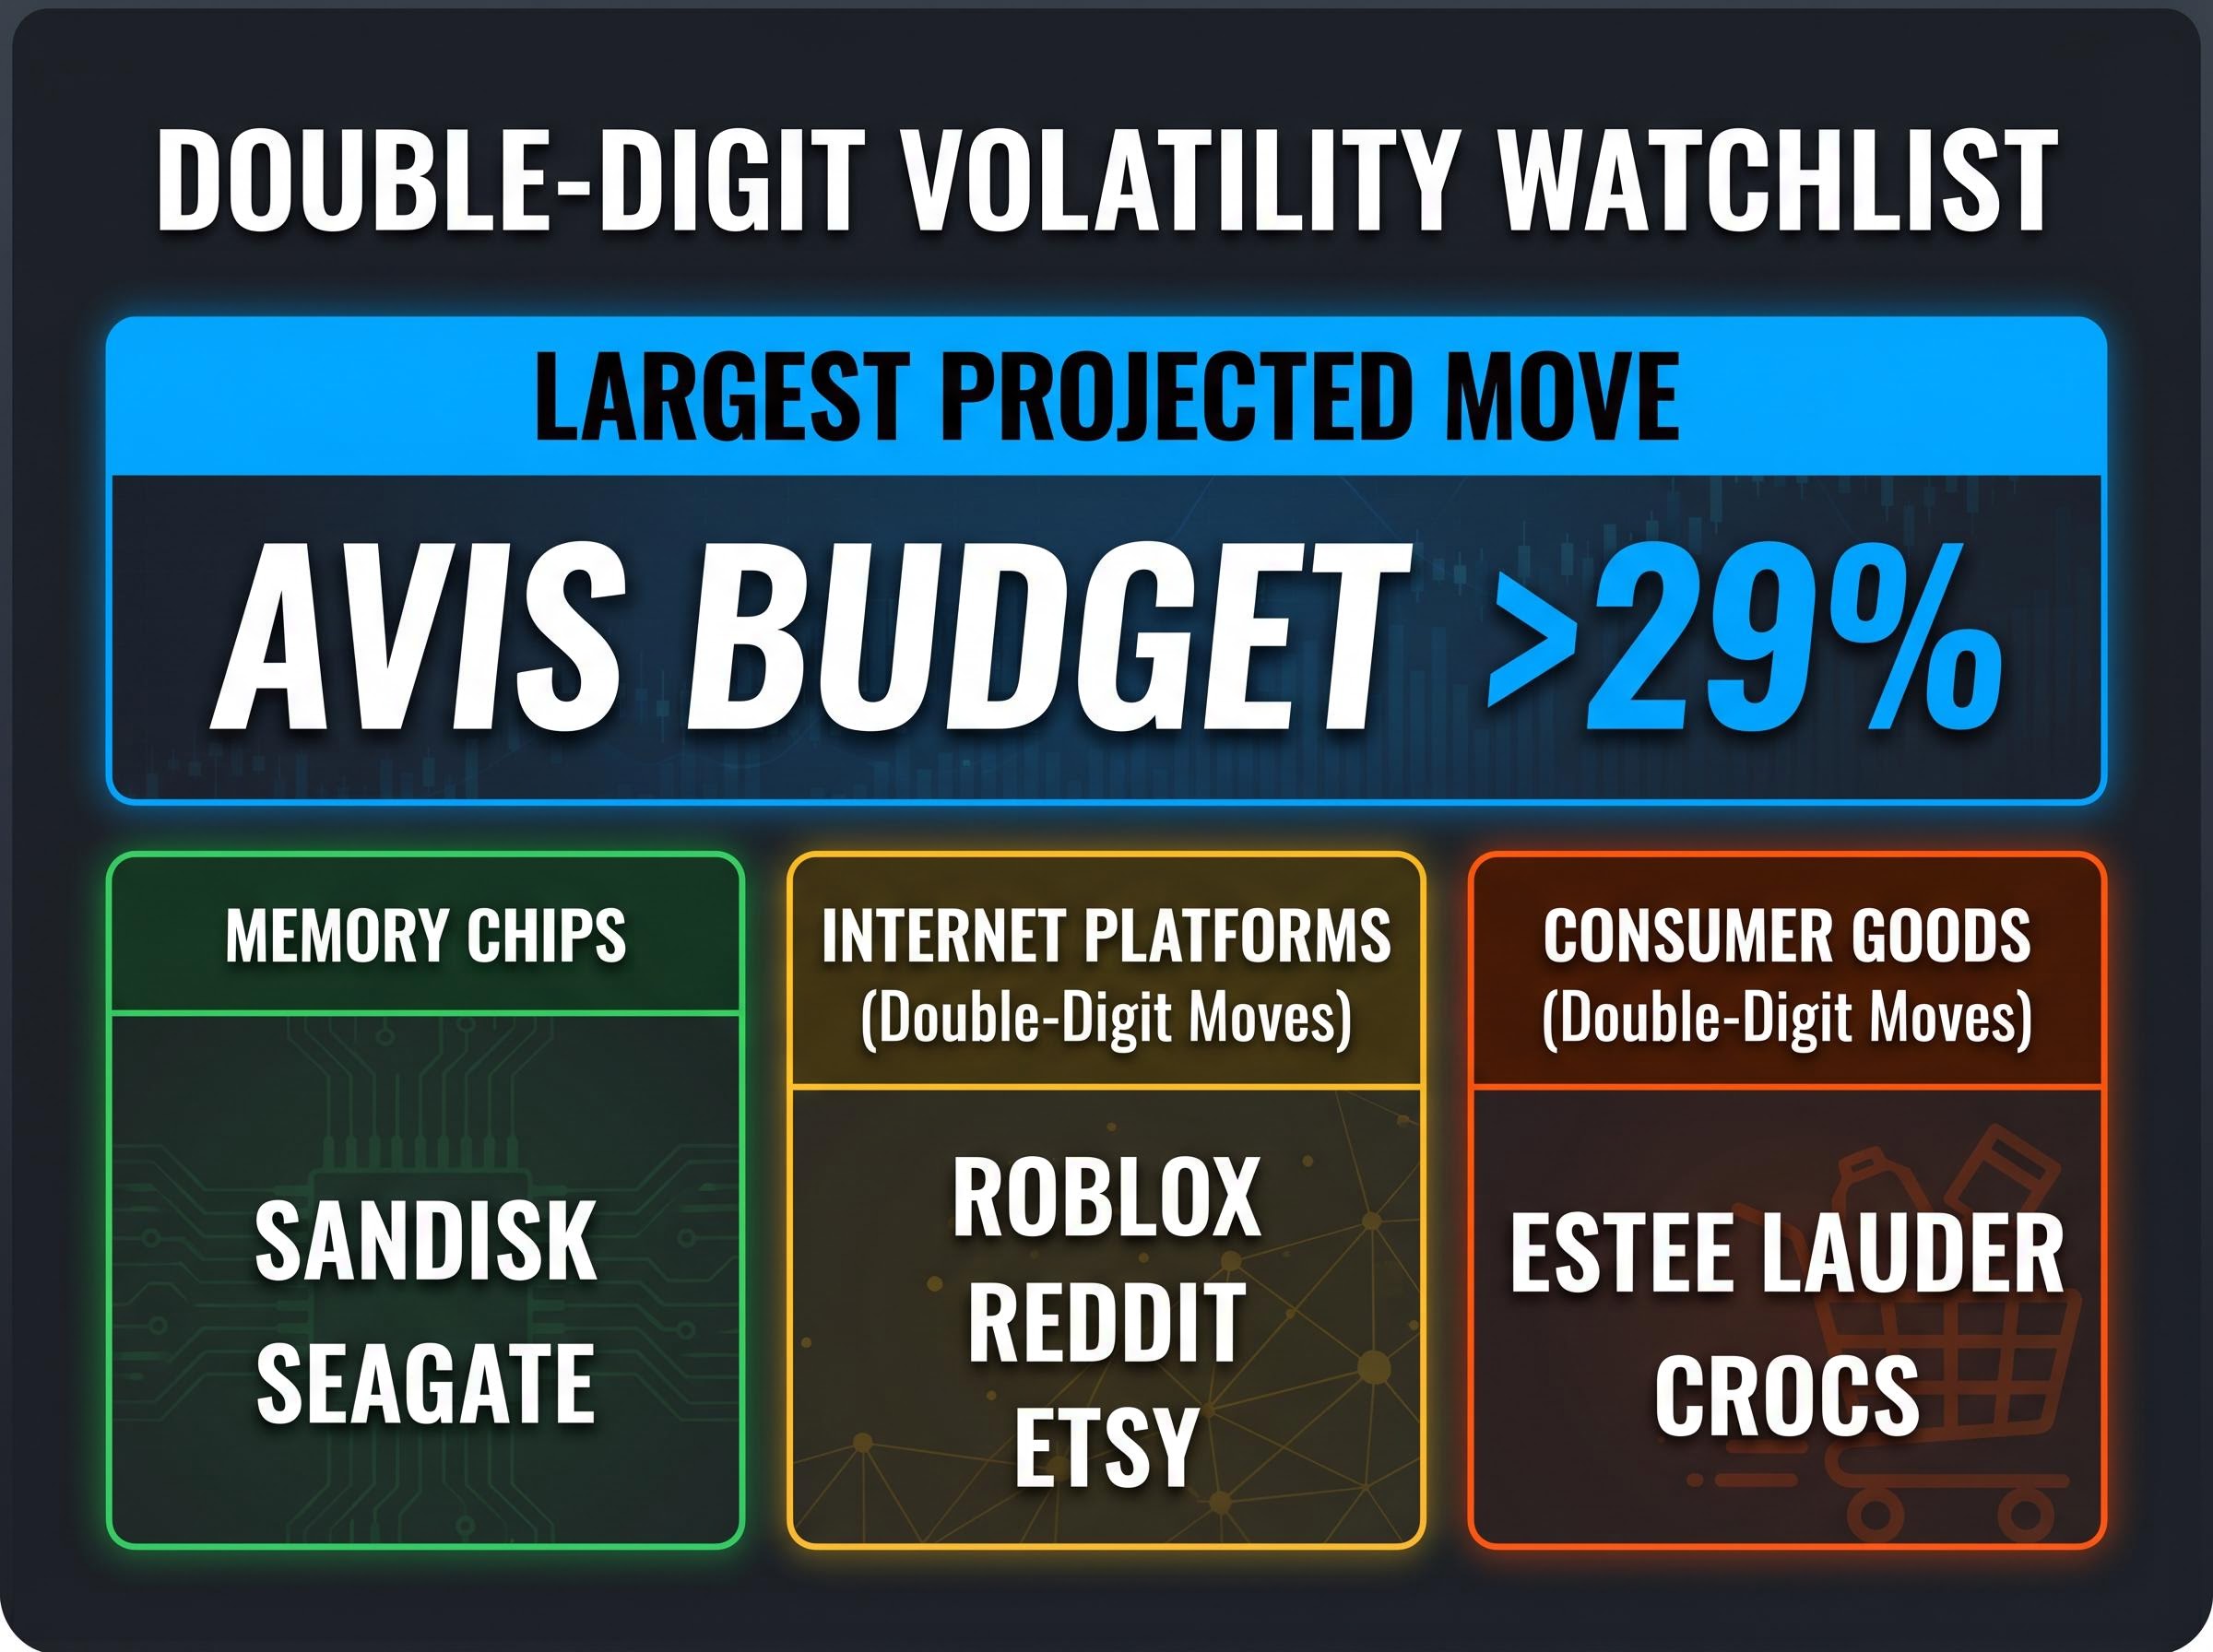
These projections reflect magnitude of expected move, not direction, consistent with the framing established earlier. Whether readers hold these stocks or are watching from the sidelines, the projected swings define the risk and reward calculus around each earnings release this week.
Investors wanting a structured method for identifying which names to position in before results land will find our deep-dive into KPI-based earnings screening valuable; it walks through Morgan Stanley’s approach of isolating the single operative metric most likely to drive a post-earnings surprise, with Datadog and DraftKings as worked examples from this same Q1 2026 season.
Options-implied moves represent the market’s consensus expectation of how much a stock’s price will shift after an earnings announcement. The figure is derived from options pricing and carries no directional signal. A 7% implied move for Meta means the options market expects Meta shares to move roughly 7% in either direction following results.
For anyone holding a position in a flagged name, “above-average implied volatility” translates to a wider band of potential outcomes in a compressed timeframe around the report date. Larger potential gains sit alongside larger potential losses, and the window in which that movement occurs is typically a single trading session.
Disciplined rebalancing through earnings-driven volatility consistently outperforms reactive selling — a dynamic supported by the current setup where the S&P 500’s roughly 30% year-on-year gain provides a meaningful cushion even as single-session implied moves reach 7% or more for individual names.
JPMorgan reported Q1 net income of $16.5 billion, up 13% year on year, with EPS of $5.94 against an estimate of $5.45. Bank of America posted Q1 net profit of $8.6 billion, up 17% year on year. These results indicate the fundamental backdrop remains constructive even as near-term volatility is elevated.
The S&P 500 is up approximately 30.64% year on year as of April 24, 2026, reflecting strong underlying market momentum. The early 88% beat rate with a 10.8% aggregate EPS surprise, combined with solid bank results, provides a fundamental offset to volatility fears. Guidance language and geopolitical overlays (oil prices, tariffs) remain the swing factors that options markets are currently pricing.
This article is for informational purposes only and should not be considered financial advice. Investors should conduct their own research and consult with financial professionals before making investment decisions. Past performance does not guarantee future results. Financial projections are subject to market conditions and various risk factors.
The central tension is clear: elevated implied volatility from JPMorgan’s warning sits alongside a genuinely strong early earnings season, and how that resolves depends heavily on guidance language from Big Tech on Wednesday and the individual-name reactions from wildcard movers such as Avis Budget.
The numbers framing the week are hard to ignore: half the Russell 1000 reporting, five Magnificent Seven names in a single week, a 29% projected swing on one stock, and an Iran-related geopolitical premium embedded in options pricing across the board. This week’s outcomes will shape the trajectory of the 18.6% full-year EPS growth consensus and set the tone for May, including Nvidia’s report expected around May 20. Earnings updates will be worth watching closely as results come in through the week.
Q1 earnings volatility refers to the magnitude of stock price swings that occur when companies report their first-quarter financial results. It matters because options markets price these expected moves in advance, giving investors a measurable risk window around each earnings release.
Avis Budget carries the largest projected post-earnings swing at more than 29%, while among mega-cap tech names Meta leads with a projected move of over 7%, followed by Amazon at approximately 6.5%, Microsoft at approximately 6%, and Alphabet at approximately 4%.
An options-implied move is the market's consensus estimate of how much a stock will shift in price after an earnings announcement, with no directional signal attached. A 7% implied move on Meta, for example, means the stock could rise or fall roughly 7% in a single session following its results.
JPMorgan flagged elevated implied moves because approximately half of the Russell 1000, which covers roughly 93% of US equity market capitalisation, is reporting within a single five-day window, compounded by a geopolitical risk premium tied to Iran-related oil price pressure pushing the VIX to 19.31.
Early results are notably strong, with 88% of reporting S&P 500 companies beating EPS estimates by an aggregate surprise of 10.8% as of April 17, 2026, well above the five-year average beat rate of 78% and the 10-year average of 76%.


