
Every major tracked economy is expanding right now, and almost nobody in your feed is framing it that way. That gap between what the data says and what the narrative says is the story.
The four largest developed economies all posted expansion in their final August 2026 PMI readings: the US at 56.0, Japan at 53.5, the UK at 52.5, and the eurozone at 52.0. All comfortably above the line that separates growth from contraction. Flash figures for September land tomorrow, on 23 September 2026, which makes this the moment to understand the signal before the next print arrives.
After reading this, you will know what these readings actually measure, why four economies expanding at once matters more than any single one of them, and how to use that signal without treating it as more than it is.
What PMI readings actually measure, and why they move markets
On a screen, a PMI is deceptively simple. One number, a threshold of 50, and a direction. Above 50 means expansion, below means contraction, and the further from 50, the faster the change.
What sits behind that number is a monthly survey. S&P Global sends questionnaires to purchasing managers at private-sector firms, the people who actually order inventory and hire staff, and asks whether activity rose, fell, or held steady versus the prior month. Those responses are aggregated into what statisticians call a diffusion index: a measure that captures the balance of firms reporting improvement against those reporting decline.
The survey typically covers three core components:
- New orders, which capture forward demand
- Output, which measures current production or activity levels
- Employment, which reflects hiring intentions
Empty line after the list, and now the distinction that matters most for your positioning.
There are two versions of every release. Flash PMIs land first, built from roughly 80-90% of responses. Final PMIs follow later, once the full sample is in.
S&P Global on flash data Flash readings are calculated from approximately 80-90% of total survey responses and are designed to provide an “accurate early indication” of the final figure, while explicitly acknowledging the partial-sample basis.
The two can differ, and the gap is not trivial. In August 2026, the US flash Manufacturing PMI came in at 53.2. The final reading was 53.9, a 0.7-point upward revision from the remaining responses alone.
That is the mechanism made concrete. If you had positioned around the flash number, you were working off a figure that final data moved by nearly a full point. The revision risk is quantifiable, not theoretical.
PMIs earn their keep because they arrive faster than GDP or industrial output data. They give you a directional read on business conditions weeks before hard numbers confirm or contradict it. Tomorrow’s flash releases are timed accordingly: eurozone at 08:00 UTC, UK at 08:30 UTC, and the US at 13:45 UTC.
PMI market pricing works on a lead-lag dynamic that makes the surprise component of any print more consequential than the absolute level: equity markets typically absorb PMI trends 3-30 months before official releases, so a reading of 56.0 that matches consensus moves less than a reading of 53.0 that beats by two points.
When big ASX news breaks, our subscribers know first
The August 2026 data across four economies: what expansion looks like in practice
One economy above 50 is a data point. It tells you a single country had a decent month.
Two above 50 starts to look less like coincidence. Three suggests a pattern. Four major developed economies expanding simultaneously is a signal you should take seriously, and that is exactly what the August 2026 final readings show.
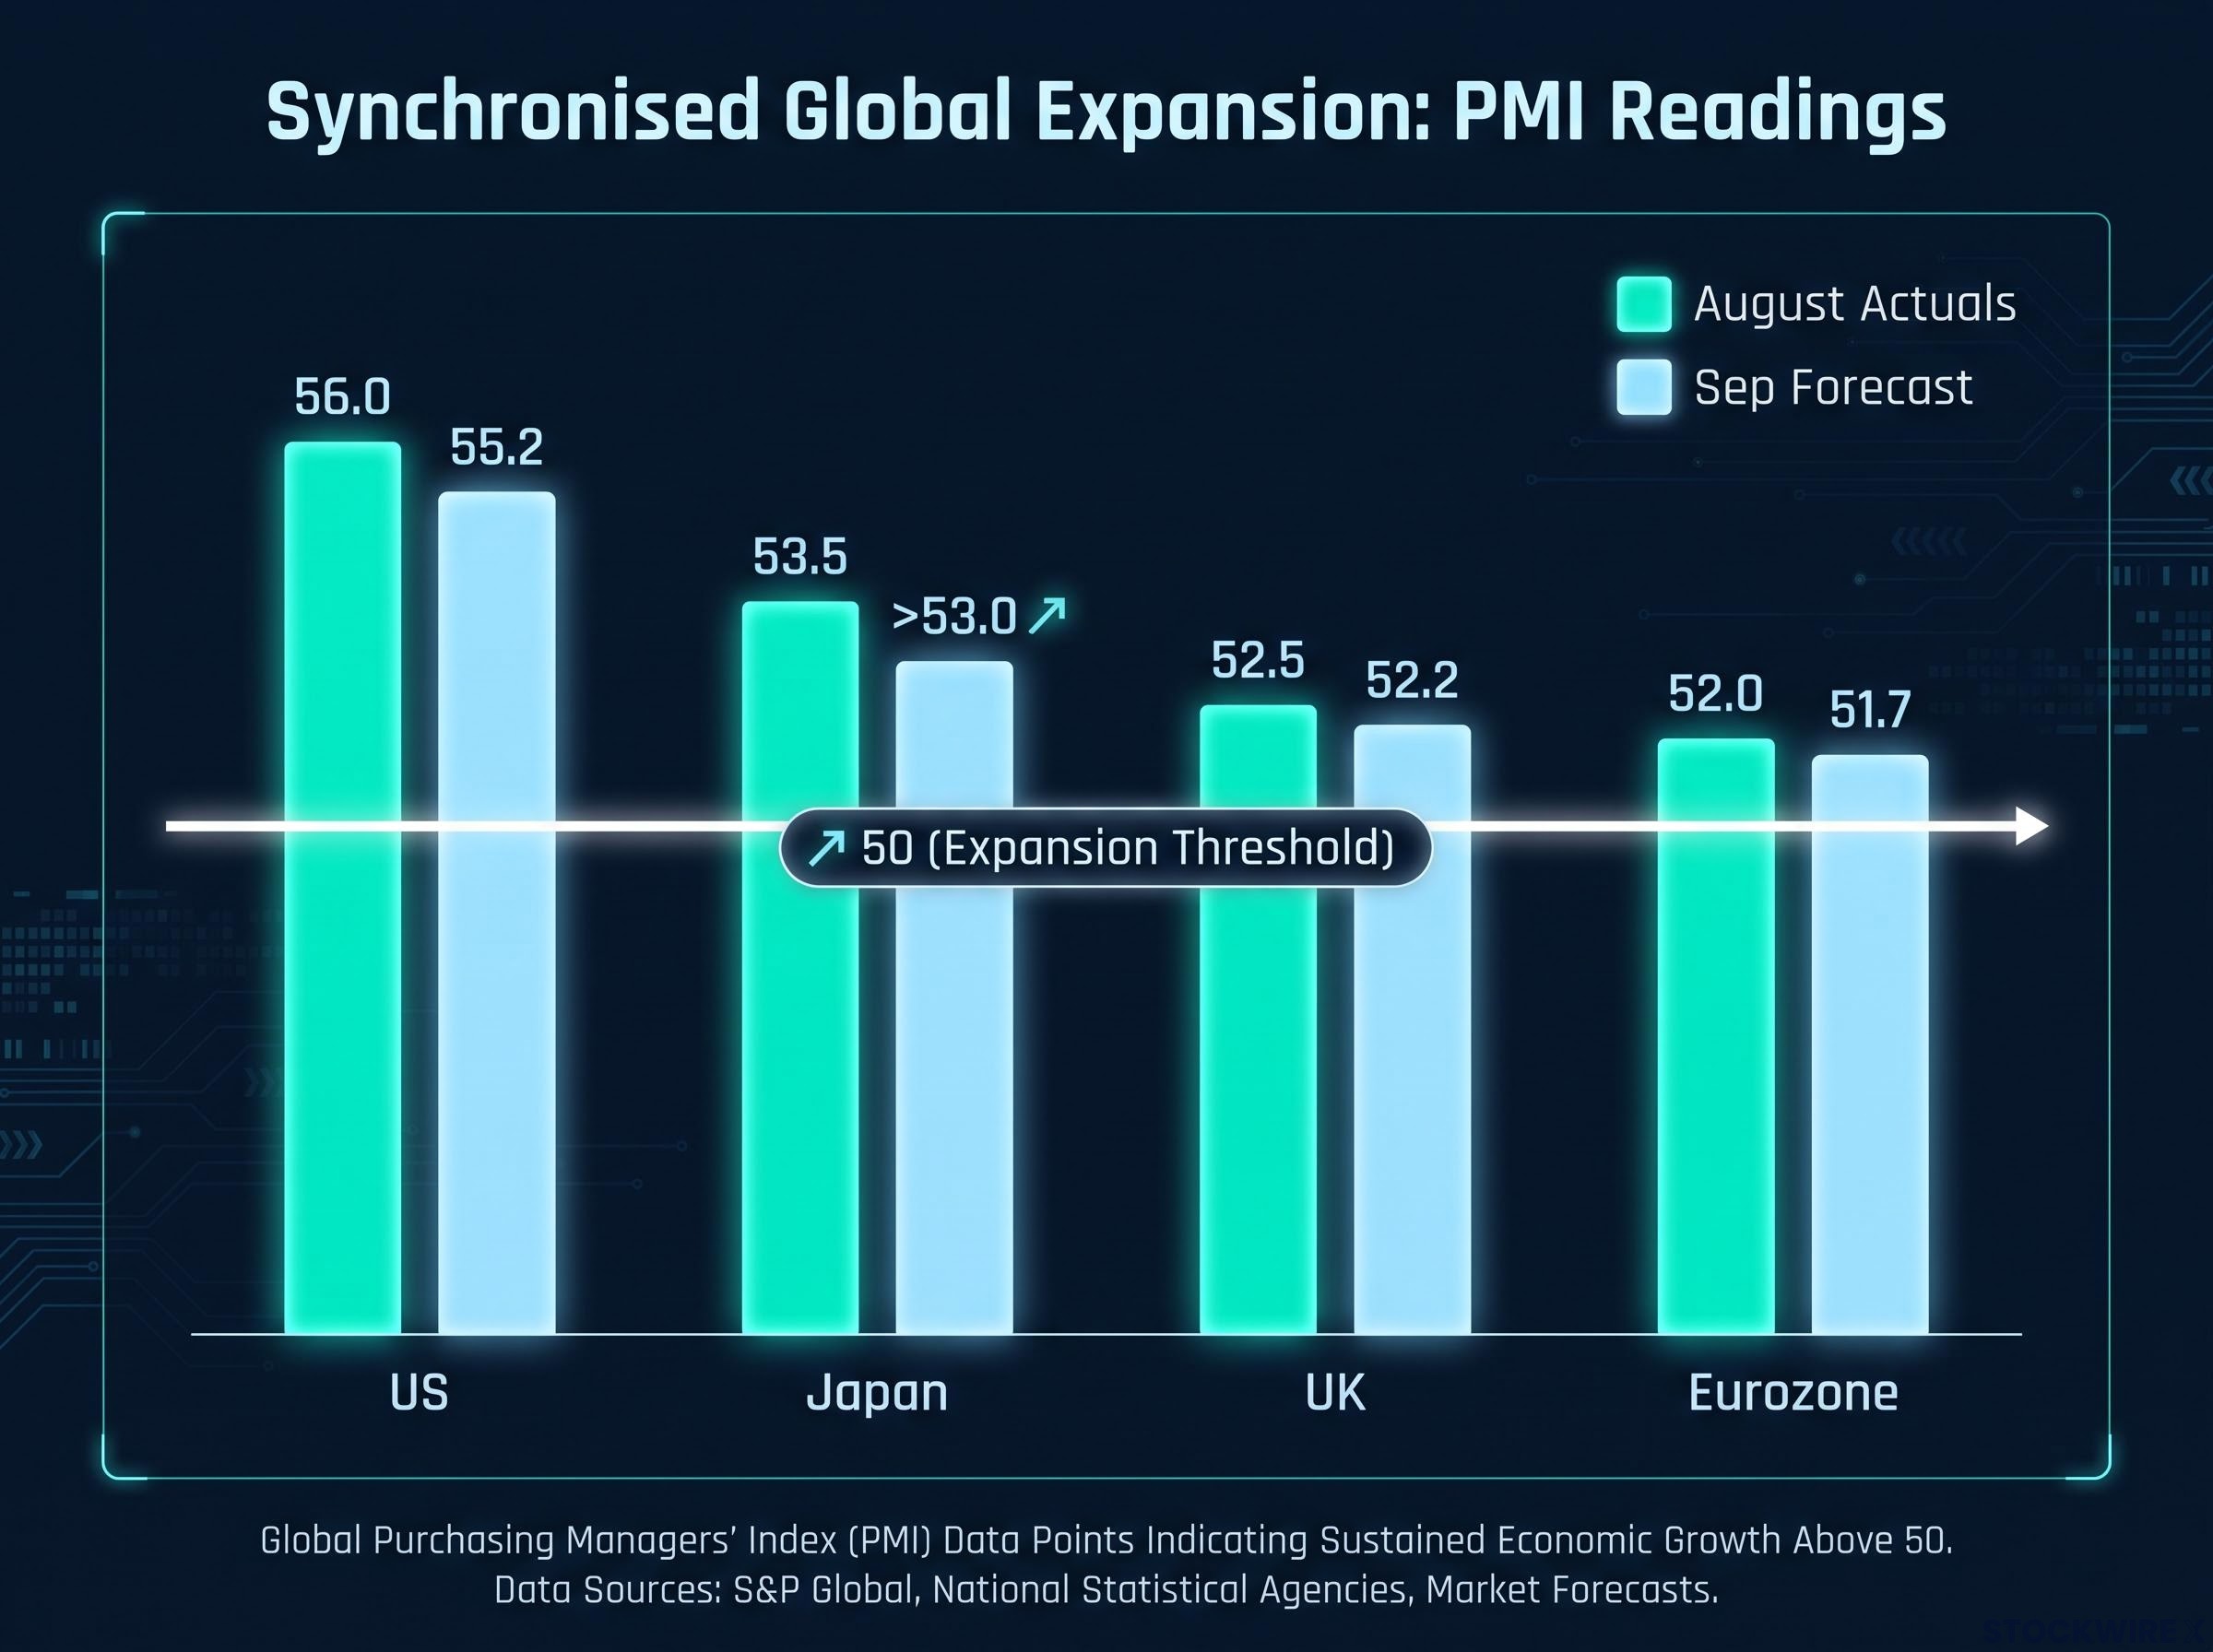
Japan is where the expansion strengthened most visibly. The composite rose to 53.5 from 52.7 in July. Services climbed to 52.5 from 51.2, and manufacturing improved to 54.9 from 54.5. All three exceeded their flash estimates, which is the opposite of the flash-overstates-reality risk described above.
The US composite sat at 56.0, the strongest of the four. Its manufacturing reading held at 53.9 for a third consecutive month, and that consistency matters more than the number itself.
A one-month spike is noise. Three months at the same level is a plateau, and a plateau is evidence that expansion is durable rather than transient. For deciding whether recent strength is real, that distinction is the whole question.
| Economy | Aug 2026 Composite | Aug 2026 Manufacturing | Aug 2026 Services | Sep 2026 Composite Forecast |
|---|---|---|---|---|
| United States | 56.0 | 53.9 | Not yet published | 55.2 |
| United Kingdom | 52.5 | Not yet published | Not yet published | 52.2 |
| Eurozone | 52.0 | Not yet published | Not yet published | 51.7 |
| Japan | 53.5 | 54.9 | 52.5 | Above 53.0 |
The September consensus forecasts keep all four in expansion: US composite at 55.2, UK at 52.2, eurozone at 51.7, and Japan above 53.0. Analysts expect growth to continue even as it eases slightly.
Fisher Investments on mid-2026 conditions PMI readings through mid-2026 show “greater business resilience than widely appreciated,” with economic conditions appearing healthier than prevailing narratives suggest.
Read as separate national reports, this looks like a few countries doing okay. Read as one coordinated dataset, it reframes to something sharper: the major developed economies are in a synchronised expansion phase. That is the finding that contradicts the pessimism narrative most directly, and it is why S&P Global described the trend on 24 July 2026 as signalling “faster growth across major developed economies.”
The August reading is the second consecutive month of synchronised G4 expansion, and the July edition of that signal already had identifiable portfolio implications: cyclical sectors including industrials, materials, consumer discretionary, and semiconductors historically outperform during coordinated multi-economy up-cycles, while FX strategy shifts away from growth-differential trades toward policy divergence analysis.
Where PMIs mislead: the limits of reading a single number above 50
Here is where the assumption you may have just formed deserves scrutiny. Above 50 is expansion, yes. But a composite number can look perfectly healthy while concealing real fragility underneath.
The four limitations worth holding in mind:
- Composite masking, where a strong sector hides a weak one
- Flash revision risk, where the early number moves
- Direction, not magnitude, which the index cannot capture
- Sentiment versus hard data, which can diverge quickly
Empty line, then the mechanics of each.
A composite PMI blends manufacturing and services into one figure. That means a strong services sector can keep the headline above 50 even when manufacturing is soft, and the reverse holds too. The composite tells you the net direction, not the internal balance.
The UK is the live example. Goldman Sachs’ September 2026 preview noted the UK composite is “pressured by weaker consumer high-frequency data despite resilient restaurant bookings and air travel.” The composite stayed above 50 because strength in dining and travel offset softness elsewhere.
That is not a comforting finding. It means the headline is doing the work of concealing a deteriorating consumer picture, and if you read only the composite, you miss that entirely.
Then there is momentum. In July 2026, S&P Global noted US factory output growth had slowed to a four-month low even as the PMI stayed robust. Above 50 and decelerating are not contradictions; they coexist, and the forecast drift confirms it, with the US easing from 56.0 to 55.2 and the eurozone from 52.0 to 51.7.
Manufacturing versus services divergence has been the structural feature of 2026 data throughout: the global composite PMI fell to 50.8 in April while manufacturing accelerated to 51.5 and services decelerated to 50.2, confirming that a single composite headline can hold steady even as the internal composition shifts in directions that matter for sector allocation.
S&P Global on the outlook Faster growth across major developed economies comes with a caveat: “supply-chain and price concerns cloud outlook,” meaning cost pressures can erode margins even as activity volumes rise.
Flash vs. final readings: why the early number is not the last word
Because flash PMIs use only 80-90% of responses, the remaining 10-20% can shift the final figure materially. That last slice of data is not filler; it can move the number across a threshold that changes how the print reads.
The August 2026 US Manufacturing PMI is the case study. Flash came in at 53.2, final at 53.9, a 0.7-point revision that crossed a perceptible line between soft and solid.
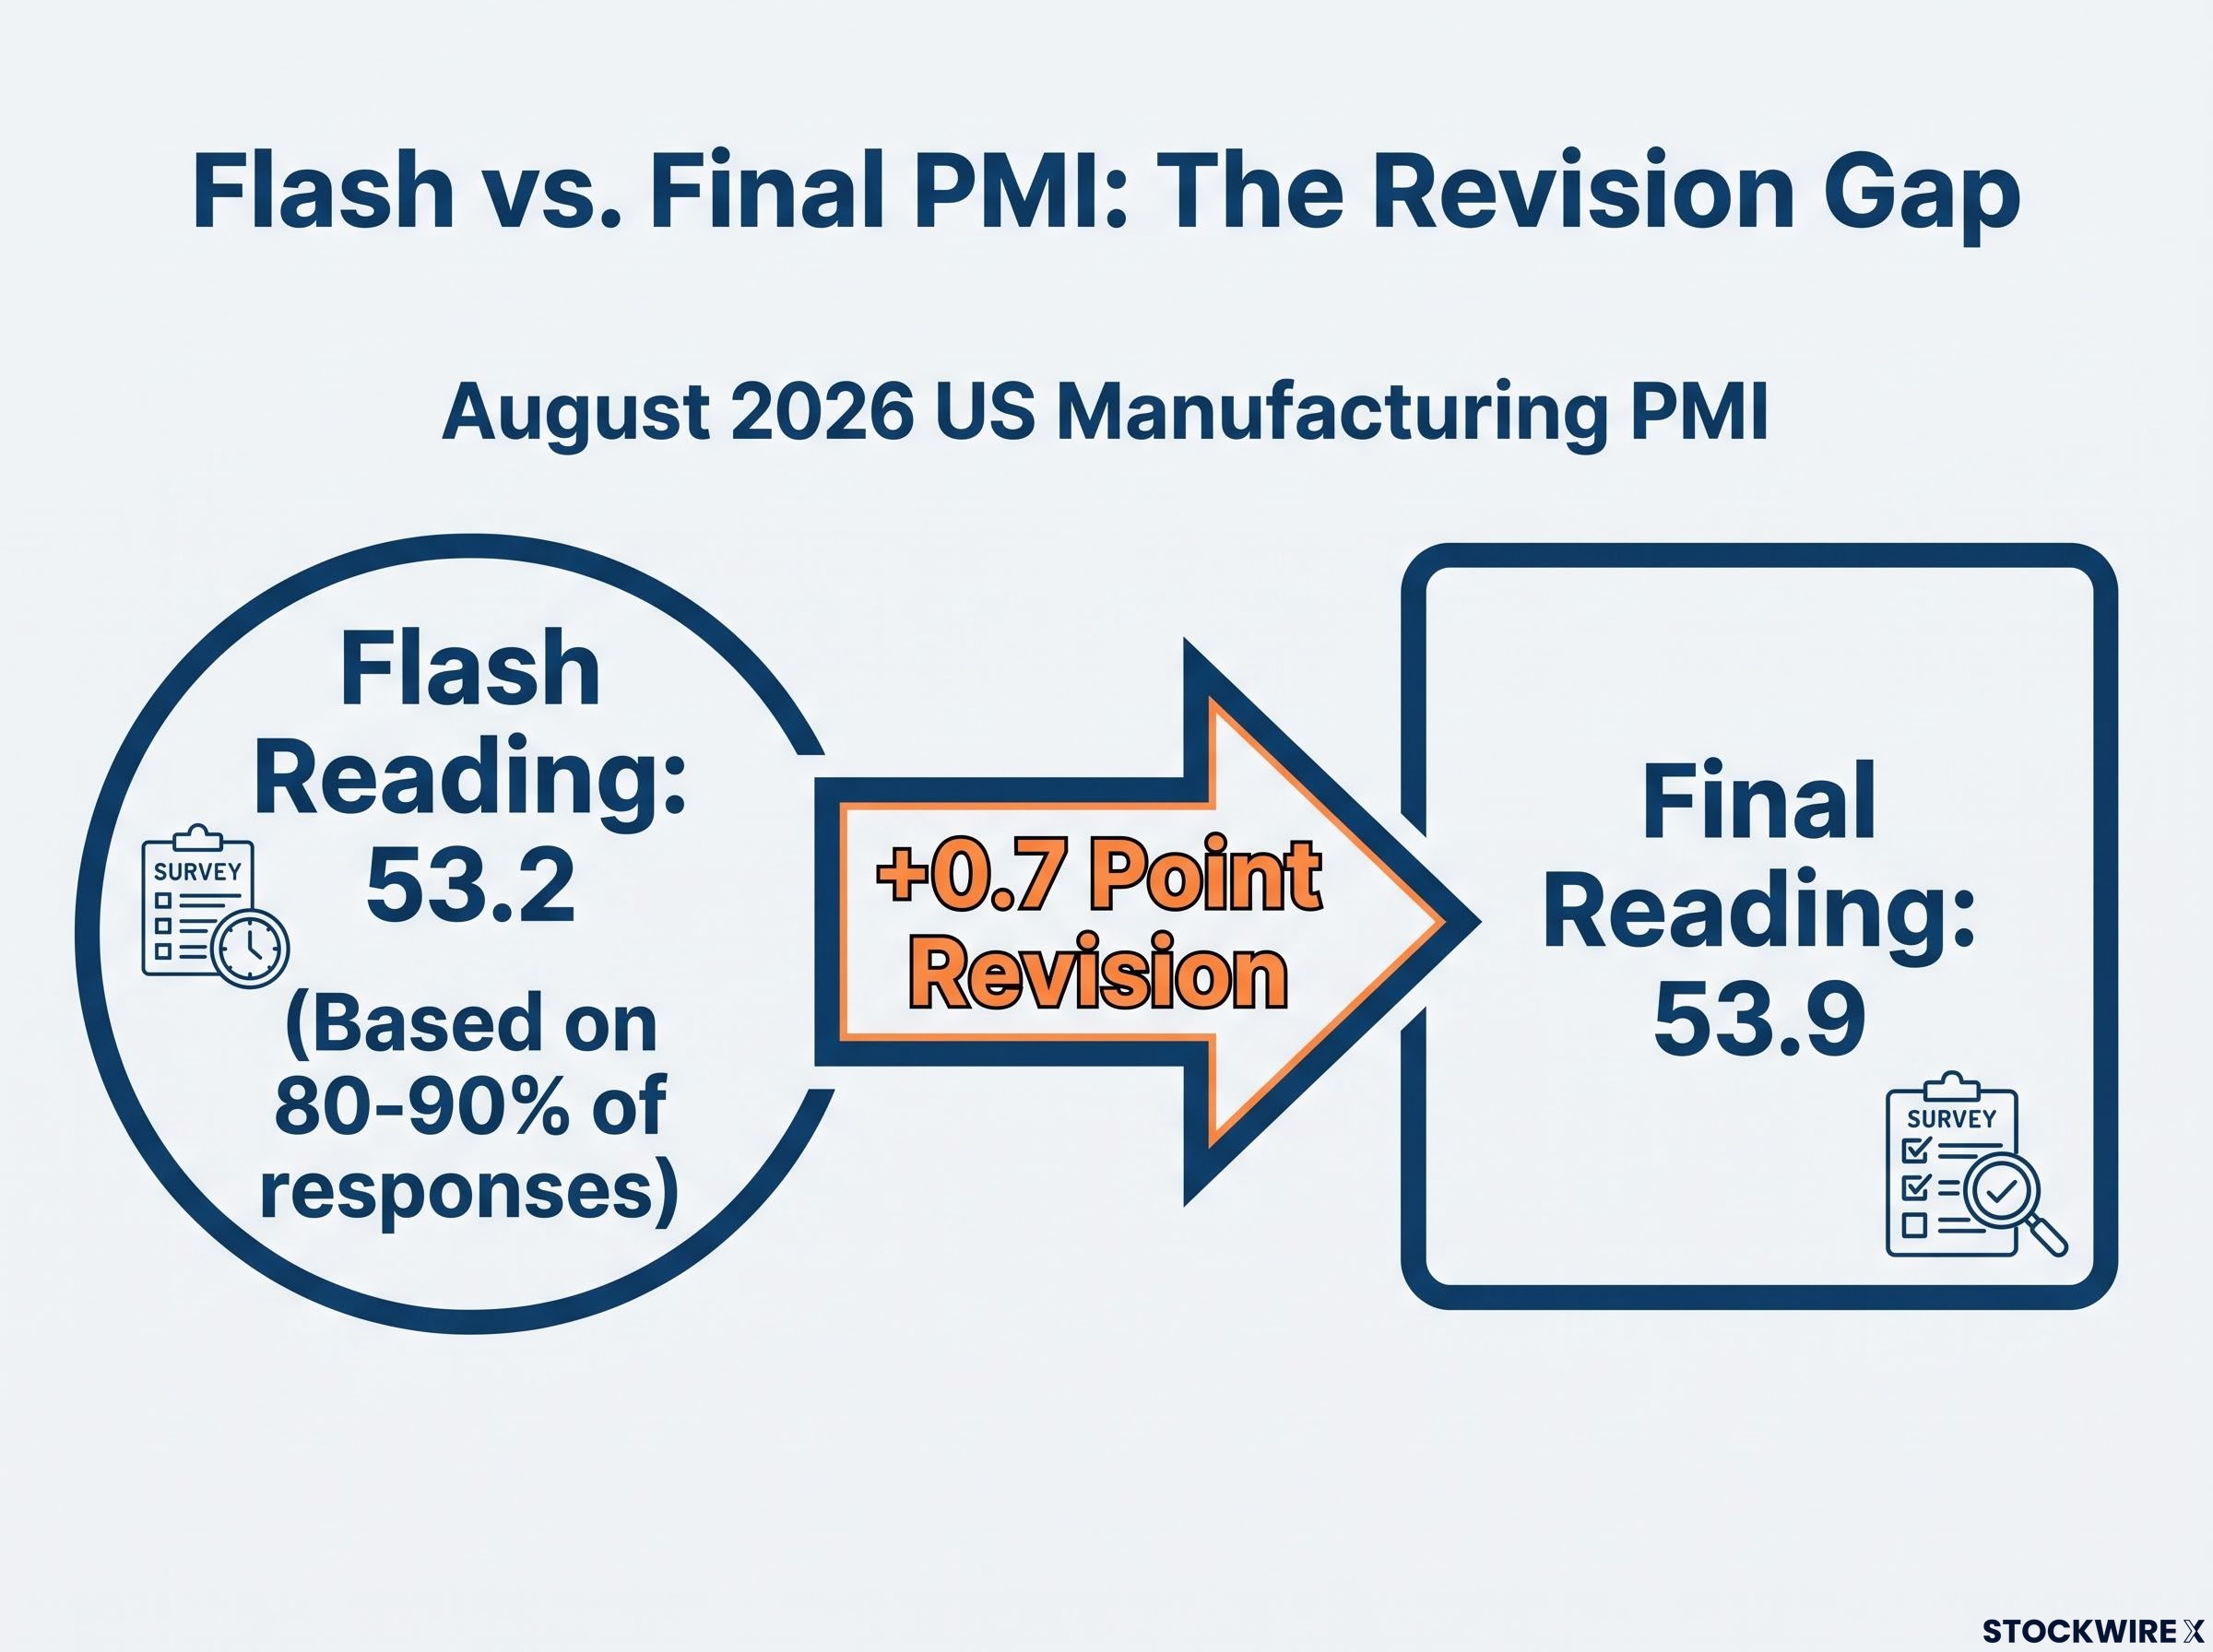
If you make allocation decisions in the window between a flash release and the final reading, that gap is operationally relevant. You are acting on a provisional number, and provisional numbers get revised.
How investors can put sustained global PMI expansion to practical use
None of this is a call to action. It is a framework for how sustained expansion should sit in your thinking, including what it licenses and what it does not.
Four steps, in sequence:
- Treat expansion as a counterweight to pessimism. Four economies above 50 through Q1, Q2, and into Q3 2026 is hard evidence against aggressive de-risking based on sentiment alone. Fisher Investments’ view that conditions are healthier than narratives suggest is grounded in exactly this data.
- Use sector and country detail for regional tilt. Broad-based Japanese expansion, with manufacturing around 54.8 and services around 52.6 per Newsquawk, supports a different posture toward Japanese equities than a reading where only services were growing. The detail informs the emphasis.
- Watch the trend, not the single reading. The small, consistent forecast declines (US from 56.0 to 55.2, eurozone from 52.0 to 51.7) are your early-warning system for decelerating momentum. A drift lower is a reason to watch, not to exit.
- Pair PMIs with hard data. Goldman Sachs’ note on weaker UK consumer data beneath the composite is the reminder that PMIs lead direction but do not confirm magnitude. Cross-check them against earnings, inflation, and consumer spending before major decisions.
Central bank divergence adds a second interpretive layer to the PMI picture: in the same week that August data confirmed all four economies in expansion, the Fed raised rates to 3.75%-4.00%, the Bank of England held at 3.75%, and the Bank of Japan raised to 1.25%, three different policy conclusions drawn from the same global backdrop.
Empty line after the list.
The actionable finding is this: all four economies remain in expansion while pessimistic narratives dominate the coverage. If you use PMI data alongside hard indicators, you are better positioned to calibrate risk than someone defaulting to whichever macro story is loudest that week.
This article is for informational purposes only and should not be considered financial advice. Investors should conduct their own research and consult with financial professionals before making investment decisions.
Past performance does not guarantee future results, and forecasts are subject to market conditions and various risk factors.
What the September 2026 flash data will and will not resolve
Tomorrow the flash readings land. It helps to know in advance what they can settle and what they cannot.
The 23 September 2026 releases are the next data event in a trend, not a verdict on global health. They will give you a directional read on whether momentum carried into September. They will not confirm the magnitude of growth, resolve the sector divergences hidden inside composites, or count as final data, because revisions still follow.
Your reference points for reading the headlines:
- Eurozone, 08:00 UTC, August actual 52.0, September consensus 51.7
- UK, 08:30 UTC, August actual 52.5, September consensus 52.2
- US, 13:45 UTC, August actual 56.0, September consensus 55.2
- Japan composite, August actual 53.5, September consensus above 53.0
Empty line after the list.
Note that every forecast sits above 50 but drifts slightly below August. That is your calibration anchor. A US print of 54.9 against a consensus of 55.2 should register as a modest miss still firmly in expansion, not as a trigger for either relief or alarm.
The US flash carries extra interpretive weight because S&P Global market descriptions frame it as “the first full-month read on post-Fed momentum.” It is the clearest early look at how the economy is absorbing the latest policy backdrop.
Synthesised, the argument is straightforward. Sustained expansion across the US, UK, eurozone, and Japan through Q1, Q2, and into Q3 2026 is a durable signal that global business conditions are healthier than the pessimism narrative allows. Durability is not the same as strength, and the reader who reads the signal carefully is better positioned than the one who reads only the headline.
Reading PMI expansion correctly in a world designed to make you doubt it
Four major developed economies above 50, at once, for two full quarters and into a third, is the evidence base. You now have the tools to weigh it rather than accept or reject it on the strength of whatever narrative happens to be loudest.
Two skills have come out of this. You understand the mechanism behind a PMI number, how the survey works and why flash and final can diverge, and you understand the specific ways that number can mislead, from composite masking to slowing momentum beneath a healthy headline. Watch tomorrow’s flash data with that in hand: not as a verdict, but as the next point in a trend that has held above 50 for two quarters running.