
Why Barclays Sees 56% Upside in a Beaten-Down Automation Stock
1 hr ago

The global composite Purchasing Managers’ Index (PMI) declined to 50.8 in April 2026, its third consecutive month of deceleration. In the same period, US nonfarm payrolls added 115,000 jobs, comfortably beating consensus. One number signals a cooling world economy; the other signals a resilient one. Both are true at once, and the tension between them defines the global economic outlook heading into the second quarter.
The week of 4-8 May 2026 delivered a dense sequence of data releases across the US, UK, eurozone, Japan, and China. Taken together, they paint a global economy that is neither accelerating nor collapsing but fracturing along regional and sectoral fault lines that investors cannot afford to read as uniform. What follows synthesises the April 2026 PMI, labour market, trade, and retail sales data across five major economies, identifies the structural divergence driving the headline noise, assesses the geopolitical distortion hiding in China’s numbers, and sets up what to watch in this week’s data slate.
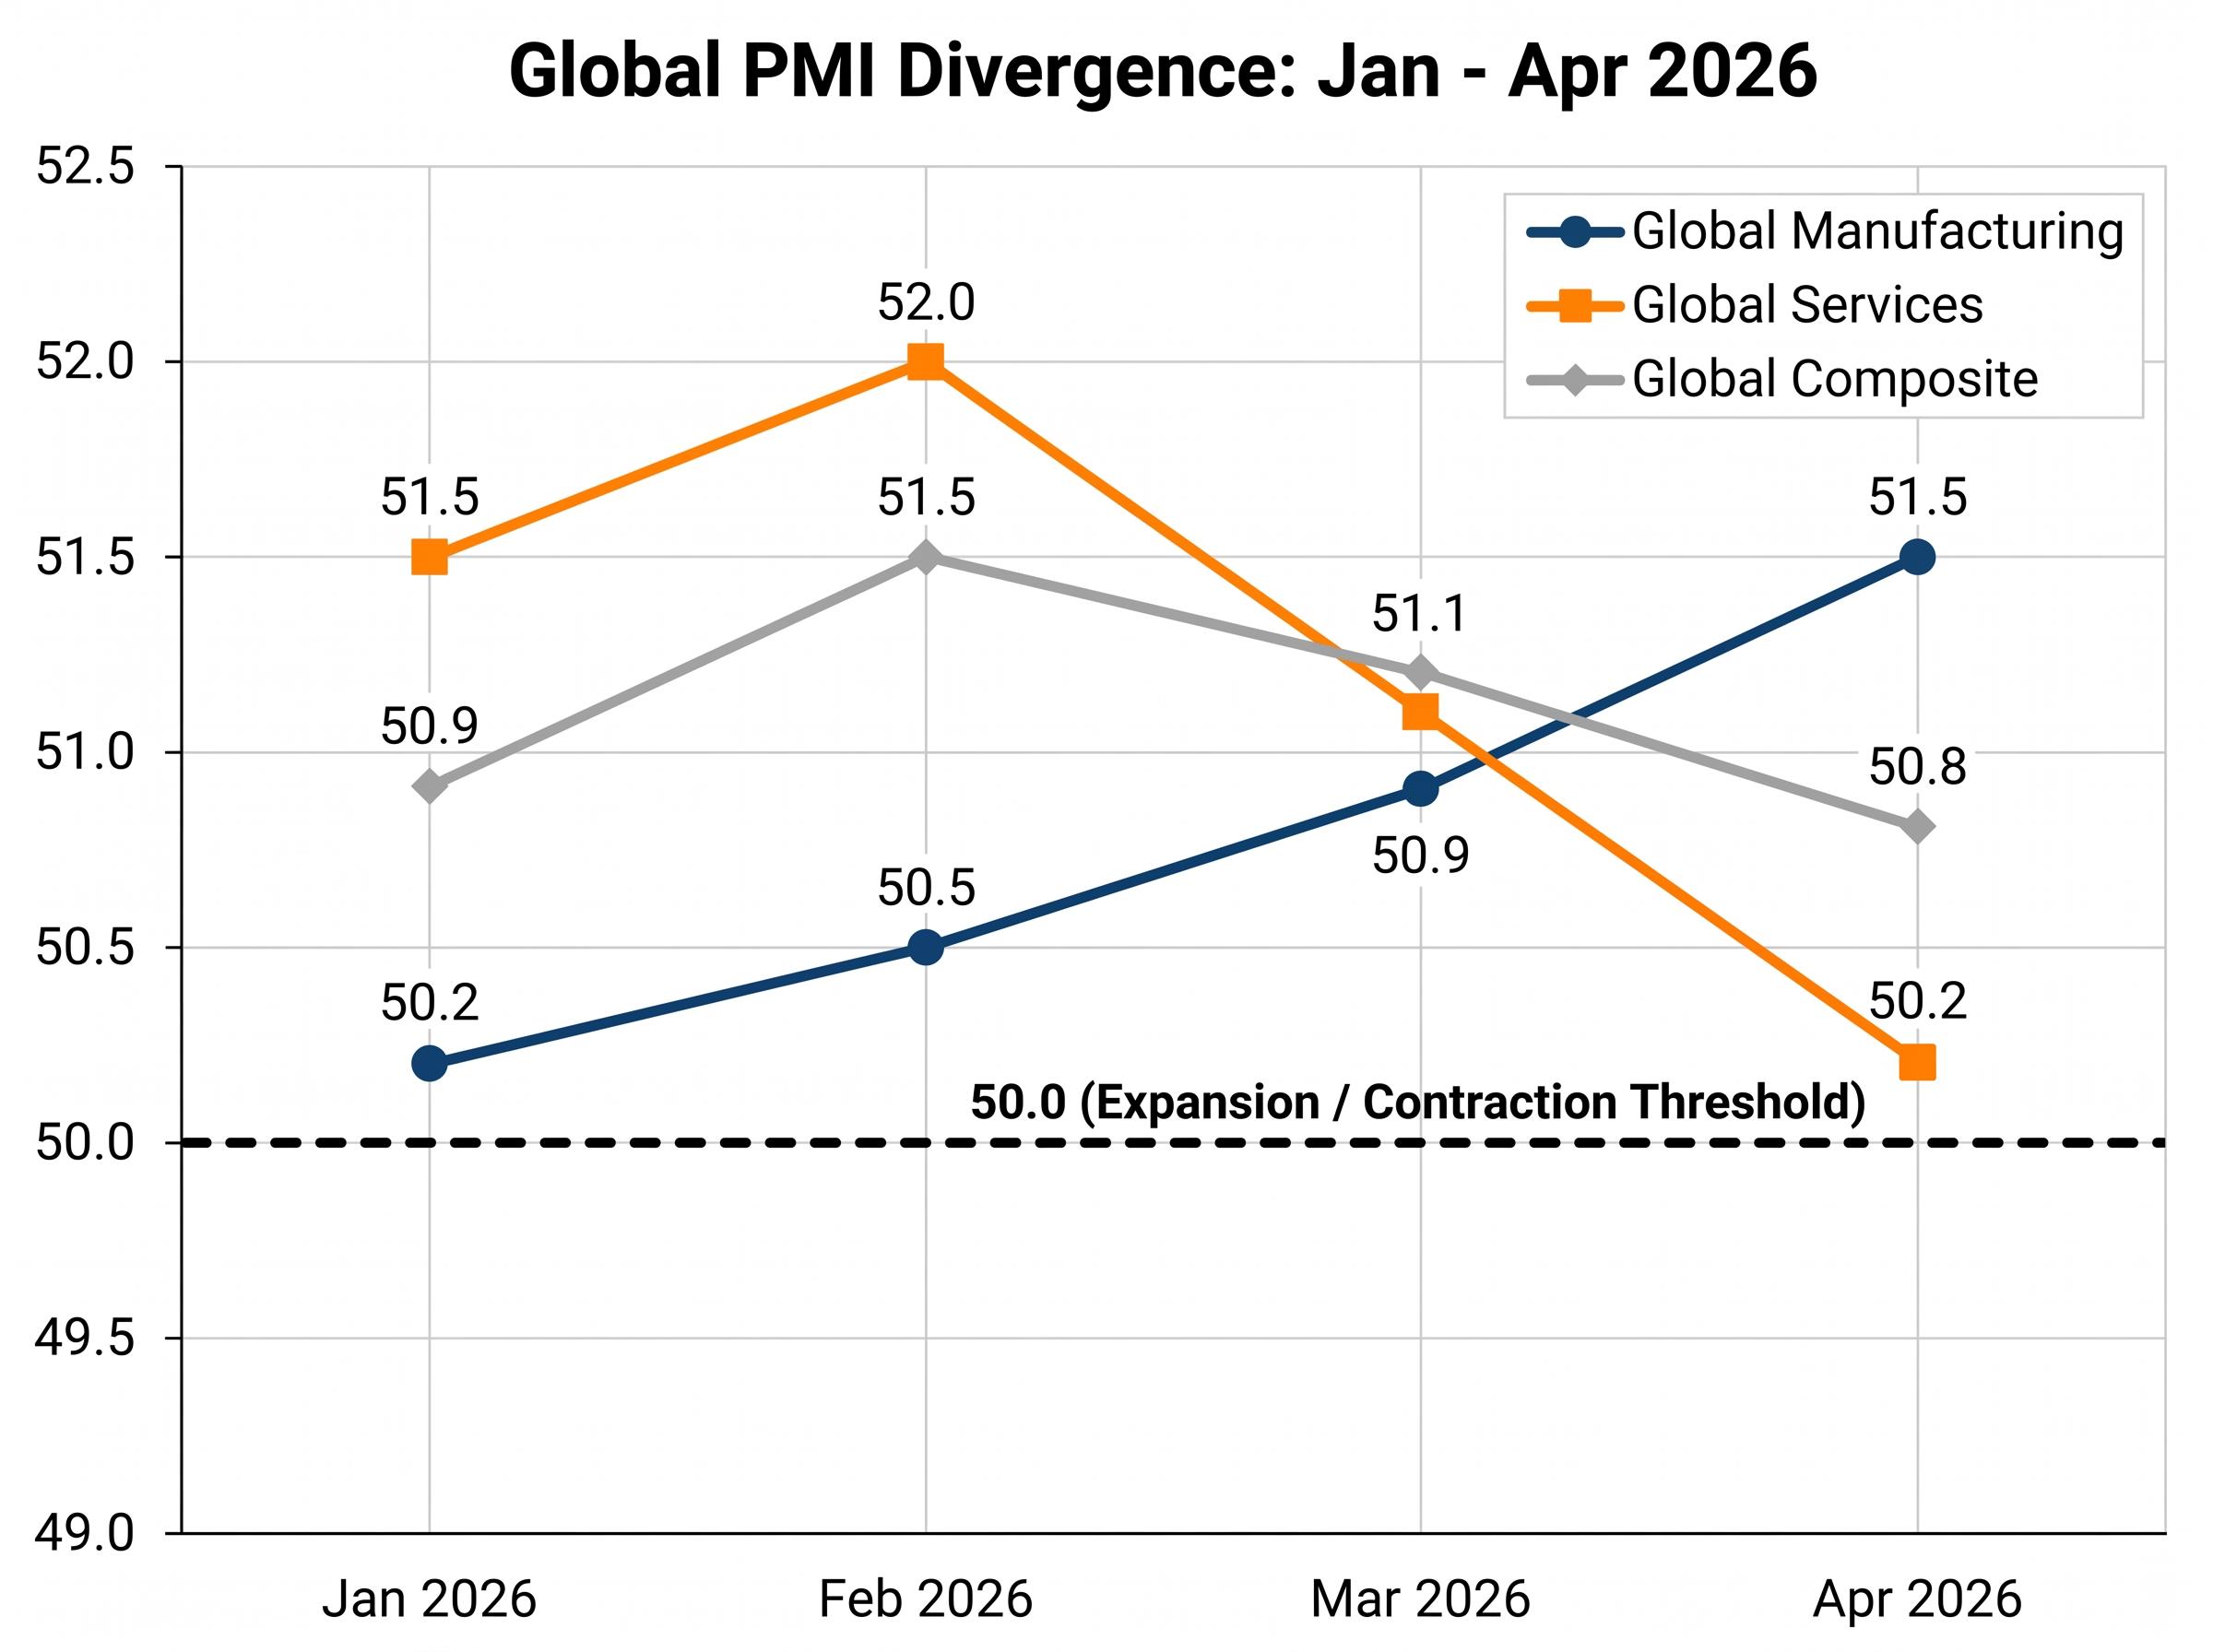
The global composite PMI fell from 51.2 in March to 50.8 in April. Read in isolation, the decline looks like broad-based softening. It is not. Manufacturing has been expanding since January 2026, climbing from 50.2 to 51.5 across four consecutive months. Services have moved in the opposite direction, falling from 52.0 in February to 50.2 in April, a drop of 0.9 points in the March-to-April window alone.
| Indicator | Jan 2026 | Feb 2026 | Mar 2026 | Apr 2026 |
|---|---|---|---|---|
| Global Composite | 50.9 | 51.5 | 51.2 | 50.8 |
| Global Manufacturing | 50.2 | 50.5 | 50.9 | 51.5 |
| Global Services | 51.5 | 52.0 | 51.1 | 50.2 |
The manufacturing recovery anchors the “no recession” reading of the data. Factory output is broadening, not narrowing. But services dominate developed-economy GDP, and services are the sector decelerating fastest. Investors who track only composite PMIs risk misdiagnosing the global economy as uniformly slowing. The split is the signal, and every regional data point that follows reads differently once that filter is in place.
The global PMI divergence between manufacturing and services is not a new development in April 2026; S&P Global data from earlier in the quarter already identified the Anglo-American services bloc holding above 50 while the eurozone began its descent, with S&P Global cutting its 2026 global real GDP growth forecast by 0.5 percentage points to 2.4% as a direct consequence.
Eurozone manufacturing PMI climbed from 49.9 in January to 52.2 in April, a genuine recovery from contraction into expansion. The rebound is real, and in most other contexts it would lead the narrative.
It does not lead here. The eurozone services PMI fell to 47.6 in April, down from 49.2 in March and 50.1 in February. This is not a mild softening around the threshold; it is a reading that Morgan Stanley characterises as signalling recessionary pressure in a services-dominated bloc.
“Eurozone services at 47.6 signals recessionary pressures; US 4.3% unemployment caps downside.” , Morgan Stanley, 9 May 2026
March eurozone retail sales offered a counterpoint: unchanged month on month but up 1.2% year on year, both above consensus. The figure prevents a wholly bearish reading. Yet retail sales are a lagging indicator. They measure spending that has already occurred. The PMI measures business conditions pointing forward.
Markets absorbed the full picture with little ambiguity:
The eurozone Q1 GDP consensus for 13 May sits at +0.3% quarter on quarter. With services dragging at this pace, upside beyond that estimate appears limited. For investors with European exposure, the eurozone services trajectory is the clearest warning signal in the April dataset.
The Purchasing Managers’ Index is a monthly survey of business conditions. Each month, purchasing managers across manufacturing and services firms report whether new orders, output, employment, delivery times, and inventories are expanding, contracting, or unchanged relative to the prior month. Their responses are aggregated into a single index number.
The five sub-components that drive a composite PMI reading are:
S&P Global PMI methodology assigns specific weights to each sub-component: new orders carry 30%, output 25%, employment 20%, suppliers’ delivery times (inverted) 15%, and stock of purchases 10%, a weighting structure that explains why a sharp deterioration in new orders can pull a composite reading below 50 even when current output remains positive.
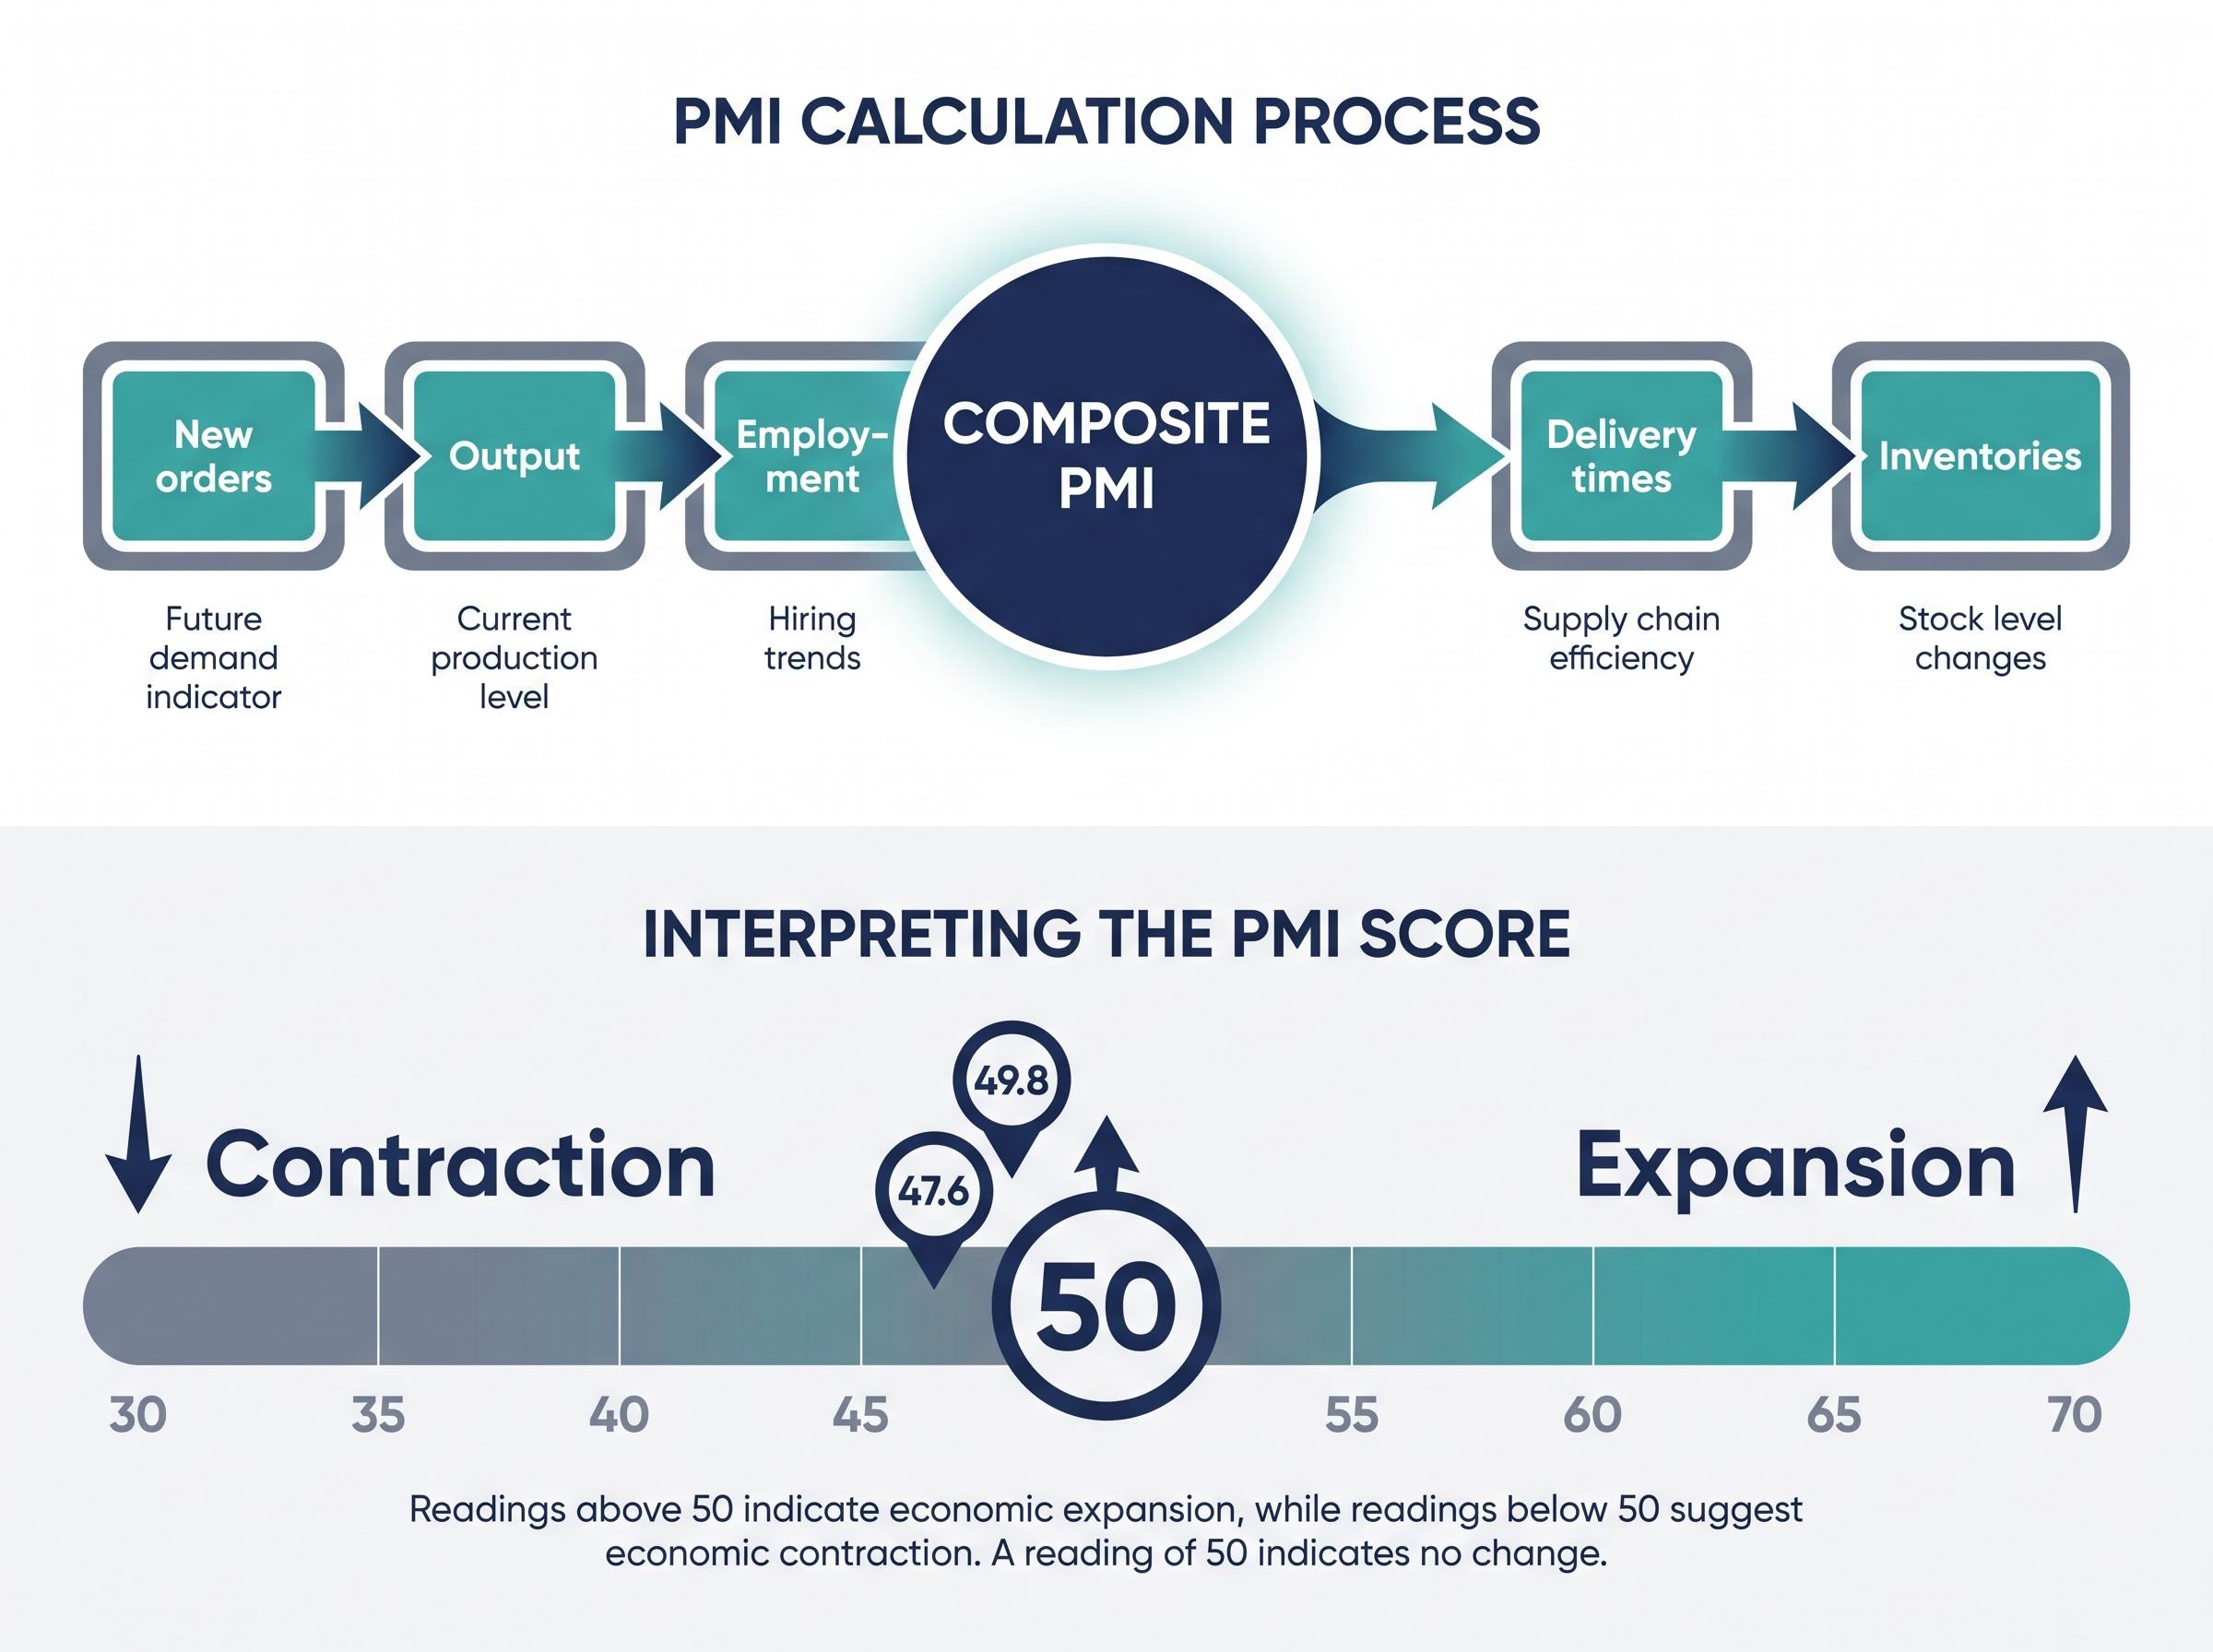
A reading above 50 indicates that more firms reported expansion than contraction. Below 50, the reverse. The threshold is not binary: a reading of 49.8 carries a different signal than 47.6. Sustained readings in the high 40s across multiple months are historically associated with sector-level contraction, which is precisely where eurozone services sit.
PMIs are leading indicators, built on business expectations and current order flow. GDP and retail sales are lagging, measuring output and spending that has already occurred. This distinction explains why PMI divergences from other data releases are common rather than contradictory. Both the official Caixin survey in China and S&P Global’s readings contribute to the picture. Eurostat’s 23 April preliminary figures confirmed alignment with S&P Global PMI data for the eurozone, supporting the reliability of these readings. The analytical skill this entire article depends on is weighting these signals against harder data rather than treating any single indicator as definitive.
Treating earnings season as a macro signal runs alongside PMI and payroll data in the indicator hierarchy: when banks report loan loss provisions below consensus at the same time that services PMIs decelerate, the convergence shifts a single-indicator read into a pattern with more predictive weight, and Q1 2026 earnings data on retail margins and technology tariff pass-through will be directly relevant to reading the 14 May retail sales print.
The US delivered the week’s most reassuring single data point. Nonfarm payrolls added 115,000 jobs in April, significantly above consensus. The unemployment rate held at 4.3%, in line with expectations. The S&P 500 gained 0.8% on the week, the 10-year Treasury yield fell 5 basis points to 4.25%, and the DXY dollar index rose 0.4% to 105.2.
The UK posted the strongest services PMI reading among major developed economies: 52.7 in April, extending a four-month streak of consistent expansion. The FTSE 100 added 0.5%. Yet GBP/USD softened 0.3% to 1.265 despite the PMI beat, a signal that currency markets are pricing broader macro headwinds beyond a single month’s survey.
The complication sits in the US services trend. The reading of 51.0 in April is still expansionary. But the trajectory since February, from 52.4 to 51.6 to 51.0, represents a clear and consistent downward path. Goldman Sachs, in a 8 May note, linked the softening to delayed Federal Reserve rate cut expectations, forecasting US GDP growth at 2.1% and eurozone growth at 1.0% for the year. The payrolls beat, Goldman’s Tony Pasquariello and team assessed, delays Fed cuts to July rather than eliminating the need for them.
| Economy | Jan 2026 | Feb 2026 | Mar 2026 | Apr 2026 |
|---|---|---|---|---|
| US Services | 52.1 | 52.4 | 51.6 | 51.0 |
| UK Services | 52.3 | 51.8 | 52.1 | 52.7 |
| Eurozone Services | 49.7 | 50.1 | 49.2 | 47.6 |
| Japan Services | 51.7 | 52.0 | 51.5 | 51.0 |
| China (Caixin) Services | 51.6 | 52.0 | 52.4 | 52.6 |
The UK’s consistency across four months stands out. So does the US downward slope. A move below 50 in US services over the next two months would represent a material shift in the soft-landing narrative that has underpinned equity markets since late 2025.
China’s April data outperformed on every metric. Exports rose 14.1% year on year, above consensus. Imports surged 25.3% year on year. The Caixin Services PMI came in at 52.6, the fourth consecutive month of acceleration from 51.6 in January. Consumer prices rose 0.3% month on month and 1.2% year on year.
The World Bank raised its emerging markets growth forecast to 4.1% for 2026, crediting China’s import surge as a contributing factor. JPMorgan, in a 7 May note, called China exports “a bright spot” but cautioned that Japan and UK services misses “underscore yen carry trade unwind.”
“China exports +14% a bright spot, but Japan/UK services misses underscore yen carry trade unwind.” , JPMorgan, 7 May 2026
Then came the reinterpretation. On 8 May, the Trump administration announced 25% tariffs on $50 billion of Chinese electric vehicles and semiconductors, effective 1 June 2026. China retaliated with rare earth export curbs. Reuters analysts assessed that the April export surge was likely front-loading: Chinese manufacturers accelerating shipments ahead of tariff implementation.
Geopolitical supply chain shocks complicate the tariff front-loading story further: Brent crude reaching a peak of $142 per barrel following the Strait of Hormuz disruption has introduced an energy cost channel that feeds into Chinese import costs and eurozone manufacturer input prices simultaneously, a dynamic that current PMI sub-components do not cleanly separate from demand-side weakness.
The distinction matters for what the data implies going forward:
The CSI 300 rose 1.4% on the week. Copper gained 2%. Japan’s Nikkei fell 0.9% as a services miss compounded yen strength, with USD/JPY dropping to 148. China’s April numbers appear unambiguously positive at the headline level, but investors who do not account for the tariff front-loading dynamic risk misreading a temporary surge as confirmation of durable demand.
The coming week delivers the hard-data layer that will either validate or challenge the PMI signals identified above. Five releases matter most.
| Release | Date | Consensus | What to Watch |
|---|---|---|---|
| US CPI (April) | 12 May | Headline +0.3% MoM (+3.4% YoY); Core +0.3% MoM (+3.6% YoY) | Sticky core would delay Fed cuts further, strengthen USD |
| China CPI (April) | 12 May | +0.2% YoY | Cooling expected from +1.2% March; tests demand read |
| UK Q1 GDP | 13 May | +0.6% QoQ | Validates UK services PMI outperformance |
| Eurozone Q1 GDP | 13 May | +0.3% QoQ | Tests whether PMI-implied weakness shows in output |
| US Retail Sales (April) | 14 May | +0.4% MoM ex-autos | Payrolls beat suggests consumer resilience |
Three releases stand out in priority order:
The IMF projects global GDP at 3.2% for 2026, unchanged from its April forecast. The April PMI data identifies the fault lines; this week’s releases will confirm or complicate each one.
The April 2026 data does not signal a global recession. Nor does it confirm a global expansion. It reveals a fracturing pattern in which regional and sectoral divergences are becoming the primary driver of investment risk and opportunity.
Three conclusions carry forward. First, the manufacturing-services split is structural and deepening, not a one-month anomaly. Second, the eurozone services contraction is the most significant negative signal in the dataset, while UK and US labour data provide the strongest positive counterweight. Third, China’s trade numbers must be held provisionally until May and June data clarify how much of the April surge was tariff front-loading rather than durable demand.
Fed policy uncertainty has become a structural input into the eurozone and Japan asset price reactions visible in the April data: when the FOMC is split 8-4 with dissenters pulling in opposite directions on a committee where incoming Chair Kevin Warsh inherits inflation at 3.3% and a credibility gap in guidance language, dollar volatility becomes a transmission channel for global risk pricing that composite PMI readings cannot capture.
The week ahead will test each of these threads. US core CPI and the UK-versus-eurozone GDP differential are the two releases most likely to either validate or complicate the April PMI picture. This is the most information-dense fortnight of Q2 2026 for investors managing multi-region exposure.
This article is for informational purposes only and should not be considered financial advice. Investors should conduct their own research and consult with financial professionals before making investment decisions.
A Purchasing Managers' Index (PMI) is a monthly survey of business conditions in which purchasing managers report whether new orders, output, employment, delivery times, and inventories are expanding or contracting relative to the prior month. A reading above 50 indicates expansion, while a reading below 50 signals contraction.
The eurozone services PMI fell to 47.6 in April 2026, a level that Morgan Stanley characterises as signalling recessionary pressure, even as eurozone manufacturing recovered to 52.2. This divergence makes the eurozone the most significant negative signal in the April dataset.
China's April exports rose 14.1% year on year and imports surged 25.3%, but analysts believe much of this surge reflects tariff front-loading, with Chinese manufacturers accelerating shipments ahead of the 25% US tariffs on electric vehicles and semiconductors set to take effect on 1 June 2026.
The three most important releases are US CPI on 12 May (sticky core inflation would delay Fed rate cuts), UK and eurozone Q1 GDP on 13 May (a direct test of whether PMI-implied divergence shows up in actual output), and US retail sales on 14 May (a gauge of whether the payrolls beat is translating into consumer spending).
Global manufacturing PMI has risen to 51.5 in April 2026 across four consecutive months of expansion, while global services PMI has fallen to 50.2, its steepest recent decline occurring in March-to-April. Because services dominate developed-economy GDP, investors who track only composite PMIs risk misreading the global economy as uniformly slowing when the split between sectors is the key signal.