Physical damage to petroleum refineries thousands of miles away is quietly rewriting the interest rate on your mortgage, your business loan, and the bonds sitting in your portfolio right now.
On 10 September 2026, the European Central Bank raised its key deposit facility rate to 2.5%, responding to inflation that refuses to fade while conflict in the Middle East chokes energy supply. Policymakers are no longer describing this as a passing anomaly. They are calling it a structural shift, one that keeps borrowing costs higher for longer.
That distinction matters enormously for how you position your money.
This explainer gives you a clear framework for how physical geopolitical disruption feeds directly into central bank policy, and how you might position a portfolio for an extended period of commodity-driven inflation. The chain runs from a broken refinery to your loan repayments, and once you can see it, you can read the next inflation report like a professional allocator rather than a spectator.
How physical damage in the Middle East rewired the energy map
Start with the physical reality, because that is what makes this crisis so stubborn. This is not a story about tankers waiting in a queue. It is a story about refineries that no longer exist in operable form.
The International Energy Agency (IEA) estimates that roughly 4 million barrels per day of Middle Eastern crude refining capacity is currently shut or at risk of closure. Of that, up to 3.52 million barrels per day has been knocked offline directly by Iran-related fighting. The IEA expects overall Gulf refinery processing to fall by 900,000 barrels per day, and it has cut its full-year 2026 global throughput forecast by 800,000 to 1 million barrels per day.
Here is the distinction that changes everything: a crude oil shortage and a refined product shortage are not the same problem.
Crude is the raw material pulled from the ground. Refined products, diesel, petrol, heating oil, jet fuel, are what actually power the economy, and they only exist once crude passes through a refinery. You cannot put crude in a lorry’s fuel tank. When refineries are destroyed rather than merely slowed, the bottleneck sits at the exact point where oil becomes usable fuel.
That is why the price action shows up on multiple fronts at once:
- Brent crude traded near $108.23 per barrel as of 11 September 2026, with the Federal Reserve Bank of St. Louis recording a European spot price of $109.51 on 9 September.
- Dutch TTF natural gas, Europe’s benchmark, reached €79.52 per MWh as of 13 September 2026, up from above €62 per MWh in July.
- Refiner margins, known as crack spreads, are running at roughly twice their pre-war levels, according to ECB Executive Board member Isabel Schnabel.
Crack spreads are the single metric that separates a crude oil story from a refined products crisis; when they double, as they have now, it confirms the bottleneck sits at the processing stage, not the wellhead, and repairing that takes years rather than weeks.
That doubling of refiner margins is the signal that matters for you. It tells you the bottleneck is physical, not logistical, and physical damage cannot be solved with a diplomatic phone call. Repairing or replacing a refinery in an active conflict zone takes years, not weeks. If your portfolio leans on energy-dependent sectors, transport, chemicals, heavy manufacturing, you are looking at a margin squeeze that will not lift on a ceasefire headline. The infrastructure has to be physically rebuilt first.
When big ASX news breaks, our subscribers know first
Decoding the metrics: How energy shocks bleed into core inflation
Central bankers throw around two words constantly, and the difference between them decides where interest rates go next. Those words are headline inflation and core inflation.
Headline inflation measures the total change in consumer prices, including volatile items like fuel and food. Core inflation strips those volatile items out, leaving the slower-moving prices of services and everyday goods. Central banks watch core inflation closely because it reveals whether price rises are becoming embedded rather than temporary.
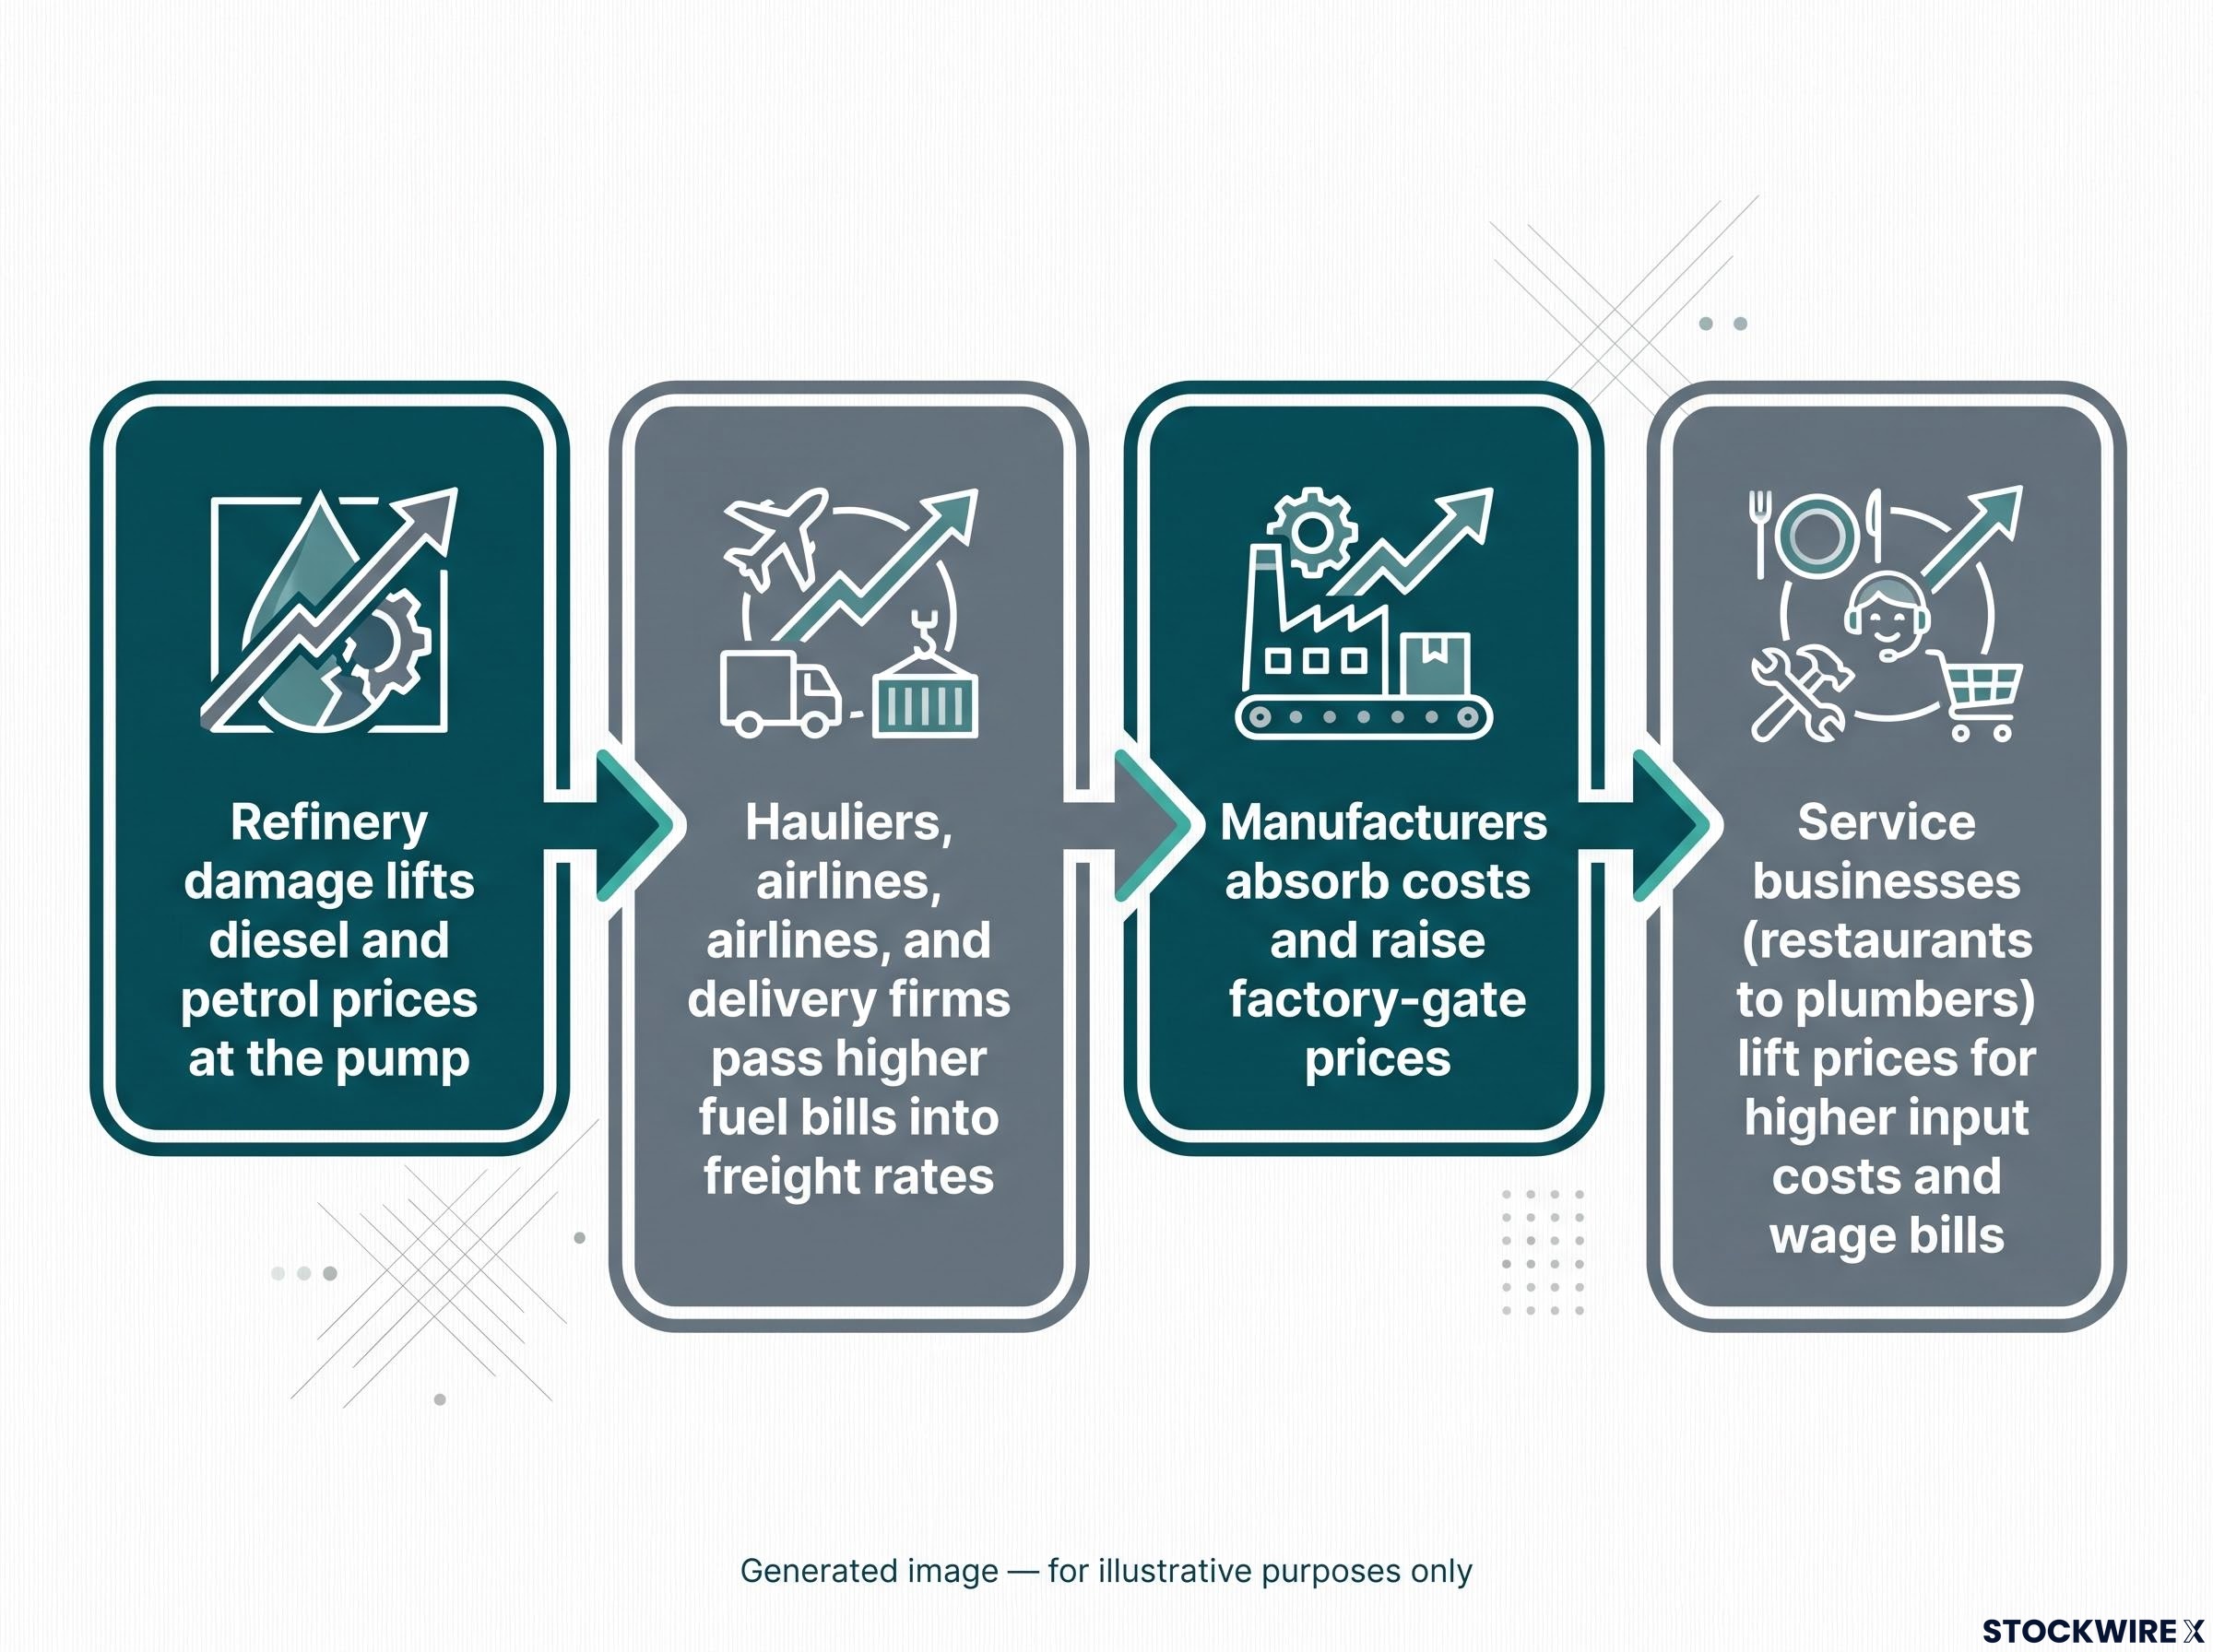
The transmission from one to the other is where a distant supply shock becomes your permanent problem. It runs in stages.
First, the refinery damage lifts diesel and petrol prices at the pump. That is headline inflation, immediate and visible. Then hauliers, airlines, and delivery firms face higher fuel bills and pass them into freight rates. Manufacturers absorb higher energy and transport costs and raise factory-gate prices. Finally, service businesses, everyone from restaurants to plumbers, lift their prices to cover higher input costs and, eventually, higher wage bills. By that final stage, the shock has migrated from headline into core, and core inflation is far harder to shake loose.
The data shows this progression clearly. Eurostat’s flash estimate on 2 September 2026 put euro area headline HICP inflation at 3.3%, up from 2.9% in July and 2.8% in June. ECB economists have attributed roughly 90% of the early-2026 rise in energy inflation to adverse energy supply factors, not demand.
The ECB staff projections for September 2026 attribute roughly 90% of the early-year rise in energy inflation to adverse supply factors rather than demand, a finding that underpins the ECB’s decision to treat this as a structural rather than transitory episode requiring sustained policy tightening.
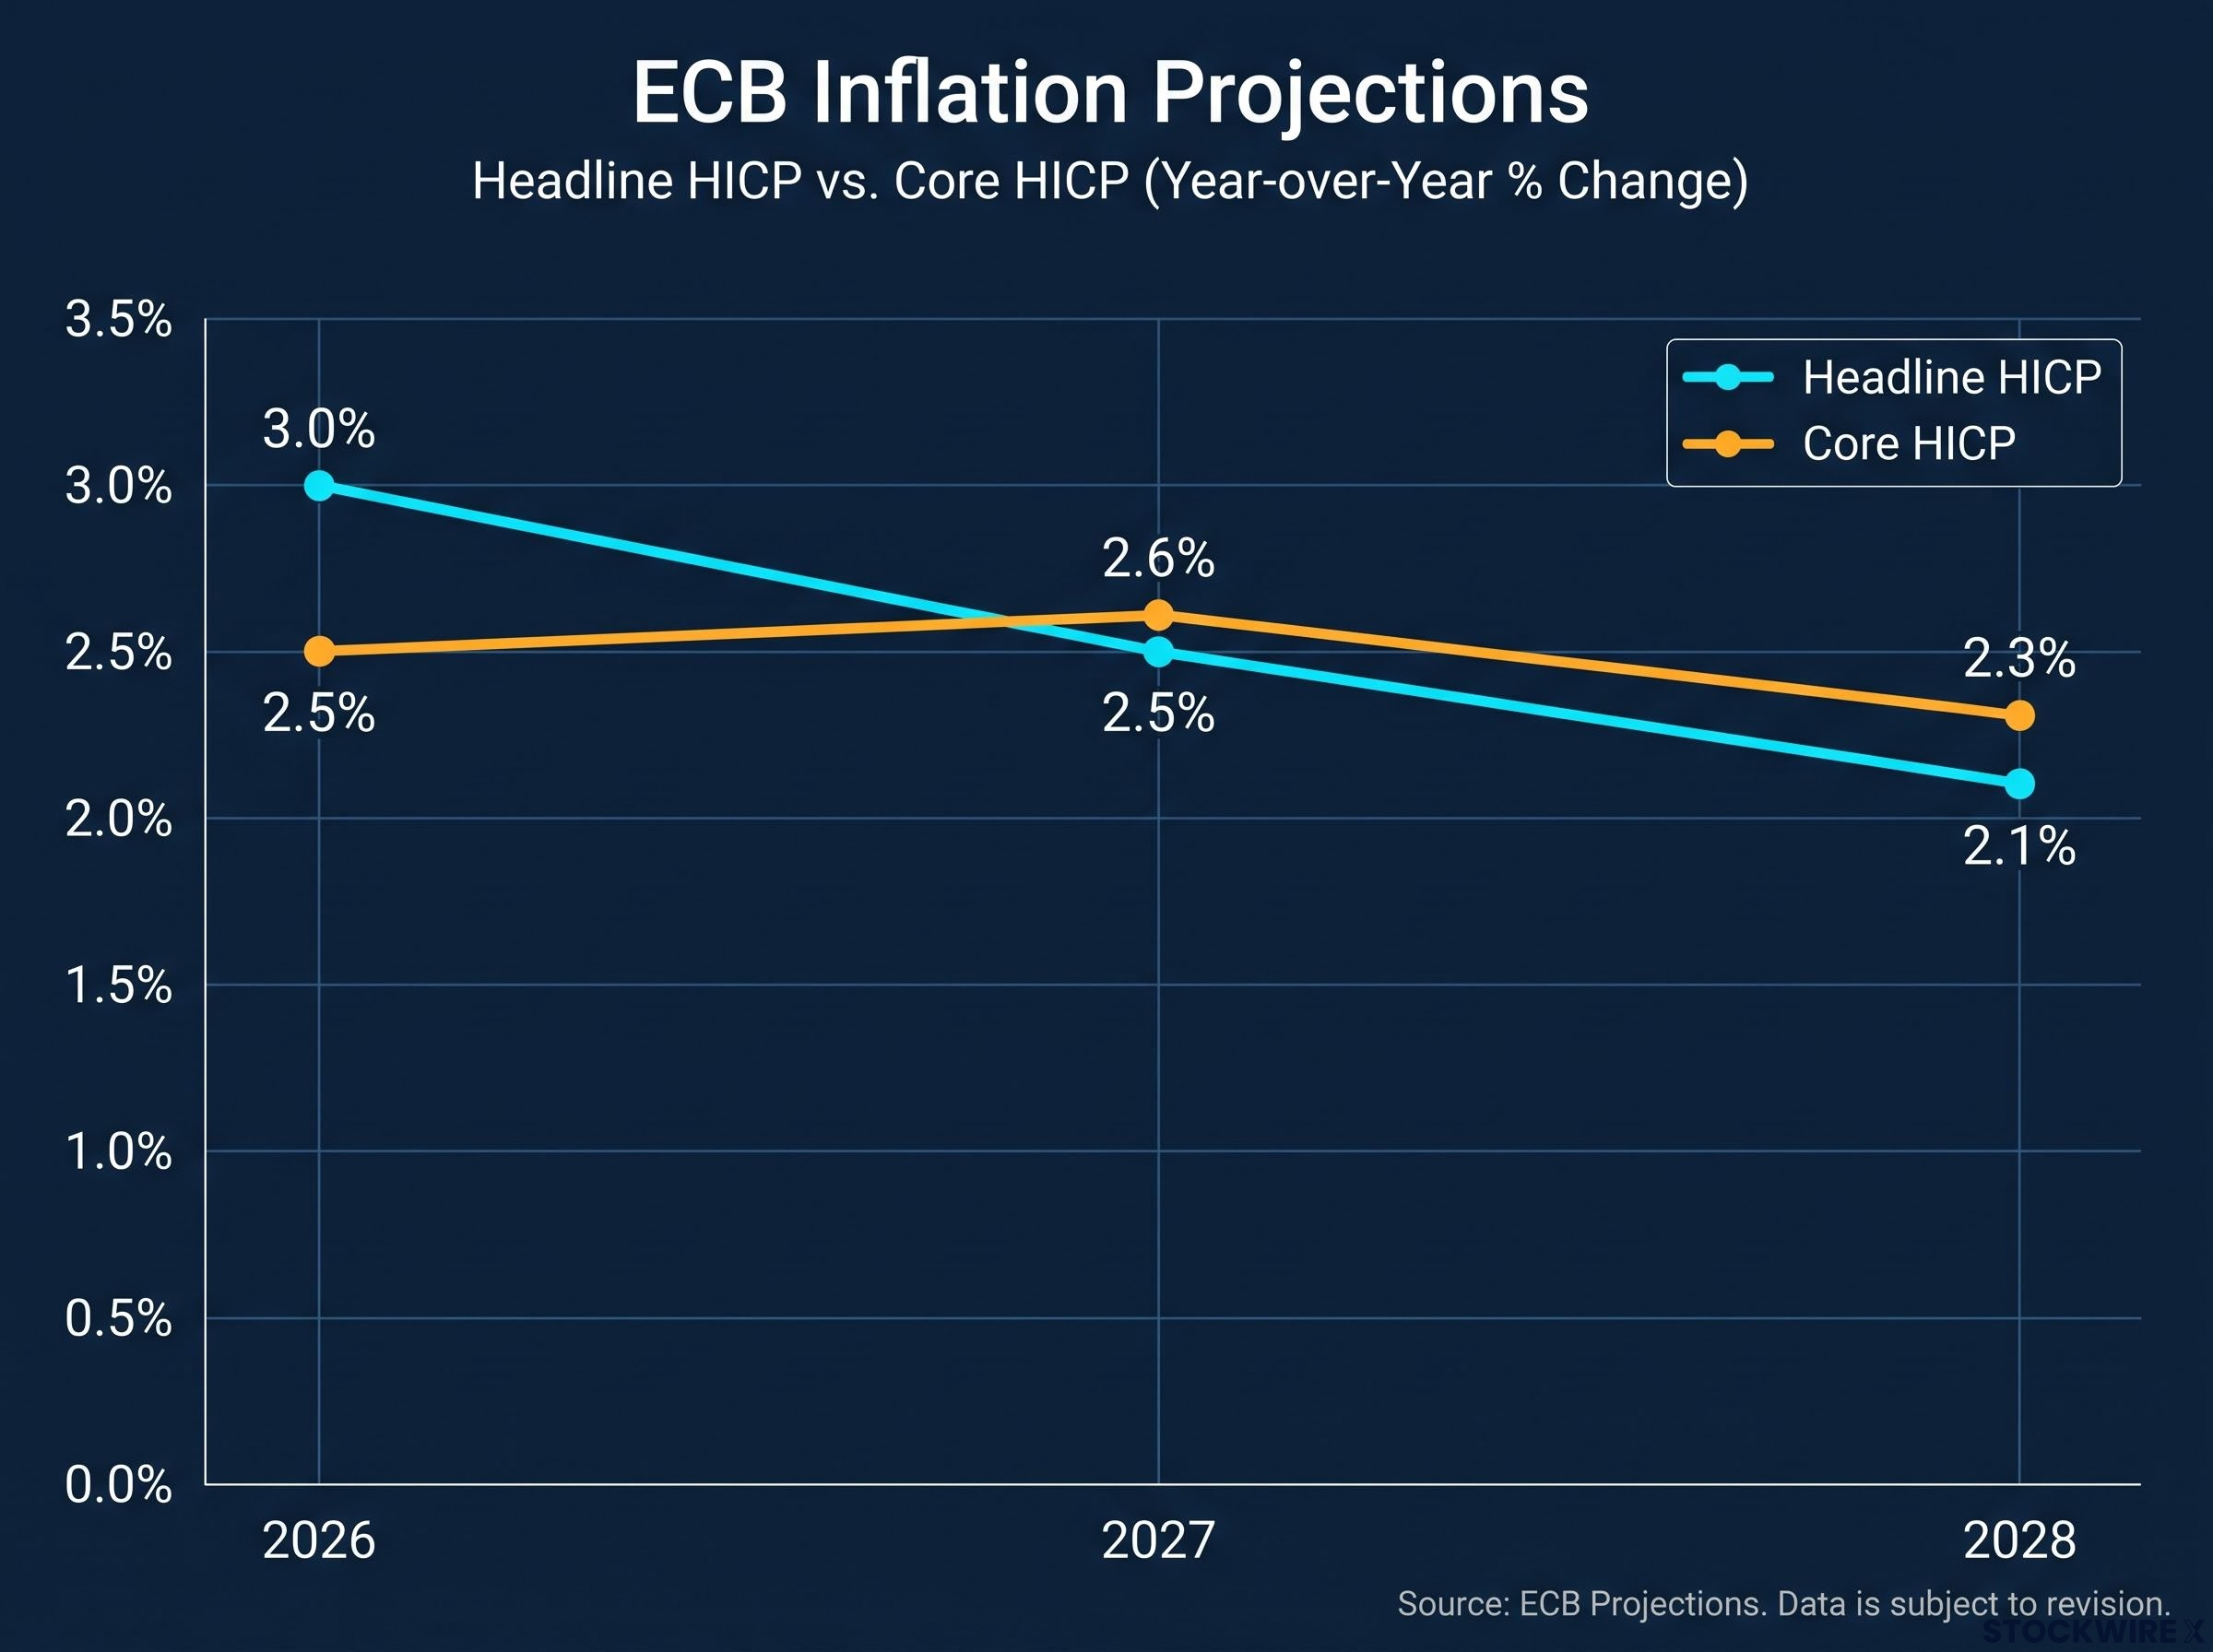
The ECB’s own projections show why this refuses to fade quickly.
| Measure (September 2026 projections) | 2026 | 2027 | 2028 |
|---|---|---|---|
| Headline HICP | 3.0% | 2.5% | 2.1% |
| Core HICP | 2.5% | 2.6% | 2.3% |
Look at 2027. Headline is projected to ease to 2.5%, yet core actually climbs to 2.6%. That is the lag made visible: the initial fuel spike fades, but by then it has seeped into services and wages. Once you understand that lag, you can anticipate rate hikes months before they are fully priced into retail bond yields, because you will be watching core stickiness while others fixate on the falling headline number.
The European Central Bank policy trap and the wage-price feedback loop
This is where central bankers get squeezed. On 16 September 2026, the ECB’s raised deposit facility rate of 2.5% takes effect, and markets are already pricing roughly a 94% probability of a further quarter-point increase in December 2026, based on LSEG data. Goldman Sachs, Citi, and Barclays all expect more tightening ahead.
What makes this a trap rather than a routine tightening cycle is that the ECB is raising rates into an economy the same energy shock is slowing. Higher rates cool demand, but they do nothing to rebuild a refinery. Policymakers are tightening to control a fire they cannot reach with their usual tools.
Critics of the ECB’s tightening stance argue that applying rate hikes to supply-side inflation is categorically the wrong tool, since raising borrowing costs cannot produce more refined fuel or reopen damaged refinery capacity, and the June 2026 hiking cycle crystallised exactly that debate.
The commentary from ECB officials has turned notably hawkish. Speaking on 14 September 2026, Latvia’s central bank governor Martins Kazaks said rising fuel costs were beginning to filter into wage demands and broader consumer prices, strengthening the case for further hikes.
ECB President Christine Lagarde, in an interview with Ouest-France over the decision weekend, indicated that the current energy disruption is likely to last longer than initially anticipated, warning that geopolitical conflict will sustain price volatility while acknowledging the risks this poses to growth.
The fear beneath these warnings is a wage-price feedback loop. It works like this: fuel costs raise the cost of living, workers demand higher wages to keep up, businesses raise prices to cover those wages, and the higher prices trigger fresh wage demands. Once that cycle self-reinforces, inflation becomes endogenous, generated from within the economy rather than imported from a foreign conflict. Citi economists warned on 11 September 2026 that the longer inflation stays high, the greater the risk it becomes exactly that.
For you, the read is direct. When policymakers warn explicitly about second-round wage effects, they are telling you to expect rates to stay elevated even if European growth stalls. Do not assume a slowdown automatically brings rate cuts. This time, weak growth and high rates could arrive together.
Is the shock structural or cyclical?
The entire outlook hinges on one unresolved debate. The ECB largely sees these pressures as structural, meaning they are baked in and demand sustained high rates. The ECB Economic Bulletin projected headline inflation to peak near 3.4% in late 2026, pinning it on the Middle East conflict.
The International Monetary Fund (IMF) disagrees. It calls the crisis a “large but temporary adverse supply shock” and, in its 2026 Euro Area concluding statement, recommended only modest rate rises of around 50 basis points across the year, projecting inflation at 2.9% before disinflation resumes.
This is not academic. If the structural camp is right, markets are currently underpricing how long rates stay high. If the cyclical camp is right, markets may be overpricing future tightening and underpricing the rate cuts that follow. Which side wins determines whether your fixed income positioning should brace for higher-for-longer or lean into an eventual easing cycle.
The geopolitical offset: Expanding Venezuelan oil access
While Europe wrestles with its refining bottleneck, a different lever is being pulled on the other side of the Atlantic. To offset the supply squeeze from the Iran conflict, the US Treasury’s Office of Foreign Assets Control (OFAC) has eased sanctions on Venezuela’s energy sector, deliberately unlocking crude that had been off the market.
Between January and April 2026, OFAC issued General License 50A (amended February 2026) and General License 52 (issued March 2026). These authorisations opened the door for global energy majors to return to Venezuelan operations.
OFAC General License 50A, amended in February 2026, formally authorises named energy majors including Chevron, BP, Eni, Shell, Repsol, and Maurel and Prom to conduct oil and gas operations in Venezuela and transact with state-run PDVSA, confirming the policy intent to expand supply as a deliberate counterweight to Middle East refining losses.
The newly authorised commercial activity is broad:
- Global majors including Chevron, BP, Eni, Shell, Repsol, and Maurel & Prom are permitted to operate oil and gas projects and transact with state-run PDVSA.
- US entities may buy, sell, transport, store, and refine Venezuelan crude, with payments routed through US Treasury-controlled accounts.
- Waivers extend to purchasing Venezuelan petrochemical products, including fertilisers.
Here is the read for your positioning. When Western governments start unlocking reserves they had sanctioned for political reasons, it signals how urgently they want to cap energy prices. That urgency acts as a structural ceiling on crude: every time prices climb, expect more of these levers to be pulled. It is a caution against betting too heavily that oil only goes up.
The Venezuelan oil deal signed on 28 August 2026 granted the U.S. government a 35% Pentagon equity stake in 17 fields holding roughly 65 billion barrels of reserves, adding a layer of geopolitical and governance complexity to the supply-relief picture that crude volume estimates alone do not capture.
But do not overstate the relief. Venezuelan crude eases the raw supply picture; it does nothing for the refining bottleneck that is actually driving refined product prices and core inflation in Europe. More crude does not help if there are fewer refineries to process it. The offset caps one problem while leaving the more stubborn one untouched.
Applying historical lessons to your asset allocation
History does not repeat, but energy shocks rhyme, and the rhymes give you a usable blueprint. Allianz Research draws a direct line from today’s Middle East risk to the 1973 Arab-Israeli War and the 1979 Iranian Revolution, each of which removed 5-10% of global oil supply and doubled prices within months.
The good news is that modern economies are more efficient. Allianz calculates that a $10 per barrel rise in oil today adds roughly 0.2 percentage points to inflation and subtracts less than 0.1 points from growth in advanced economies, a milder hit than the 1970s delivered.
The more recent comparison is 2022, when European gas prices spiked around 700% after Russian pipeline supply collapsed. Europe survived it, which tells you the region can absorb extreme energy stress, but not without the kind of sustained inflation and policy tightening now unfolding again.
What worked historically during these stagflationary stretches, where growth weakens while prices climb, points to three defensive moves.
- Sector rotation: Reduce exposure to energy-intensive European industries like chemicals and heavy manufacturing, and lean toward energy producers and resilient service sectors that can pass on costs.
- Fixed income positioning: Favour inflation-linked bonds and shorter-duration euro debt, on the expectation the ECB holds rates high to fight structural core inflation through 2028.
- Stagflation hedging: Prioritise quality balance sheets, geographic diversification, and companies with genuine pricing power, the ability to raise prices without losing customers.
That last point is the through-line from the 1970s. The businesses that came through best were those that could pass rising input costs straight to customers. In an environment where costs climb faster than demand, pricing power is the trait that protects your equity exposure.
Investors wanting to stress-test their allocation across structurally different outcomes will find our dedicated guide to stagflationary portfolio scenarios, which models the specific return impacts on equities, bonds, and gold under soft landing, stagflationary trap, and debt monetisation conditions.
This article is for informational purposes only and should not be considered financial advice. Investors should conduct their own research and consult with financial professionals before making investment decisions. Past performance does not guarantee future results, and financial projections are subject to market conditions and various risk factors.
Navigating a structurally tighter monetary environment
The chain is now visible end to end. Physical destruction of refining capacity in the Middle East doubled crack spreads, pushed refined fuel prices higher, seeped from headline into core inflation, and forced the ECB to lift rates to 2.5% with more likely to come.
The old central bank playbook, looking through a temporary supply shock and waiting for it to pass, has been shelved. With a tight labour market and fuel costs filtering into wage demands, policymakers can no longer assume the spike is fleeting. That is the structural shift they keep warning about.
For your portfolio, two indicators now matter more than the headline inflation number everyone quotes. Watch refining margins, because they reveal whether the physical bottleneck is easing or tightening. And watch wage data, because that is what tells you whether the shock has become self-sustaining.
Get those two right, and you will see the ECB’s next move before the market does.