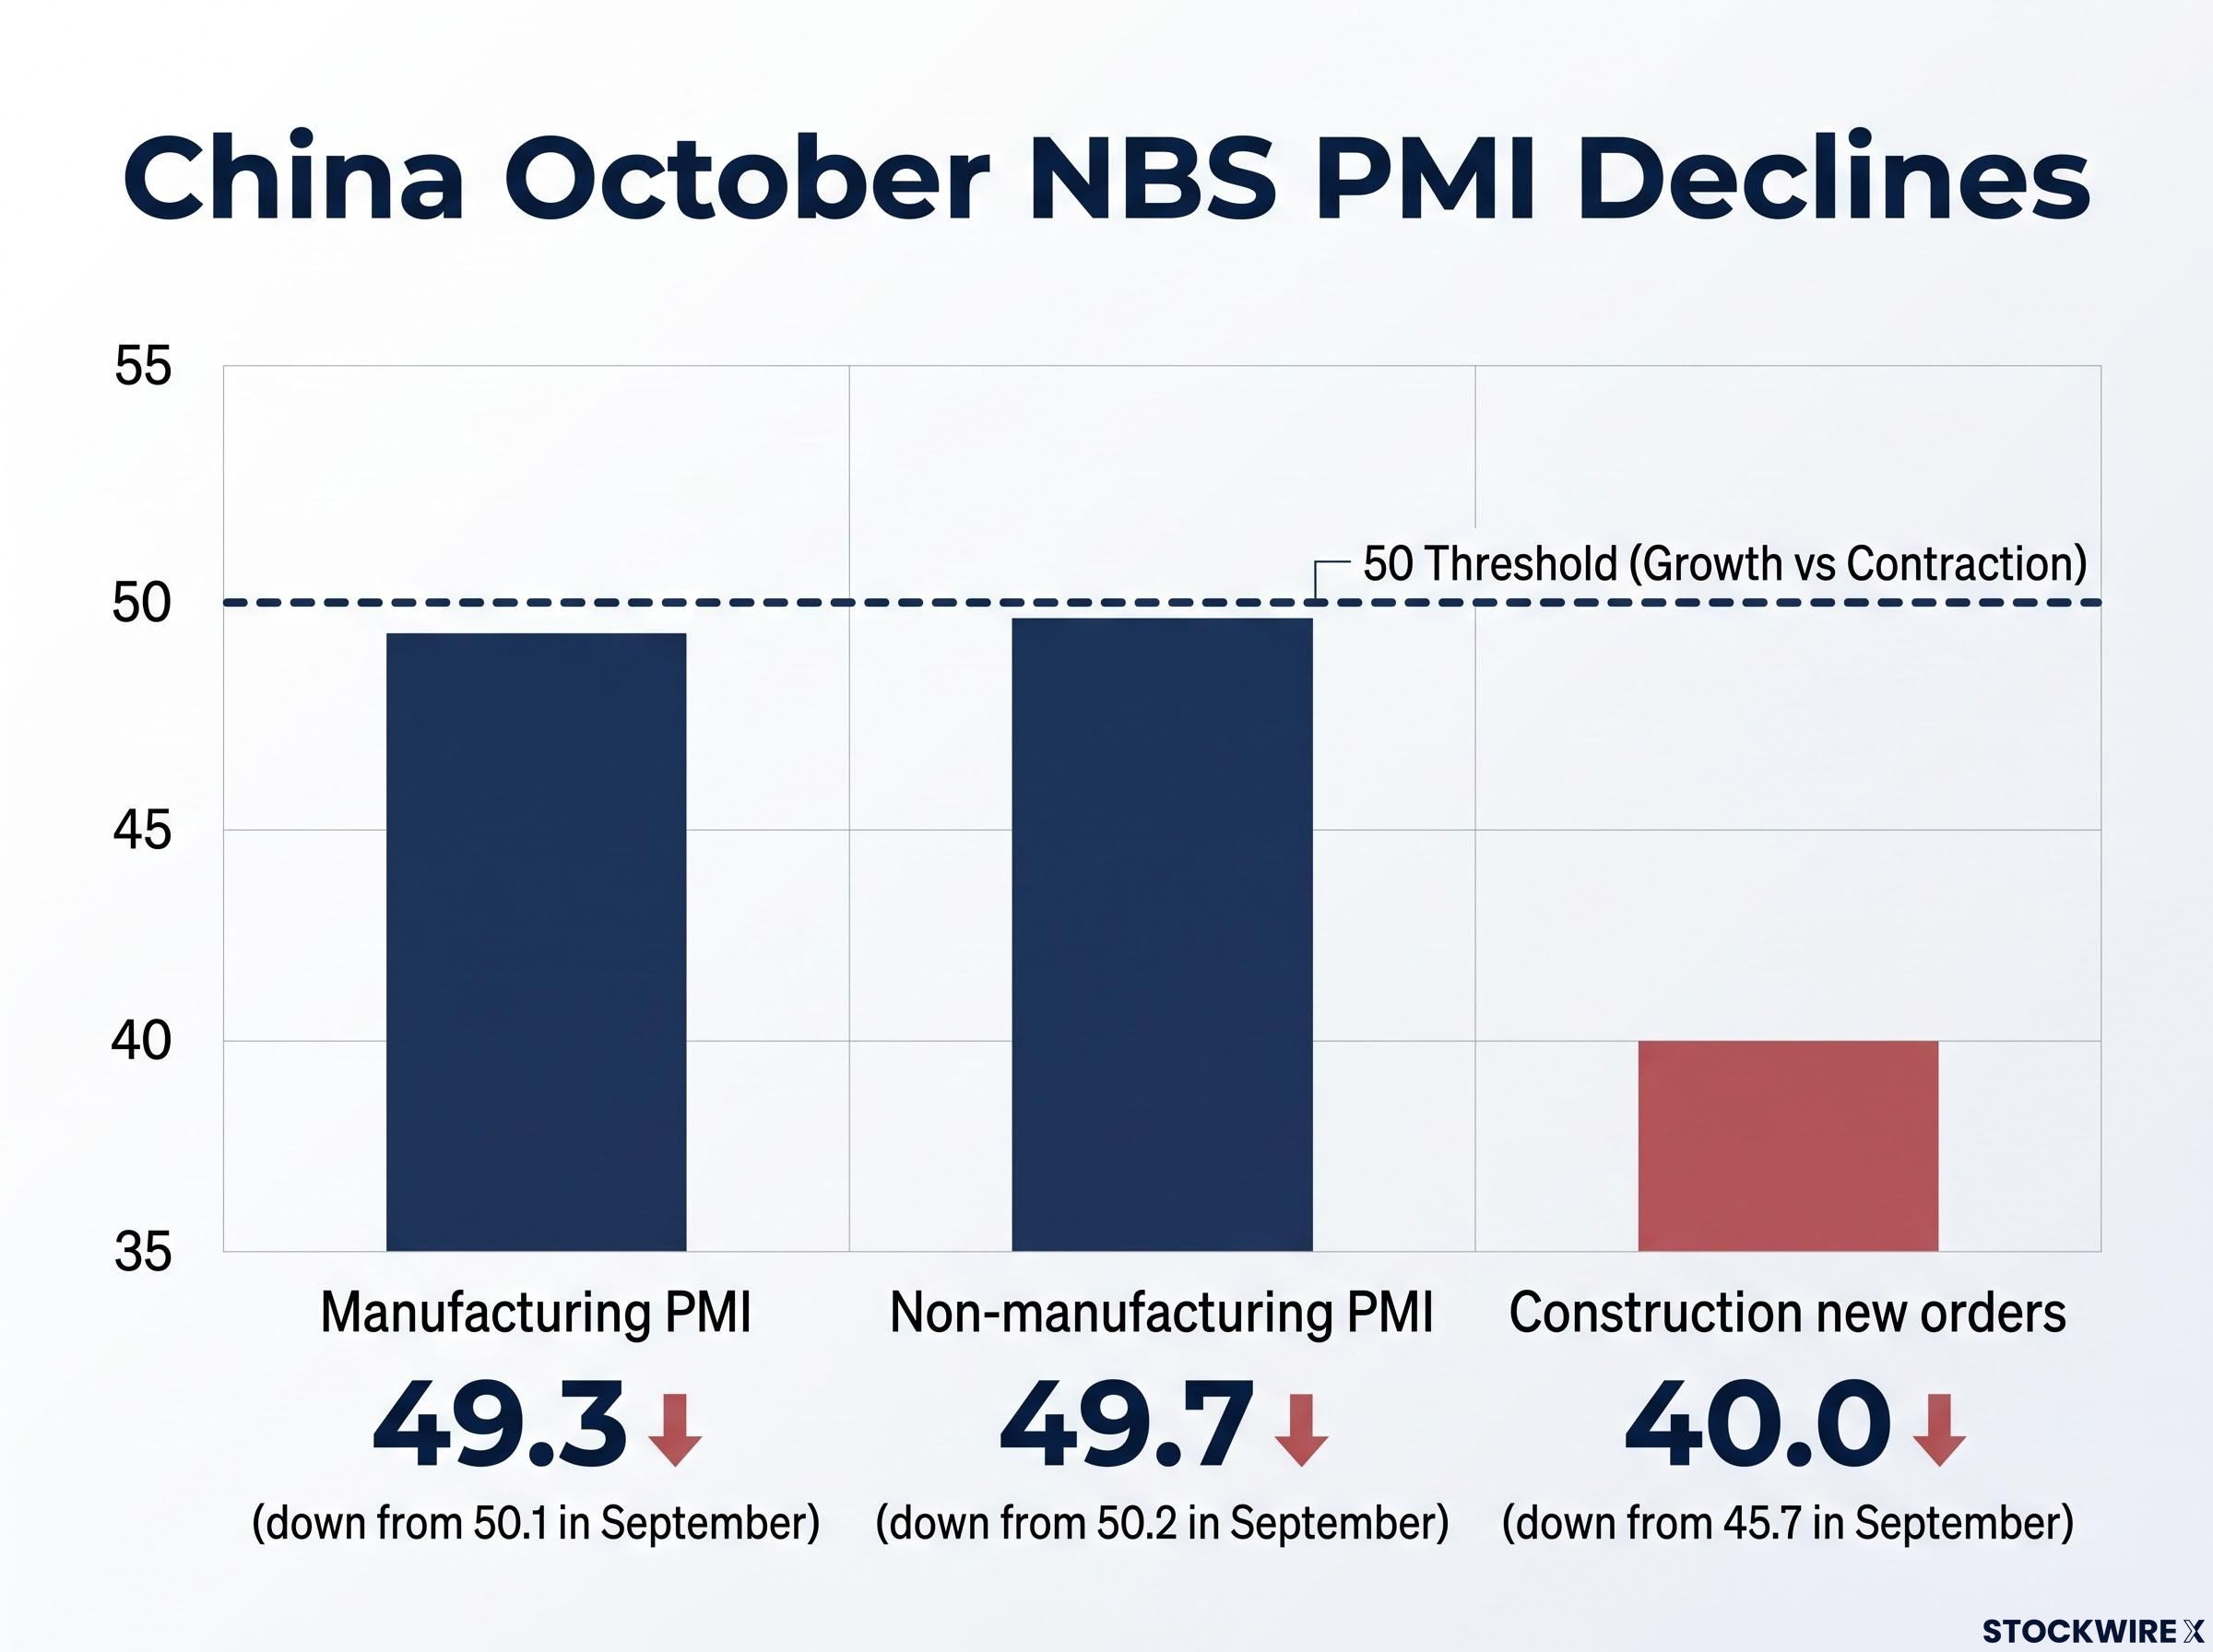
China’s official factory gauge fell to 49.3 in October and its non-manufacturing index slipped to 49.7, putting both below the 50 line that separates growth from contraction. On Monday, the yuan traded at its strongest level against the US dollar in more than four years anyway.
The October PMI release from the National Bureau of Statistics (NBS) on 31 October reversed September’s improvement. Construction new orders sank to 40.0, close to the lowest reading on record outside the pandemic.
Prices complicate things further. China’s producer price index (PPI), which tracks what factories charge at the factory gate, rose 5.0% year on year in September. Shrinking activity alongside rising producer prices and a firming currency rarely appears in a single snapshot.
Here is why a weak data set and a strong yuan can sit side by side, and what that mix means for any China exposure in your portfolio.
Why did the yuan climb on a weak data set?
Weak data normally drags a currency lower. The yuan went the other way.
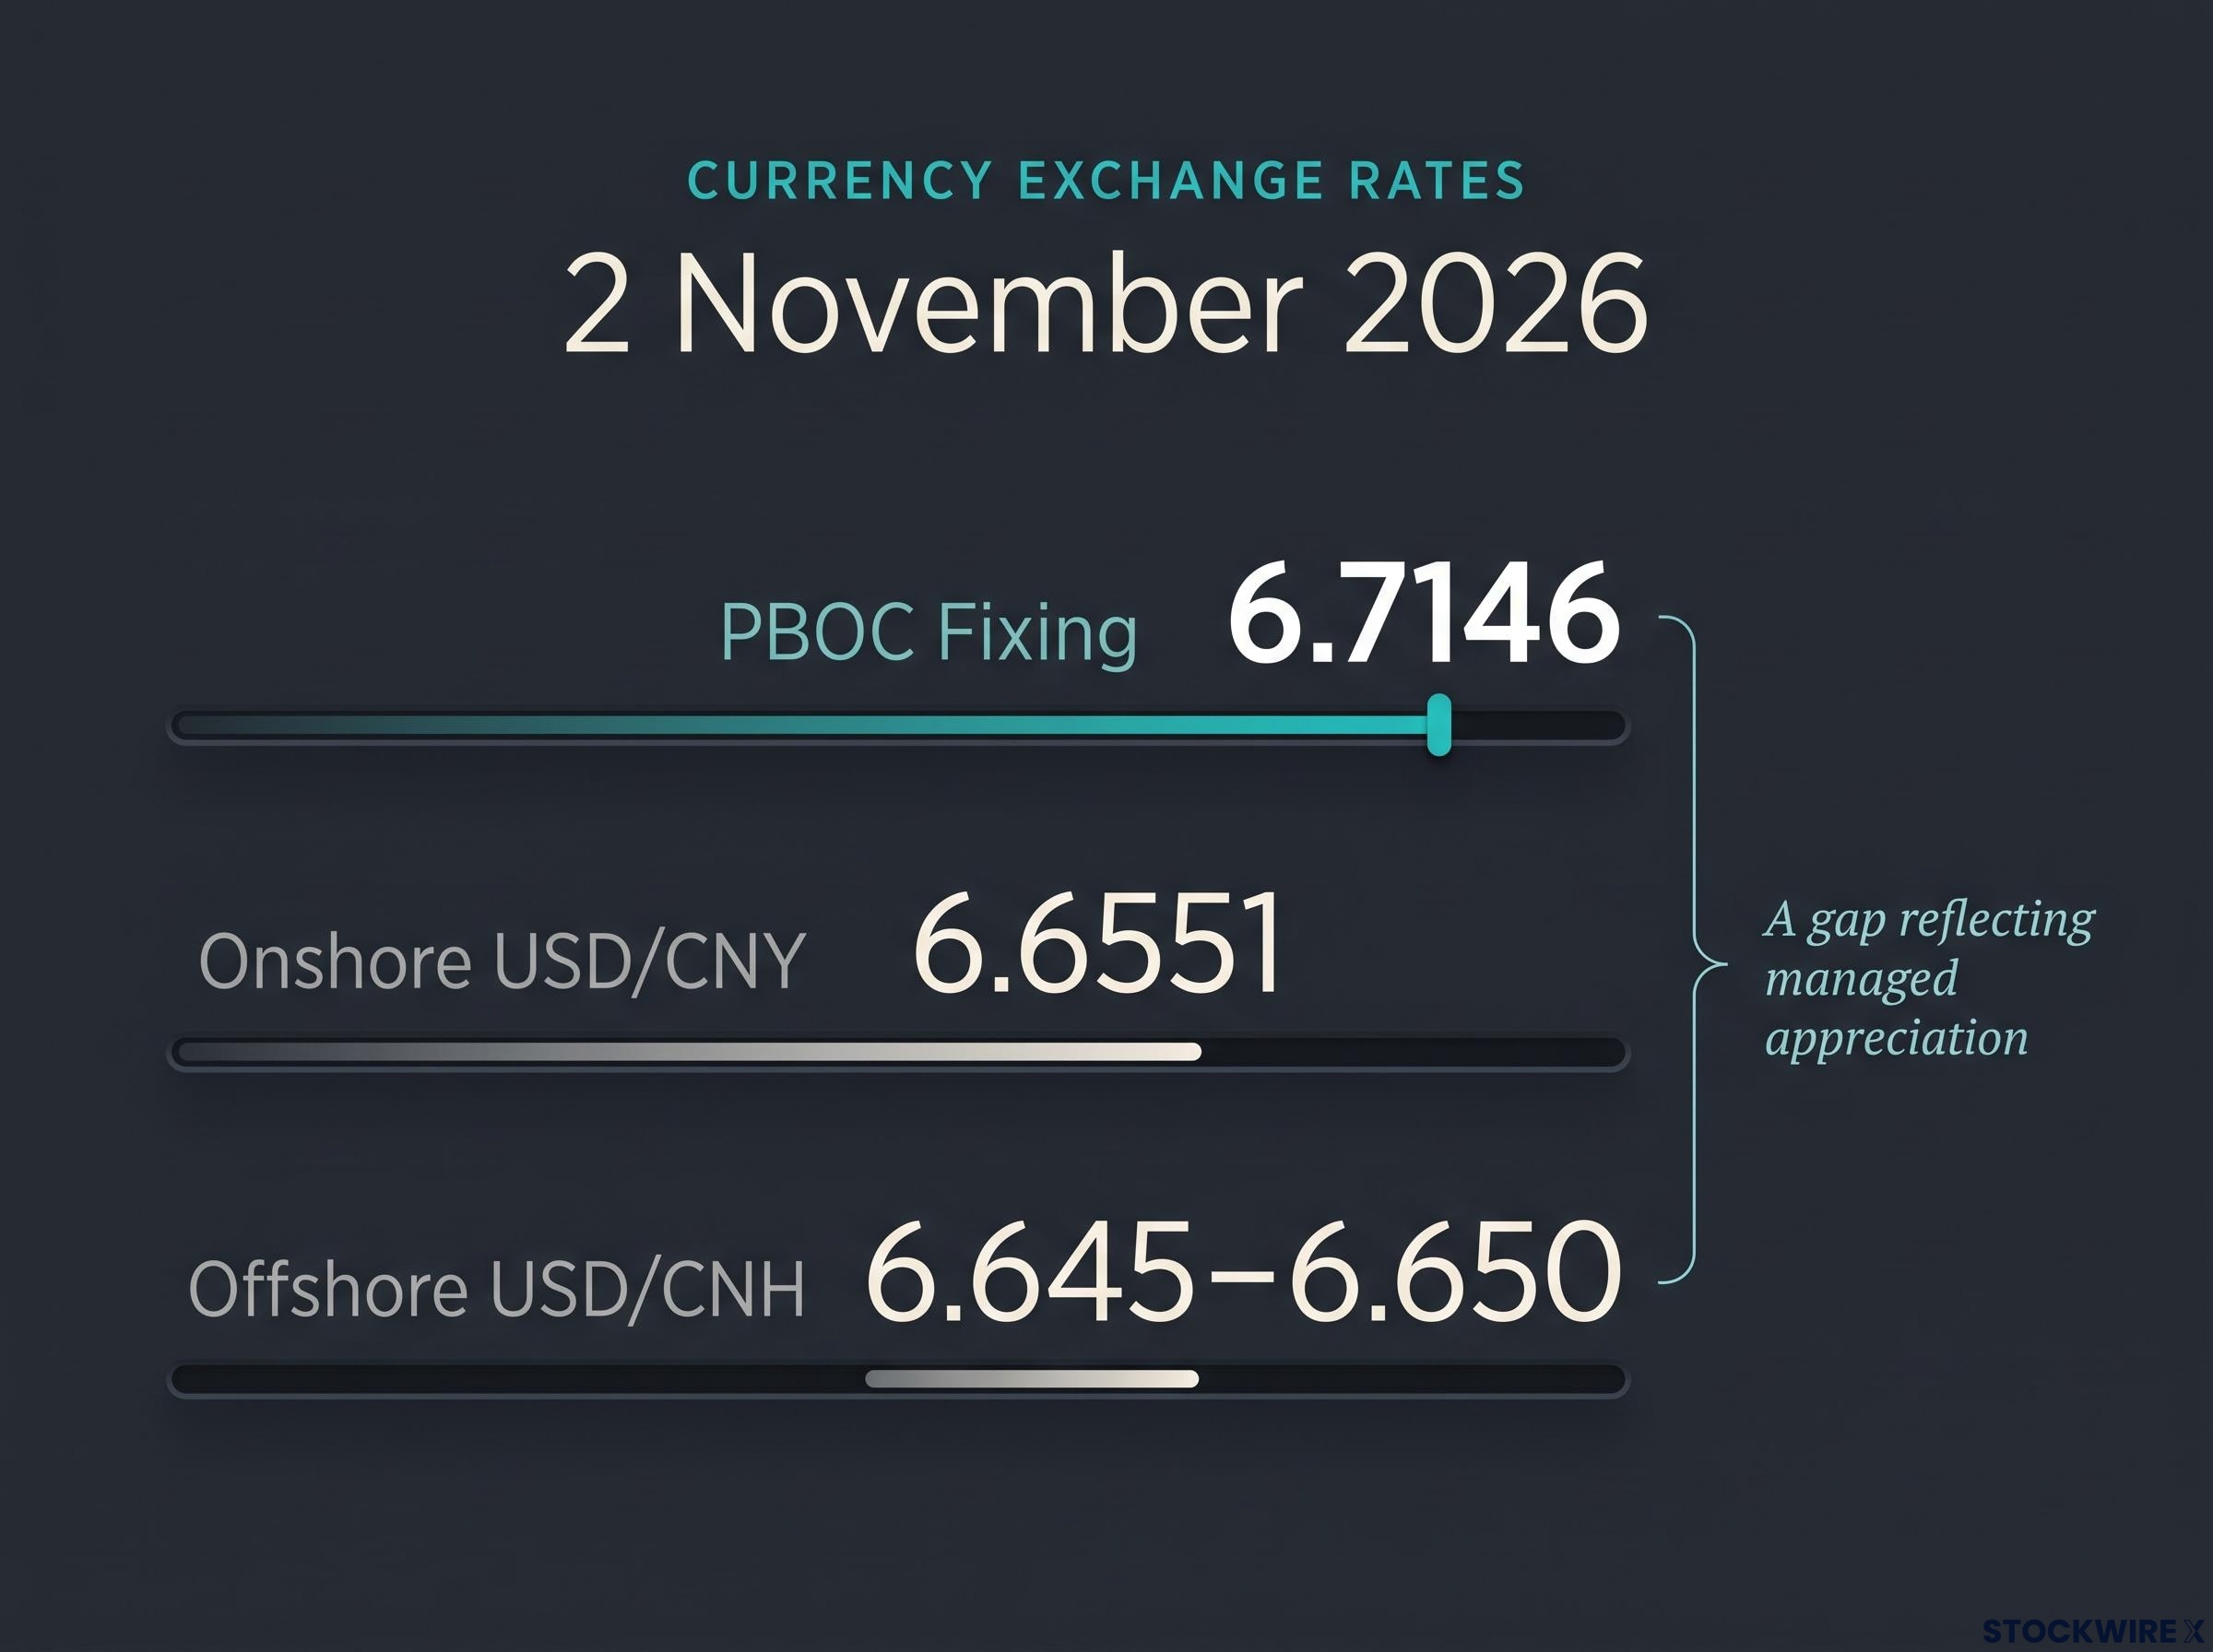
Offshore USD/CNH traded around 6.645-6.65 on 2 November, while onshore USD/CNY sat near 6.6551. The yuan gained about 0.7% in October, according to Commerzbank, and roughly 5% so far in 2026.
The explanation sits in the gap between where the People’s Bank of China (PBOC) sets its daily reference rate and where the market actually trades.
| Measure | Level (yuan per US dollar) | Date |
|---|---|---|
| Previous PBOC fixing | 6.7138 (strongest since February 2023) | Prior session |
| PBOC fixing | 6.7146 | 2 November 2026 |
| Onshore USD/CNY | 6.6551 | 2 November 2026 |
| Offshore USD/CNH | 6.645-6.65 | 2 November 2026 |
Commerzbank’s Volkmar Baur called the move a gradual, managed appreciation rather than a verdict on domestic strength. The South China Morning Post framed it the same way: Beijing is controlling the speed of the rise.
Commerzbank’s reading fits a wider view among regional banks, which expect controlled, gradual appreciation supported by strong exporter conversion and a large current-account surplus rather than any shift in domestic demand.
How a managed rise works
Each morning the PBOC publishes a midpoint, called the fixing, and the onshore yuan may trade only within a set band around it. A fixing set weaker than the market expects slows the currency’s climb without reversing it. The 6.7146 fixing against spot near 6.65 is pacing, not pushback.
Other forces are adding lift:
- Exporter conversion: firms sell dollars earlier to cover wages, taxes and suppliers.
- Hedging: expecting further gains, exporters hedge more, adding spot demand for yuan.
- Dollar moves: some of the gain reflects a softer greenback, according to reports that have not been independently confirmed.
- Policy-confidence inflows: expectations of stability can draw foreign money into yuan assets.
The read for you: the currency reflects policy confidence and dollar flows, not Chinese growth. Do not treat a firm yuan as evidence that domestic demand has recovered.
What the October PMIs and price gauges actually show
A purchasing managers’ index (PMI) is a diffusion index: above 50 means more surveyed firms reported improvement than deterioration. It measures breadth, not the size of output changes.
Start with the weakest number. Construction new orders fell 5.7 points to 40.0, a forward-looking signal that little fresh work is entering the pipeline.
| NBS indicator | October | September | Change |
|---|---|---|---|
| Manufacturing PMI | 49.3 | 50.1 | -0.8 |
| Non-manufacturing PMI | 49.7 | 50.2 | -0.5 |
| Construction activity | 48.0 | 50.3 | -2.3 |
| Construction new orders | 40.0 | 45.7 | -5.7 |
| Services new orders | 45.2 | 47.3 | -2.1 |
| Services activity | 50.0 | 50.2 | -0.2 |
Golden Week holidays distorted services and construction, but not enough to explain the breadth of the decline.
Commerzbank’s read Baur said Chinese economic sentiment deteriorated at the start of Q4.
The private RatingDog manufacturing PMI held at 52.0. The difference is who gets surveyed: the NBS leans towards large, state-linked and construction-related firms, while RatingDog covers more smaller, export-oriented manufacturers.
The NBS and RatingDog gap is not new; earlier readings also showed a two-speed industrial economy, with large enterprises expanding while small firms stayed in contraction under the same headline number.
Now the prices, where the squeeze shows:
- NBS raw-material prices: 56.8, down 4.0 points but still firmly inflationary.
- NBS output prices: 51.7, down 2.3 points.
- RatingDog input prices: rising for a sixteenth straight month.
- RatingDog output charges: falling as competition forces discounts.
Baur estimated that the indices imply roughly a 0.3% monthly PPI rise in October. That is an estimate; the official figure is due on 9 November.
Costs are climbing faster than selling prices. A strong PPI headline is not the same as healthy reflation, so judge Chinese corporate earnings by margins, not by the PPI number.
What does a split economy mean for investors?
That margin squeeze shapes who wins and who loses. Goldman Sachs economists, cited by Bloomberg, flagged input prices outpacing output prices in both surveys.
| Exposure | Likely effect | Why |
|---|---|---|
| Property and construction | Pressured | Orders at 40.0; support is targeted |
| Materials and commodities | Mixed | Weak building demand for steel, cement and copper; supply discipline partly offsets |
| Exporters | Squeezed | Stronger yuan cuts the local value of dollar revenue |
| Importers | Helped | Cheaper commodities, energy and components |
| Chinese bonds | Mixed | Weak activity favours easing; firmer PPI and fiscal supply push the other way |
| Unhedged global holders | Currency gain | Yuan strength lifts the dollar value of Chinese assets |
The anti-involution campaign against destructive price-cutting appears to be lifting upstream prices before restoring pricing power downstream.
Policy is leaning fiscal. Bloomberg reported targeted mortgage discounts and extra local-government bond quotas, and a Reuters poll found economists expect Beijing to favour fiscal stimulus over visible monetary easing. Commerzbank’s Charlie Lay and Henry Hao said broad weakness strengthens the case for more support.
Weak Chinese activity is one input among several for internationally diversified portfolios, where Europe’s services contraction and US manufacturing strength have pulled regional allocations in different directions this year.
History offers two reference points:
- 2017: a managed yuan rise eased imported inflation but pressured exporters.
- 2020-21: the yuan rose on export receipts while domestic sectors stayed uneven.
The practical takeaway: treat rallies in property and construction names as policy-driven until orders, sales and starts improve together, and check the currency hedging on any China exposure you hold.
The signals that will show whether policy support is working
October’s numbers describe a split economy: soft domestic activity, squeezed margins and a deliberately tolerated stronger yuan. That is not a broad recovery.
Four signals will show whether that changes:
- The October PPI release on 9 November
- Whether construction new orders climb back from 40.0
- How the next PBOC fixings sit against spot
- Whether output prices stop falling
If orders recover and selling prices firm while the yuan rises steadily, support is gaining traction. If costs keep outrunning prices, the squeeze remains the story, whatever the currency does.
This article is for informational purposes only and should not be considered financial advice. Investors should conduct their own research and consult with financial professionals before making investment decisions. Estimates and forward-looking statements are speculative and subject to change based on market developments.