Two of the most closely watched names in American finance just posted Q2 2026 results that were not close calls. BlackRock’s assets under management crossed US$15.34 trillion. Morgan Stanley’s earnings per share came in 18% above what analysts had forecast, with equities trading revenue beating estimates by 41%. These were not beats at the margin.
When firms of this size and complexity outperform by this degree simultaneously, it tells investors something concrete about where the large-cap financial sector stands right now. The results landed on a single earnings day in July 2026, and they carry implications well beyond the two companies involved.
Here is what drove both sets of numbers, what the underlying data reveals about earnings quality, and a practical framework for reading what these results actually signal about the broader sector and the investment environment behind them.
BlackRock’s record quarter: the numbers behind the milestone
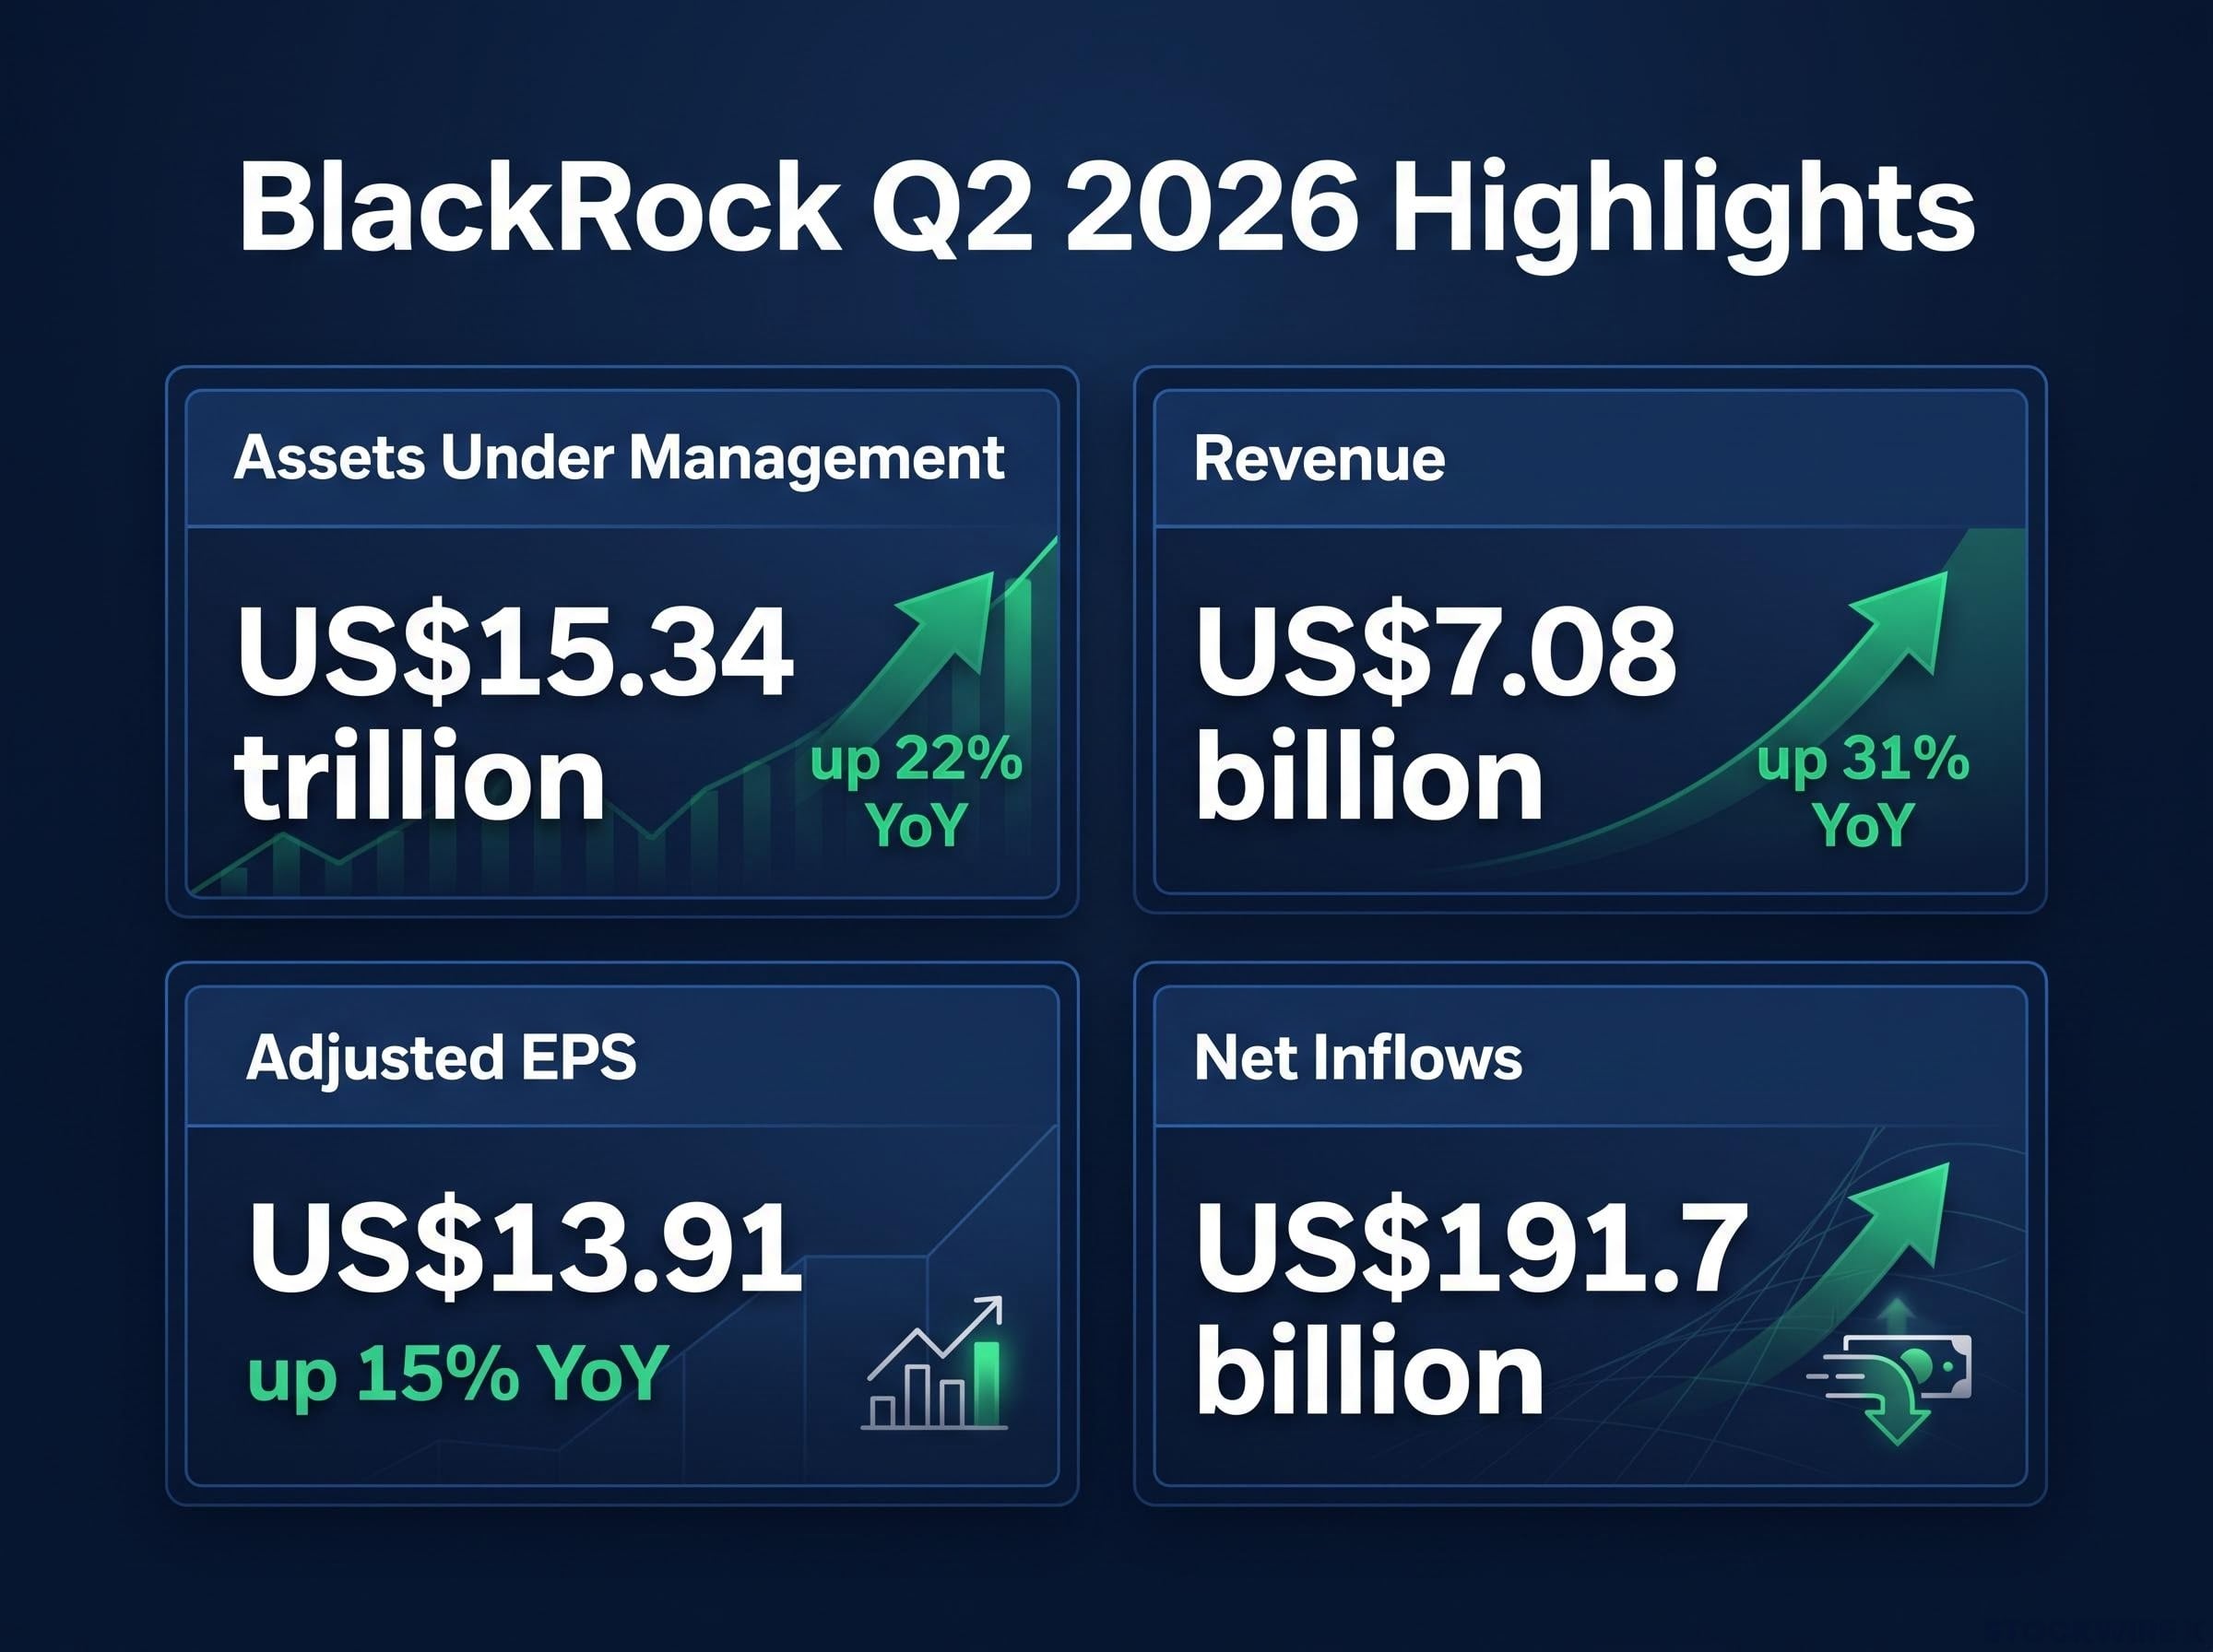
BlackRock’s assets under management reached US$15.34 trillion in Q2 2026, up 22% year-on-year, with the iShares ETF platform crossing US$6 trillion for the first time. Both are records, and neither was a function of market appreciation alone.
Net inflows of US$191.7 billion, including US$177.9 billion into ETFs, show the organic growth engine beneath the headline. Clients are actively choosing to put new money into BlackRock’s products, not simply watching existing holdings rise with the market.
The iShares milestone sits within a broader industry context: ETFGI global ETF industry data for May 2026 shows the worldwide ETF market reached a record US$23.08 trillion in assets, with iShares holding a 27.5% market share at US$6.34 trillion, underscoring how dominant BlackRock’s platform position has become.
The financial confirmation followed:
- Revenue: US$7.08 billion, up 31% year-on-year, 5% above the US$6.72 billion consensus
- Adjusted EPS: US$13.91, an 11% beat versus the US$12.57 consensus, 15% higher year-on-year
- AUM: US$15.34 trillion, up 22% year-on-year
- Net inflows: US$191.7 billion; ETF inflows of US$177.9 billion
- iShares AUM: US$6 trillion-plus
Base fees and securities lending revenue rose 29% to US$5.73 billion, tracking the asset base higher. But the more revealing line sat further down the income statement.
Performance fees surged 224% to US$305 million, signalling broad above-benchmark delivery across active and alternatives strategies.
That 224% surge tells you something specific: BlackRock’s active and alternatives strategies outperformed benchmarks broadly this quarter, not in a single product or a single pocket of the portfolio. That is a different and more durable signal than a one-strategy windfall.
BlackRock’s midyear outlook, published in early July 2026, provides the strategic investment framework behind the firm’s record quarter, including its trimming of Korean and Taiwanese equities after outsized gains and its reaffirmed overweight on U.S. equities anchored to structural AI and capital markets advantages.
When big ASX news breaks, our subscribers know first
Margin expansion and buybacks: what BlackRock’s operating leverage reveals
The earnings beat was the headline. The margin expansion is why it matters structurally.
BlackRock’s adjusted operating margin came in at 45.9%, a gain of 260 basis points compared with the same period a year earlier. Adjusted operating income climbed 39% to reach US$2.92 billion. Revenue grew faster than costs, and by a meaningful degree.
A 260 basis point margin expansion in a single year means BlackRock is keeping a larger share of every dollar of new revenue than it did twelve months ago. That is a concrete sign that scale economics are working in shareholders’ favour, not just growing for growth’s sake.
Shares jumped 6.6% on the day results were published, yet the stock has delivered little movement on a year-to-date basis, indicating that investors had factored in a solid outcome before the numbers arrived. The single-day gain reflected the scale of the beat rather than a surprise that the quarter would be strong.
What the buyback increase signals about management confidence
- Full-year 2026 planned buybacks were raised to US$2 billion
- The quarterly repurchase amount was lifted to US$550 million
Management authorising larger buybacks communicates their internal conviction that current earnings power is sustainable and that the stock represents good value relative to future cash flows. Buyback decisions carry more weight than guidance language because they commit real capital.
Driving Morgan Stanley’s record quarter: the surge in trading and banking
Morgan Stanley’s equities sales and trading business generated US$6.30 billion in Q2 2026, a 69% increase year-on-year that came in 41% ahead of the US$4.47 billion analyst estimate. That single line drove the quarter.
Investment banking added another layer: revenue of US$2.44 billion, up 58% year-on-year and 11% above the US$2.20 billion consensus, reflecting a strong rebound in mergers and acquisitions, equity issuance, and debt deals.
Across the whole firm, net revenue of US$21.35 billion represented a 27% year-on-year increase and came in 9% ahead of consensus, while EPS of US$3.46 beat expectations by 18% and was approximately 62% higher than the figure posted in Q2 2025.
Morgan Stanley’s S&P 500 price target, built on an earnings expansion thesis projecting $339 EPS for 2026 rather than multiple expansion, gained additional credibility when Q1 2026 delivered an 84% beat rate and 27.7% blended EPS growth, the strongest quarterly result in four years.
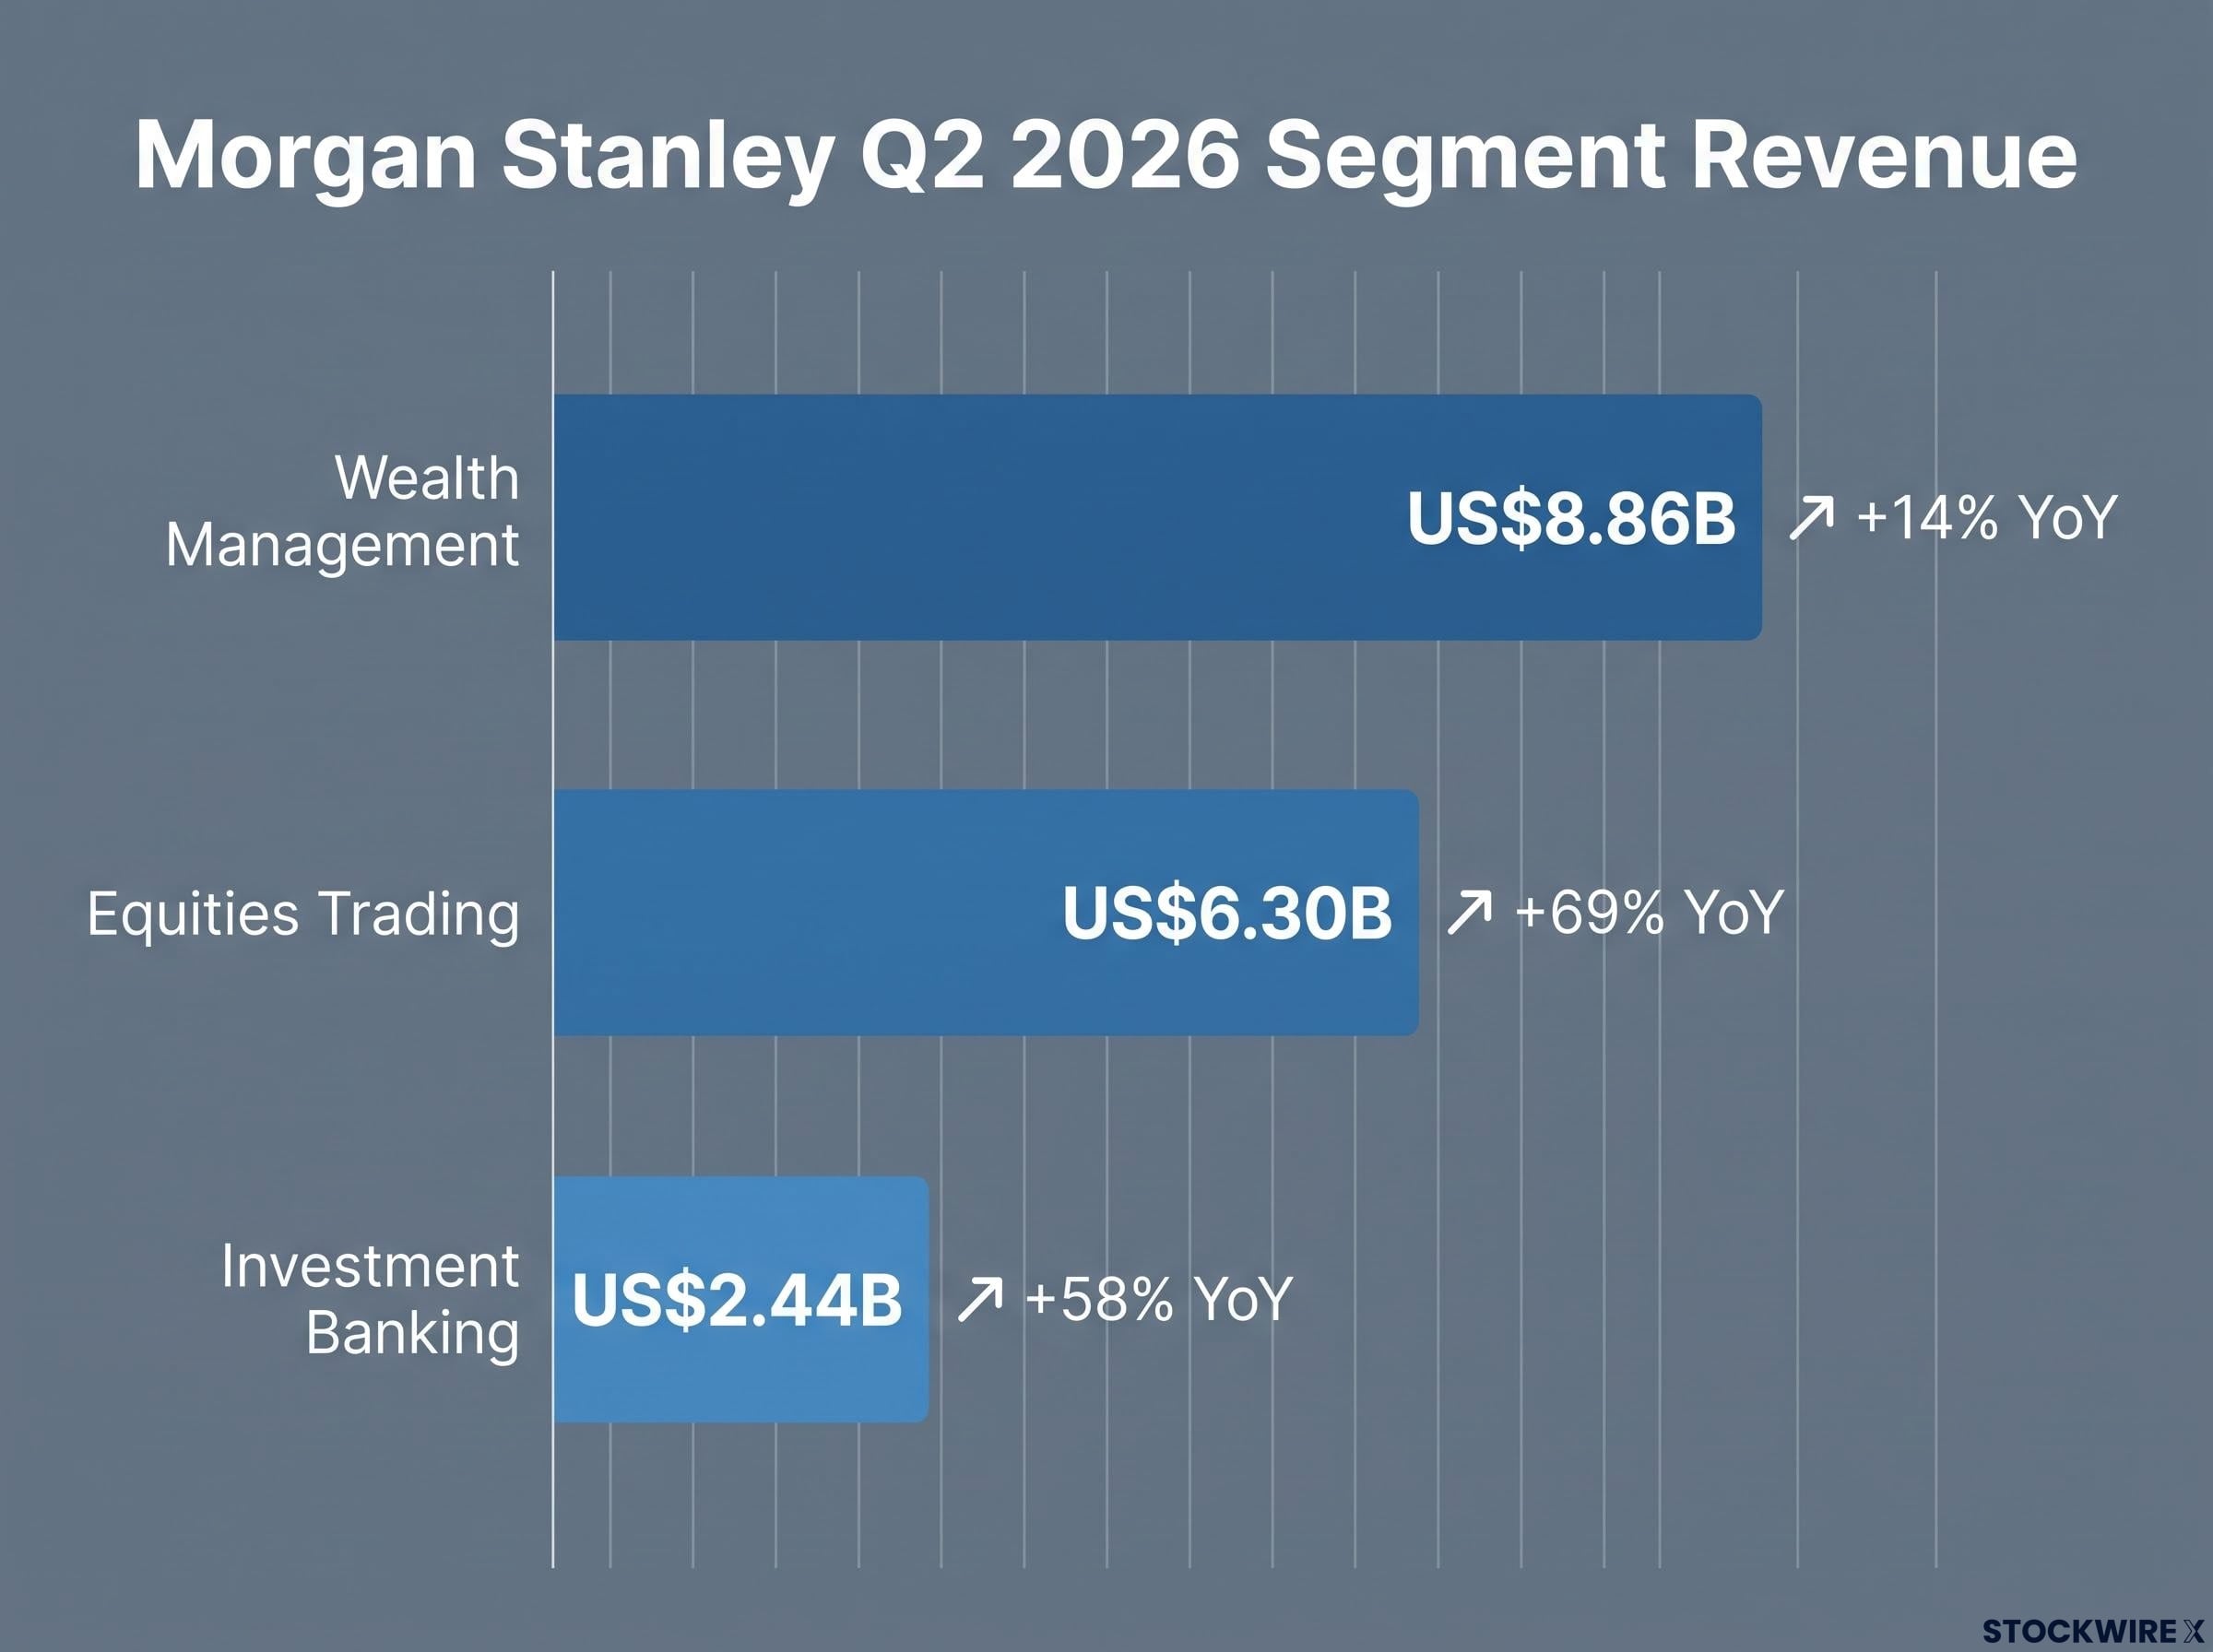
| Segment | Reported Revenue | Analyst Estimate | Beat (%) | Year-on-Year Change |
|---|---|---|---|---|
| Equities Trading | US$6.30B | US$4.47B | 41% | +69% |
| Investment Banking | US$2.44B | US$2.20B | 11% | +58% |
| Wealth Management | US$8.86B | ~US$8.69B | ~2% | +14% |
A 69% year-on-year surge in equities trading revenue tells you that client activity levels and market volatility were exceptionally favourable this quarter. That is a powerful tailwind, but it is also one that does not arrive every quarter on demand.
Wealth management and the recurring revenue floor
The trading result grabbed the headline. The wealth management result may matter more over the longer run.
The wealth management division posted revenue of US$8.86 billion, a 14% year-on-year gain that edged 2% above consensus. The more significant figure sitting alongside it was net new assets of US$148.1 billion, a quarterly record, which pushed total wealth management client assets to approximately US$8 trillion. Investment management AUM sits at approximately US$2 trillion.
Record net new assets of US$148.1 billion signal that Morgan Stanley is converting current market strength into durable, forward-looking fee income.
That record matters because of what it represents mechanically. Net new assets of US$148.1 billion in a single quarter means Morgan Stanley is converting a favourable market environment into future recurring fee income, not booking a one-quarter windfall. Wealth management fees are tied to client assets; when those assets grow through net inflows rather than just market appreciation, the revenue base becomes more durable.
The capital return announcements reinforced the picture:
- New share buyback authorisation of up to US$20 billion
- Quarterly dividend raised by US$0.15 to US$1.15 per share
Shares finished the session 0.3% higher, reaching a fresh all-time high, extending a year-to-date advance of 29.4%. Where BlackRock saw a single-day pop, Morgan Stanley’s result extended a rally that has been building throughout 2026.
What strong earnings look like: a framework for reading financial sector results
Not all earnings beats are equal. An 18% EPS beat driven by trading revenue in a high-volatility quarter tells a different story than an 18% beat driven by recurring wealth management fees. The quality of the beat matters as much as the size.
Here is a four-part framework for evaluating any bank or asset manager earnings report this season:
- Source and quality of the earnings beat: Is the outperformance coming from recurring revenue lines (base fees, wealth management fees, net interest income) or more volatile lines (performance fees, trading, one-off gains)? Morgan Stanley’s record net new assets of US$148.1 billion are a recurring quality signal. BlackRock’s 224% performance fee surge is real upside, but depends on above-benchmark returns that may not repeat every quarter.
- Operating leverage and cost discipline: Is revenue growth outpacing expense growth? BlackRock’s 260 basis point margin expansion to 45.9% is a clear example of scale economics working.
- Capital return policy and balance sheet: Buyback size and dividend growth communicate management’s conviction about earnings sustainability more directly than forward guidance language. Morgan Stanley’s US$20 billion buyback authorisation is a firm-level statement of confidence.
- Business mix and cycle sensitivity: Firms weighted toward fee-based wealth and asset management carry lower earnings volatility than those more reliant on trading and capital markets revenue.
Why recurring revenue lines matter more than one-quarter windfalls
Recurring revenue in the financial sector means base management fees, wealth management fees tied to client assets, and net interest income, revenue that rebuilds quarter after quarter as long as clients stay and assets remain on the platform.
Performance fees and trading revenue are real and valuable, but they depend on market conditions and client activity levels that can shift. The distinction between the two is the analytical step that separates a strong quarter from a structurally stronger business.
Applying this four-part framework to any financial sector earnings report this season will tell you whether a headline beat reflects a business gaining structural strength or a firm that simply had a good quarter for reasons that may not repeat.
Rigorous earnings report analysis applies the same logic the four-part framework above outlines: a seven-step checklist covering revenue source, GAAP versus non-GAAP gaps, free cash flow alignment, margin direction, and forward guidance separates genuine business momentum from one-quarter performance that market conditions artificially inflated.
The next major ASX story will hit our subscribers first
What the Q2 2026 results confirm about the large-cap financial sector
The convergence of record results at two firms with fundamentally different business models is not coincidence. It tells you that the current environment is rewarding the structural advantages of large-cap financial platforms broadly, not just one business type.
Three concurrent conditions underpin both results:
- Healthy equity markets supporting AUM-based fees and asset valuations
- Elevated volatility and client activity fuelling trading volumes
- A rebounding corporate dealmaking environment driving investment banking pipelines
Scale is the differentiating mechanism. BlackRock’s ability to grow AUM to US$15.34 trillion while expanding margins, and Morgan Stanley’s ability to generate record trading revenue while building an US$8 trillion wealth management floor, are both functions of being large enough to benefit from all three tailwinds simultaneously.
The same tailwinds visible in BlackRock and Morgan Stanley’s numbers appear across big bank earnings more broadly, with JPMorgan reporting an 86% surge in equity trading revenue and Wells Fargo attributing a 17% profit gain directly to consumer lending strength, confirming that the favourable environment is sector-wide rather than firm-specific.
The capital return decisions confirm the picture. BlackRock’s US$2 billion buyback lift and Morgan Stanley’s US$20 billion authorisation plus dividend raise both tell the same story: excess capital is real, and management at both firms believes current earnings power is sustainable enough to return it rather than hold it.
Capital return at this scale is management’s most concrete statement about the durability of current earnings, more reliable than any forward guidance language.
These results reflect a specific and unusually supportive market environment, and sector performance remains sensitive to interest rates, regulation, and the credit cycle. The tailwinds are real; assuming they are permanent would be a mistake.
Making sense of these results before the rest of earnings season plays out
Two firms with different models both beat substantially in the same quarter. That is a meaningful data point about sector conditions rather than company-specific idiosyncrasy. When the asset manager and the investment bank both outperform, the environment itself is doing work.
When evaluating other financial sector earnings this season, the framework applies directly: look at the source of the beat, check for operating leverage, read the capital return decisions as conviction signals, and weigh the business mix for cycle sensitivity. Those four dimensions will tell you more than the headline EPS number alone.
The environment has been unusually supportive. Whether the conditions underpinning these results, active equity markets, strong client activity, and recovering deal pipelines, persist through the second half of 2026 is the ongoing analytical task. These results tell you where the sector stands right now. They do not guarantee where it stands next quarter.
This article is for informational purposes only and should not be considered financial advice. Investors should conduct their own research and consult with financial professionals before making investment decisions. Past performance does not guarantee future results.