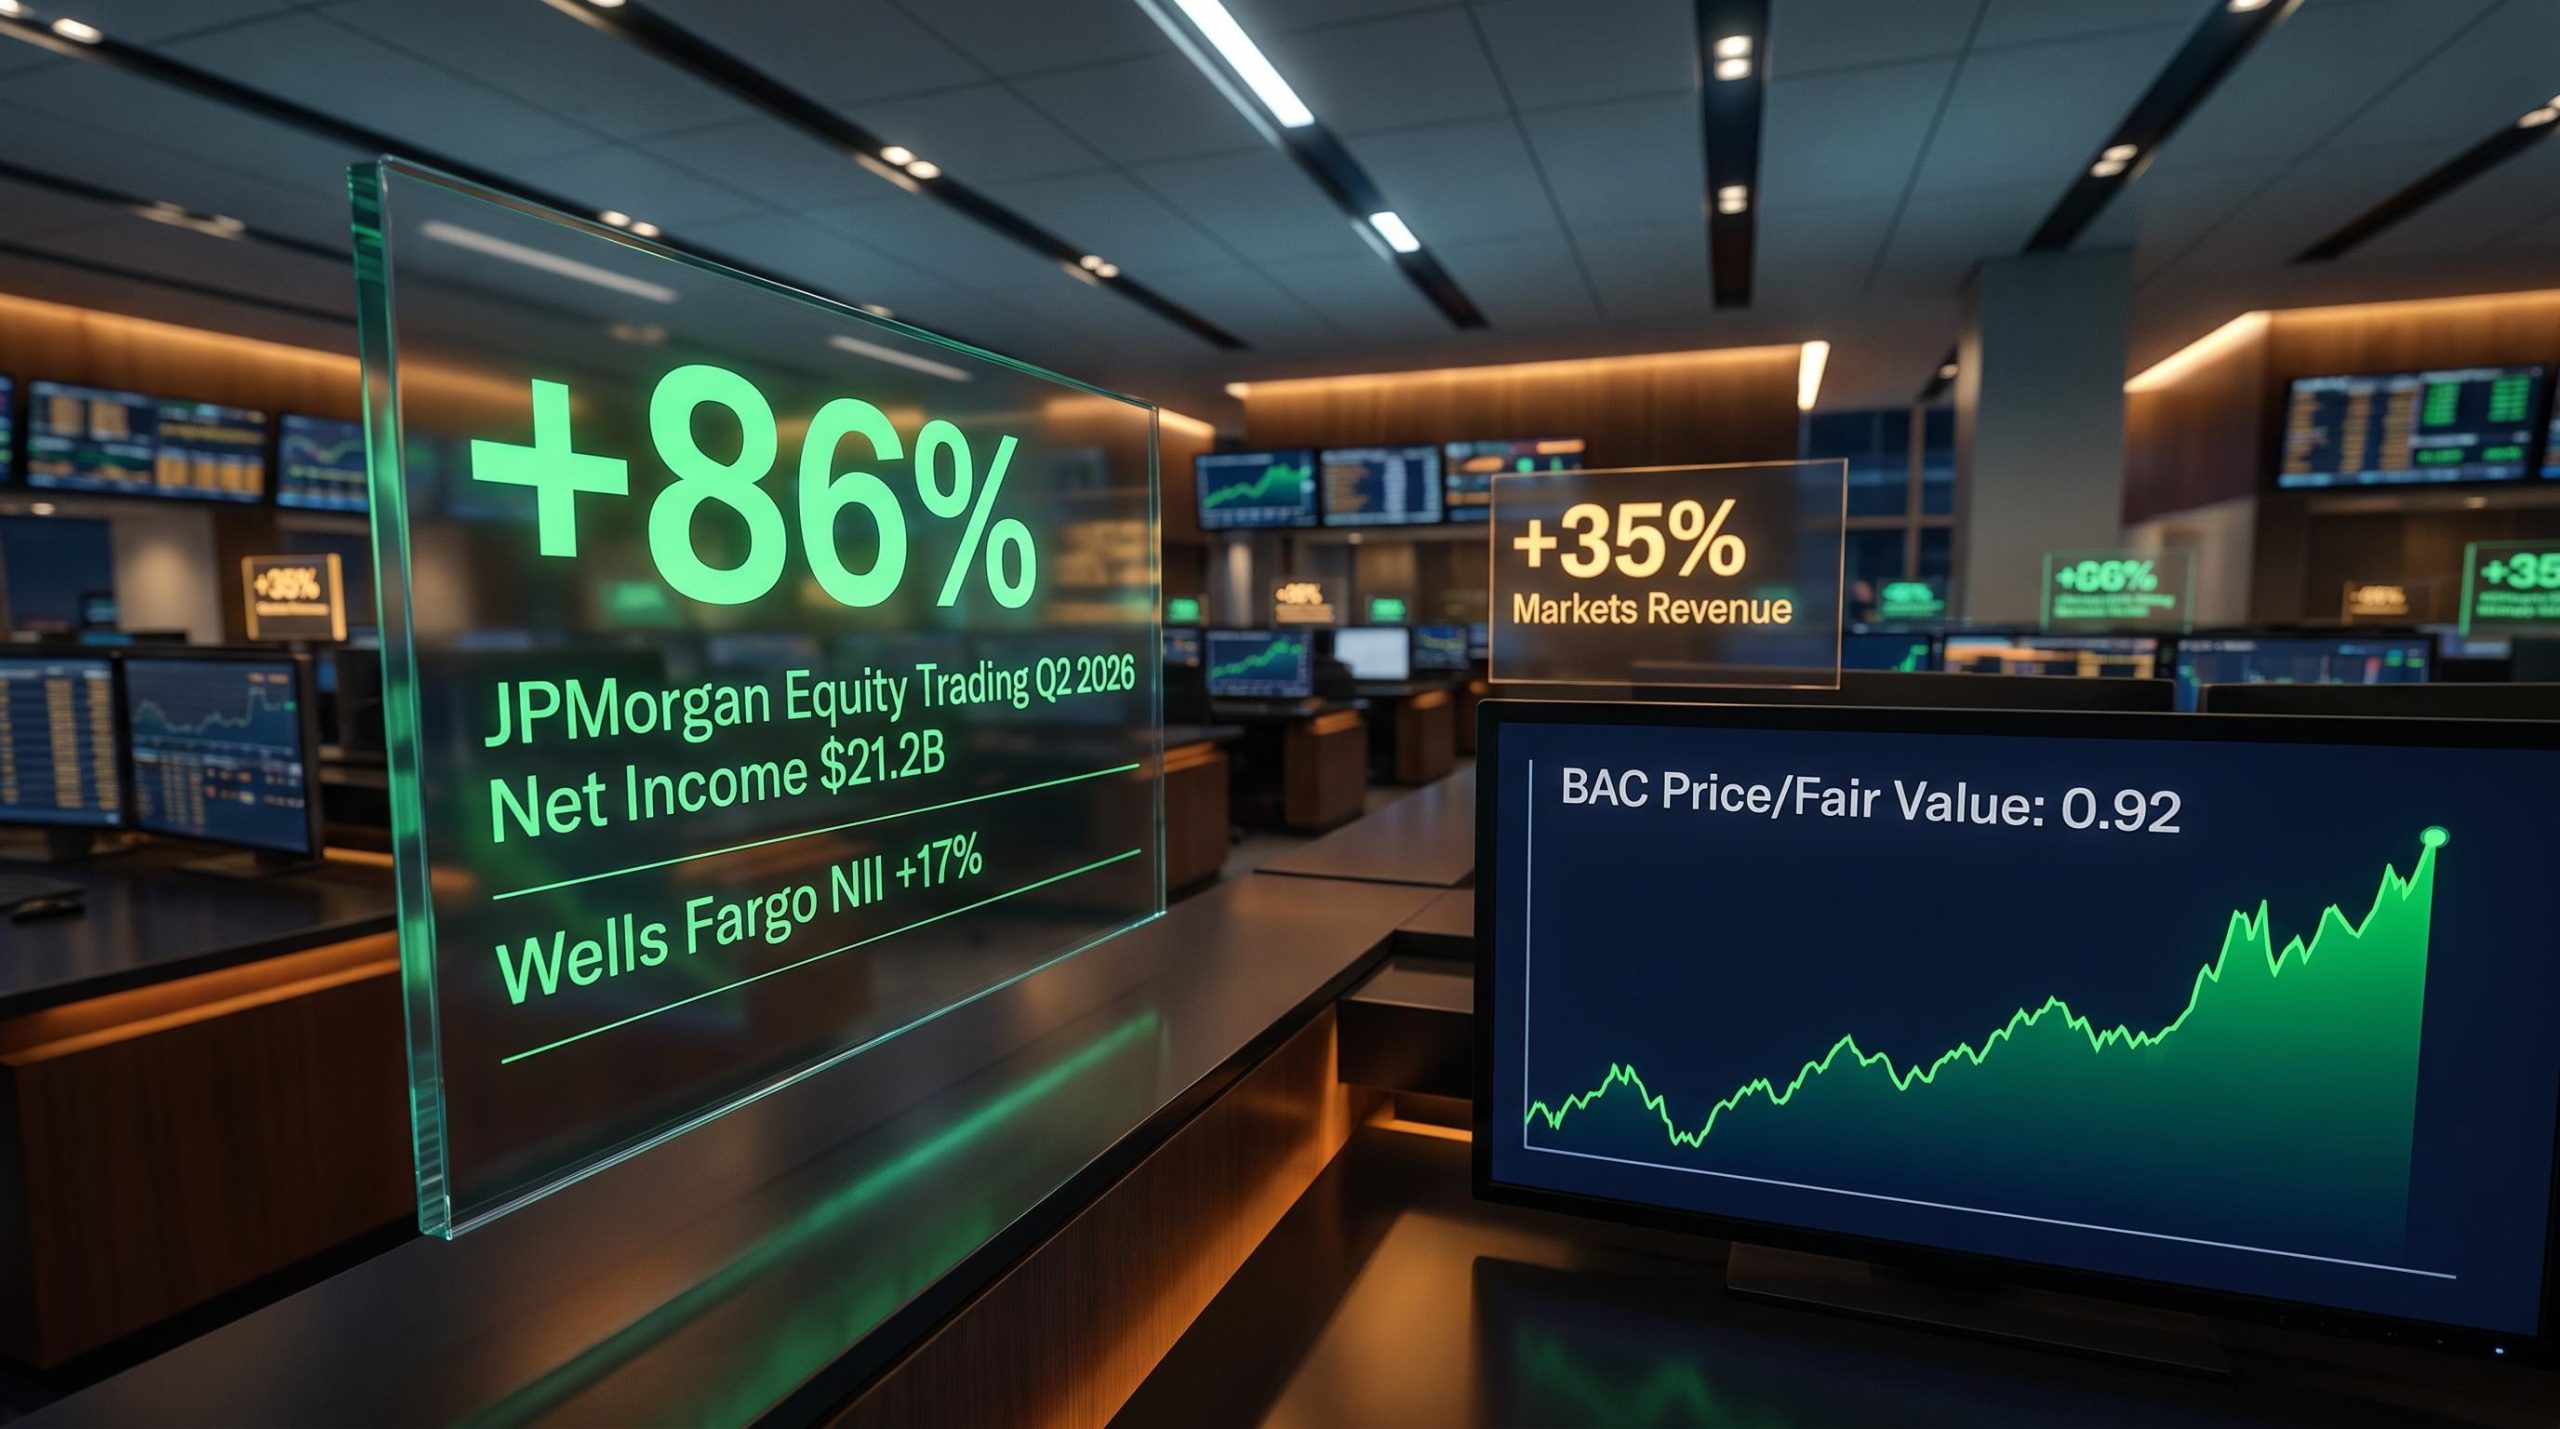
Three of the largest banks in the world reported Q2 2026 results on the same morning, and their combined balance sheets touch nearly every corner of the US economy. If you want to know whether the expansion is still running or beginning to fray, 15 July 2026 is the day that answers the question with actual numbers rather than forecasts.
JPMorgan Chase and Wells Fargo have already published their figures. Bank of America’s results are expected imminently. Taken together, the three sets of numbers decode four themes that matter far beyond bank stock performance: consumer credit health, net interest income trajectory, trading and dealmaking activity, and capital return confidence. Each one is a direct read on a different dimension of US economic momentum.
Here is what the numbers already in hand reveal about the economy, what Bank of America’s results will either confirm or complicate, and what independent valuations tell you about whether these stocks are priced to reflect the reality their own earnings describe. The goal is not a summary you read after the fact; it is a framework you can use while the data is still crossing the wire.
What JPMorgan and Wells Fargo just told us about the US economy
JPMorgan reported net income of $21.2 billion ($7.70 per share), a headline figure that includes significant items, primarily a large Visa-related gain. Strip those out and the adjusted number is $16.9 billion ($6.14 per share). Both figures matter: the reported number is circulating because it is a record; the adjusted figure is the one that tells you what the underlying business actually earned. Both beat consensus.
Wells Fargo posted Q2 net income of $6.4 billion ($2.00 per share), with net income rising 17% year-over-year and EPS climbing 25%. Revenue of $22.6 billion beat estimates.
CEO Charlie Scharf linked the performance explicitly to a “strong economy”, a characterisation that carries weight when it comes from a management team overseeing one of the largest consumer lending books in the country.
Two of the biggest lenders in the country just reported strong loan volumes and profit growth simultaneously. That combination tells you businesses and consumers are still borrowing and spending at a rate inconsistent with an economy in early contraction.
The Q2 2026 earnings season arrived with the finance sector projected to post 12.6% EPS growth and 8.4% revenue growth year-on-year, a consensus baseline that JPMorgan and Wells Fargo have already exceeded, setting a high bar for the institutions yet to report.
| Metric | JPMorgan Chase | Wells Fargo |
|---|---|---|
| Net Income | $21.2B (reported) / $16.9B (adjusted) | $6.4B |
| EPS | $7.70 (reported) / $6.14 (adjusted) | $2.00 |
| YoY Net Income Growth | Record quarter | +17% |
| Revenue | Record quarter | $22.6B (beat estimates) |
When big ASX news breaks, our subscribers know first
How borrowing demand and bank balance sheet mechanics shape the economic outlook
The headline profits grab attention, but the metric that matters most as an economic indicator is what sits underneath them. JPMorgan’s net interest income (NII) excluding markets rose 4% year-over-year to $23.7 billion. Average loans grew 10%. NII is the revenue a bank earns from the difference between what it charges borrowers and what it pays depositors, and when it rises alongside loan growth, the signal is clear: borrowing demand is genuinely strong, not just propped up by high interest rates.
- NII ex-markets: $23.7 billion (+4% YoY), showing underlying lending profitability expanding
- Average loans: +10% YoY, the strongest volume signal of real credit demand
- Morningstar analyst Austin Taggart projects Q2 2026 loan growth may come in at its strongest reading in roughly three years, adding forward-looking weight to the volume gains already on the scoreboard
What the higher-for-longer rate environment means for NII trajectory
Mid-2026 market consensus points to the Fed holding rates steady well into 2027, extending the structural tailwind for bank NII rather than trimming it. Bank balance sheets are positioned to gain from a sustained high-rate environment because loan and securities yields tend to adjust upward more quickly than the rates banks pay on deposits. A flattening yield curve during Q2 introduced a partial offset, but results show the volume gains have more than compensated.
The Fed rate hold at 3.5%-3.75% is now confirmed as a deliberate policy posture rather than a pause before easing, with Fed Chair Kevin Warsh telling Congress on 14 July 2026 that the FOMC is unanimous in its commitment to price stability and that the 2% inflation target is non-negotiable.
When the largest bank in the country reports loan growth at a multi-year high while the Fed is on hold through 2027, the read-through is that businesses and households see the rate environment as liveable, not paralysing, and are still committing to credit.
The trading and dealmaking surge that is reshaping bank revenue
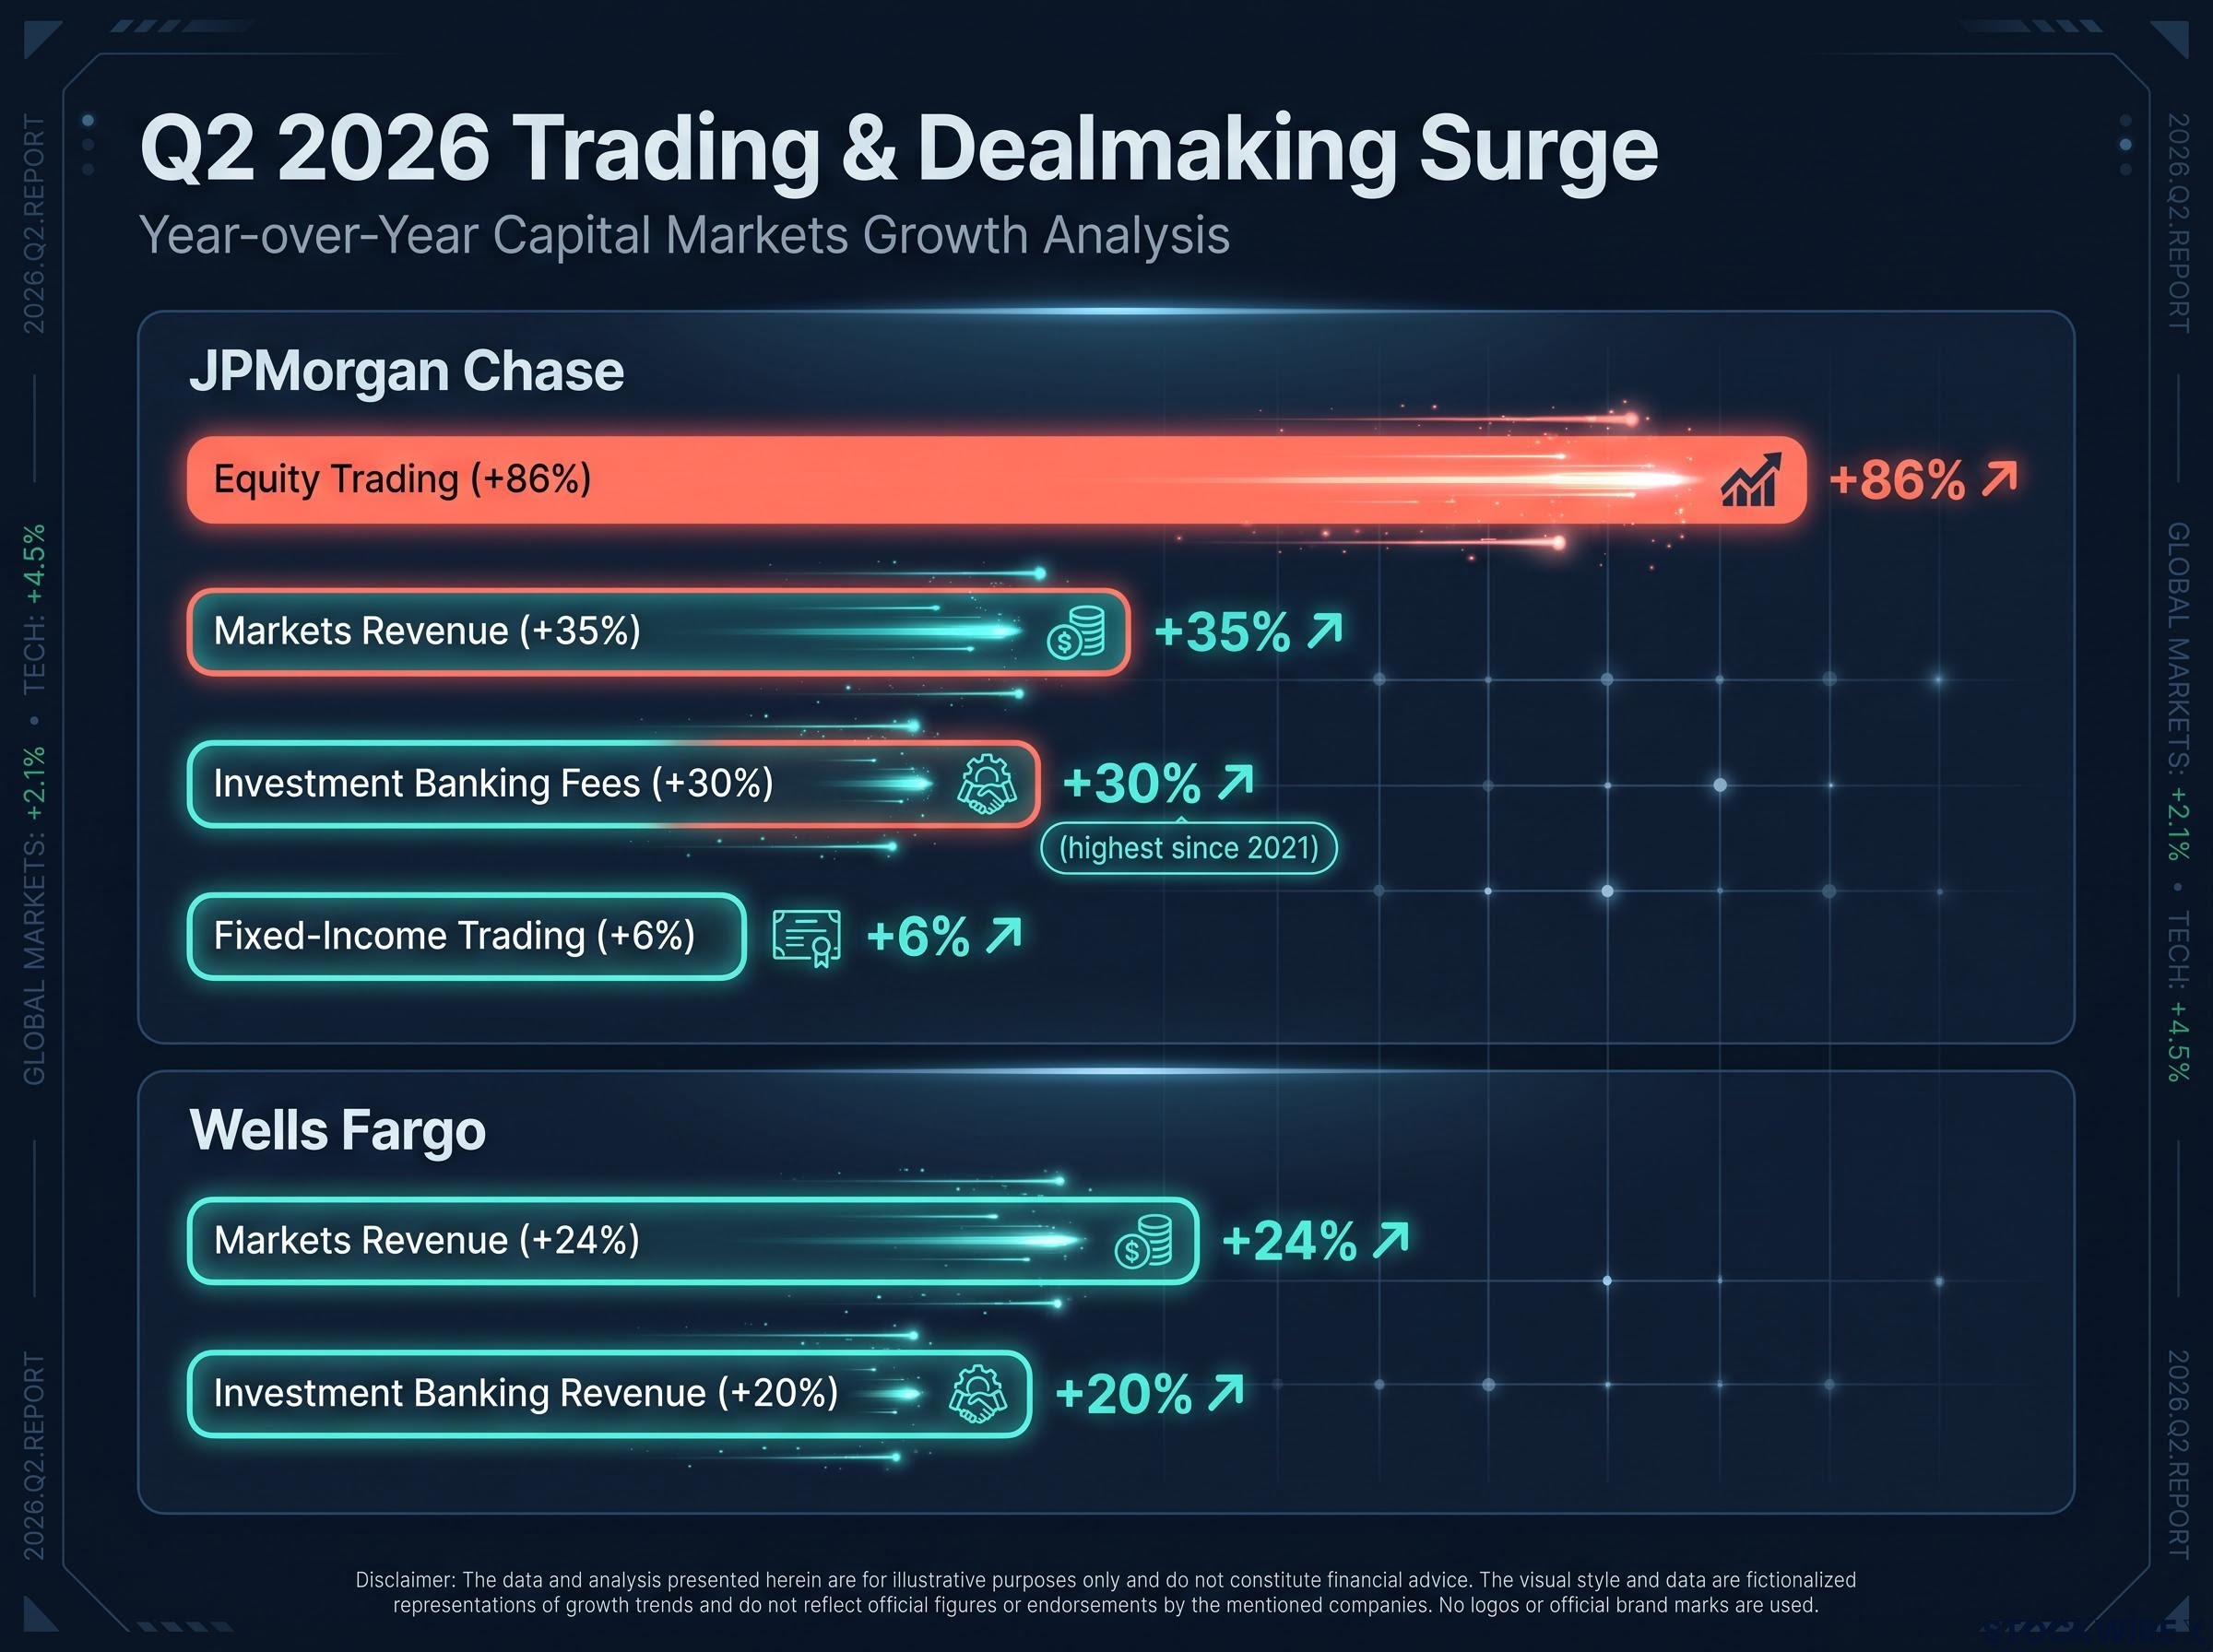
Capital markets revenue did not just beat expectations. It escalated through every category. Start with JPMorgan’s fixed-income trading, up 6% year-over-year, a steady but unremarkable gain. Then markets revenue overall: up 35%. Then investment banking fees: up 30%, the highest since 2021, driven by a wave of IPO and M&A activity.
The investment banking fee cycle driving JPMorgan’s 30% surge to its highest level since 2021 is partly a function of a structural shift in equity issuance, with Alphabet’s $80 billion capital programme alone swinging US net equity supply by $84 billion and a pipeline of AI-era IPOs generating sustained deal activity.
Then the number that stops you: equity trading surged 86% year-over-year.
JPMorgan equity trading revenue: +86% year-over-year, the standout figure in a quarter defined by institutional repositioning.
That is not a single-bank anomaly. Wells Fargo independently confirmed the trend:
- Markets revenue up 24% year-over-year
- Investment banking revenue up 20% year-over-year
Since 2020, trading revenue has persistently run above its long-run historical baseline, and 2025 proved to be a record-breaking year for the category. Rather than reverting toward the mean in Q2 2026, volumes appear to have extended the streak, powered by a sustained combination of geopolitical uncertainty and elevated asset prices that keeps institutional activity high.
An 86% surge in equity trading at JPMorgan, confirmed by a 24% markets revenue gain at Wells Fargo, tells you institutional investors are actively repositioning in a high-uncertainty environment. Corporate deal pipelines have not frozen despite macro headwinds.
Consumer credit health and the K-shaped risk hiding beneath the headline numbers
The surface looks reassuring. Loan growth of 10% at JPMorgan, a revenue beat at Wells Fargo, and management language describing consumers as “resilient” all point to a healthy borrower base. At the aggregate level, there is no sign of a broad consumer credit crack.
Look closer and the picture becomes more complicated.
The aggregate picture of consumer debt health is complicated by composition: credit cards represent only about 7% of total US household debt, which is why a 15-year high in card delinquencies can coexist with record household net worth of $184.1 trillion and near-historic-low mortgage delinquency rates.
Where the stress is concentrated
The concern is not the average. It is the distribution. Three specific pressure points are worth watching:
- Late-stage auto loan delinquencies (those past the 60-day mark) have been moving steadily higher, a sign of pockets of strain among borrowers carrying vehicle debt originated at elevated rates
- The household savings buffer has eroded, with personal savings rates sitting below their pre-pandemic norms, which means consumers have less financial slack than headline spending figures imply
- Student loan pressures among lower-income borrowers are likely to surface in management commentary, even though these obligations do not appear on bank balance sheets and instead serve as a broader indicator of household financial stress
JPMorgan management has been explicit about the trajectory. The consumer is resilient today, but wages for some cohorts are not keeping pace with inflation, and management has acknowledged that “we’re going to have a credit cycle” eventually. That is not alarmism. It is the kind of late-cycle honesty that distinguishes a resilient consumer from an invincible one.
The headline loan growth figure tells you the average. The K-shaped data tells you the distribution. For anyone assessing credit risk or considering bank stocks, the distribution matters more than the average right now. The full Q2 credit quality disclosure, including charge-off rates and delinquency tables, will appear in earnings supplements and call transcripts. Today’s headlines are a first read, not the complete picture.
How the three banks are priced relative to what they are actually worth
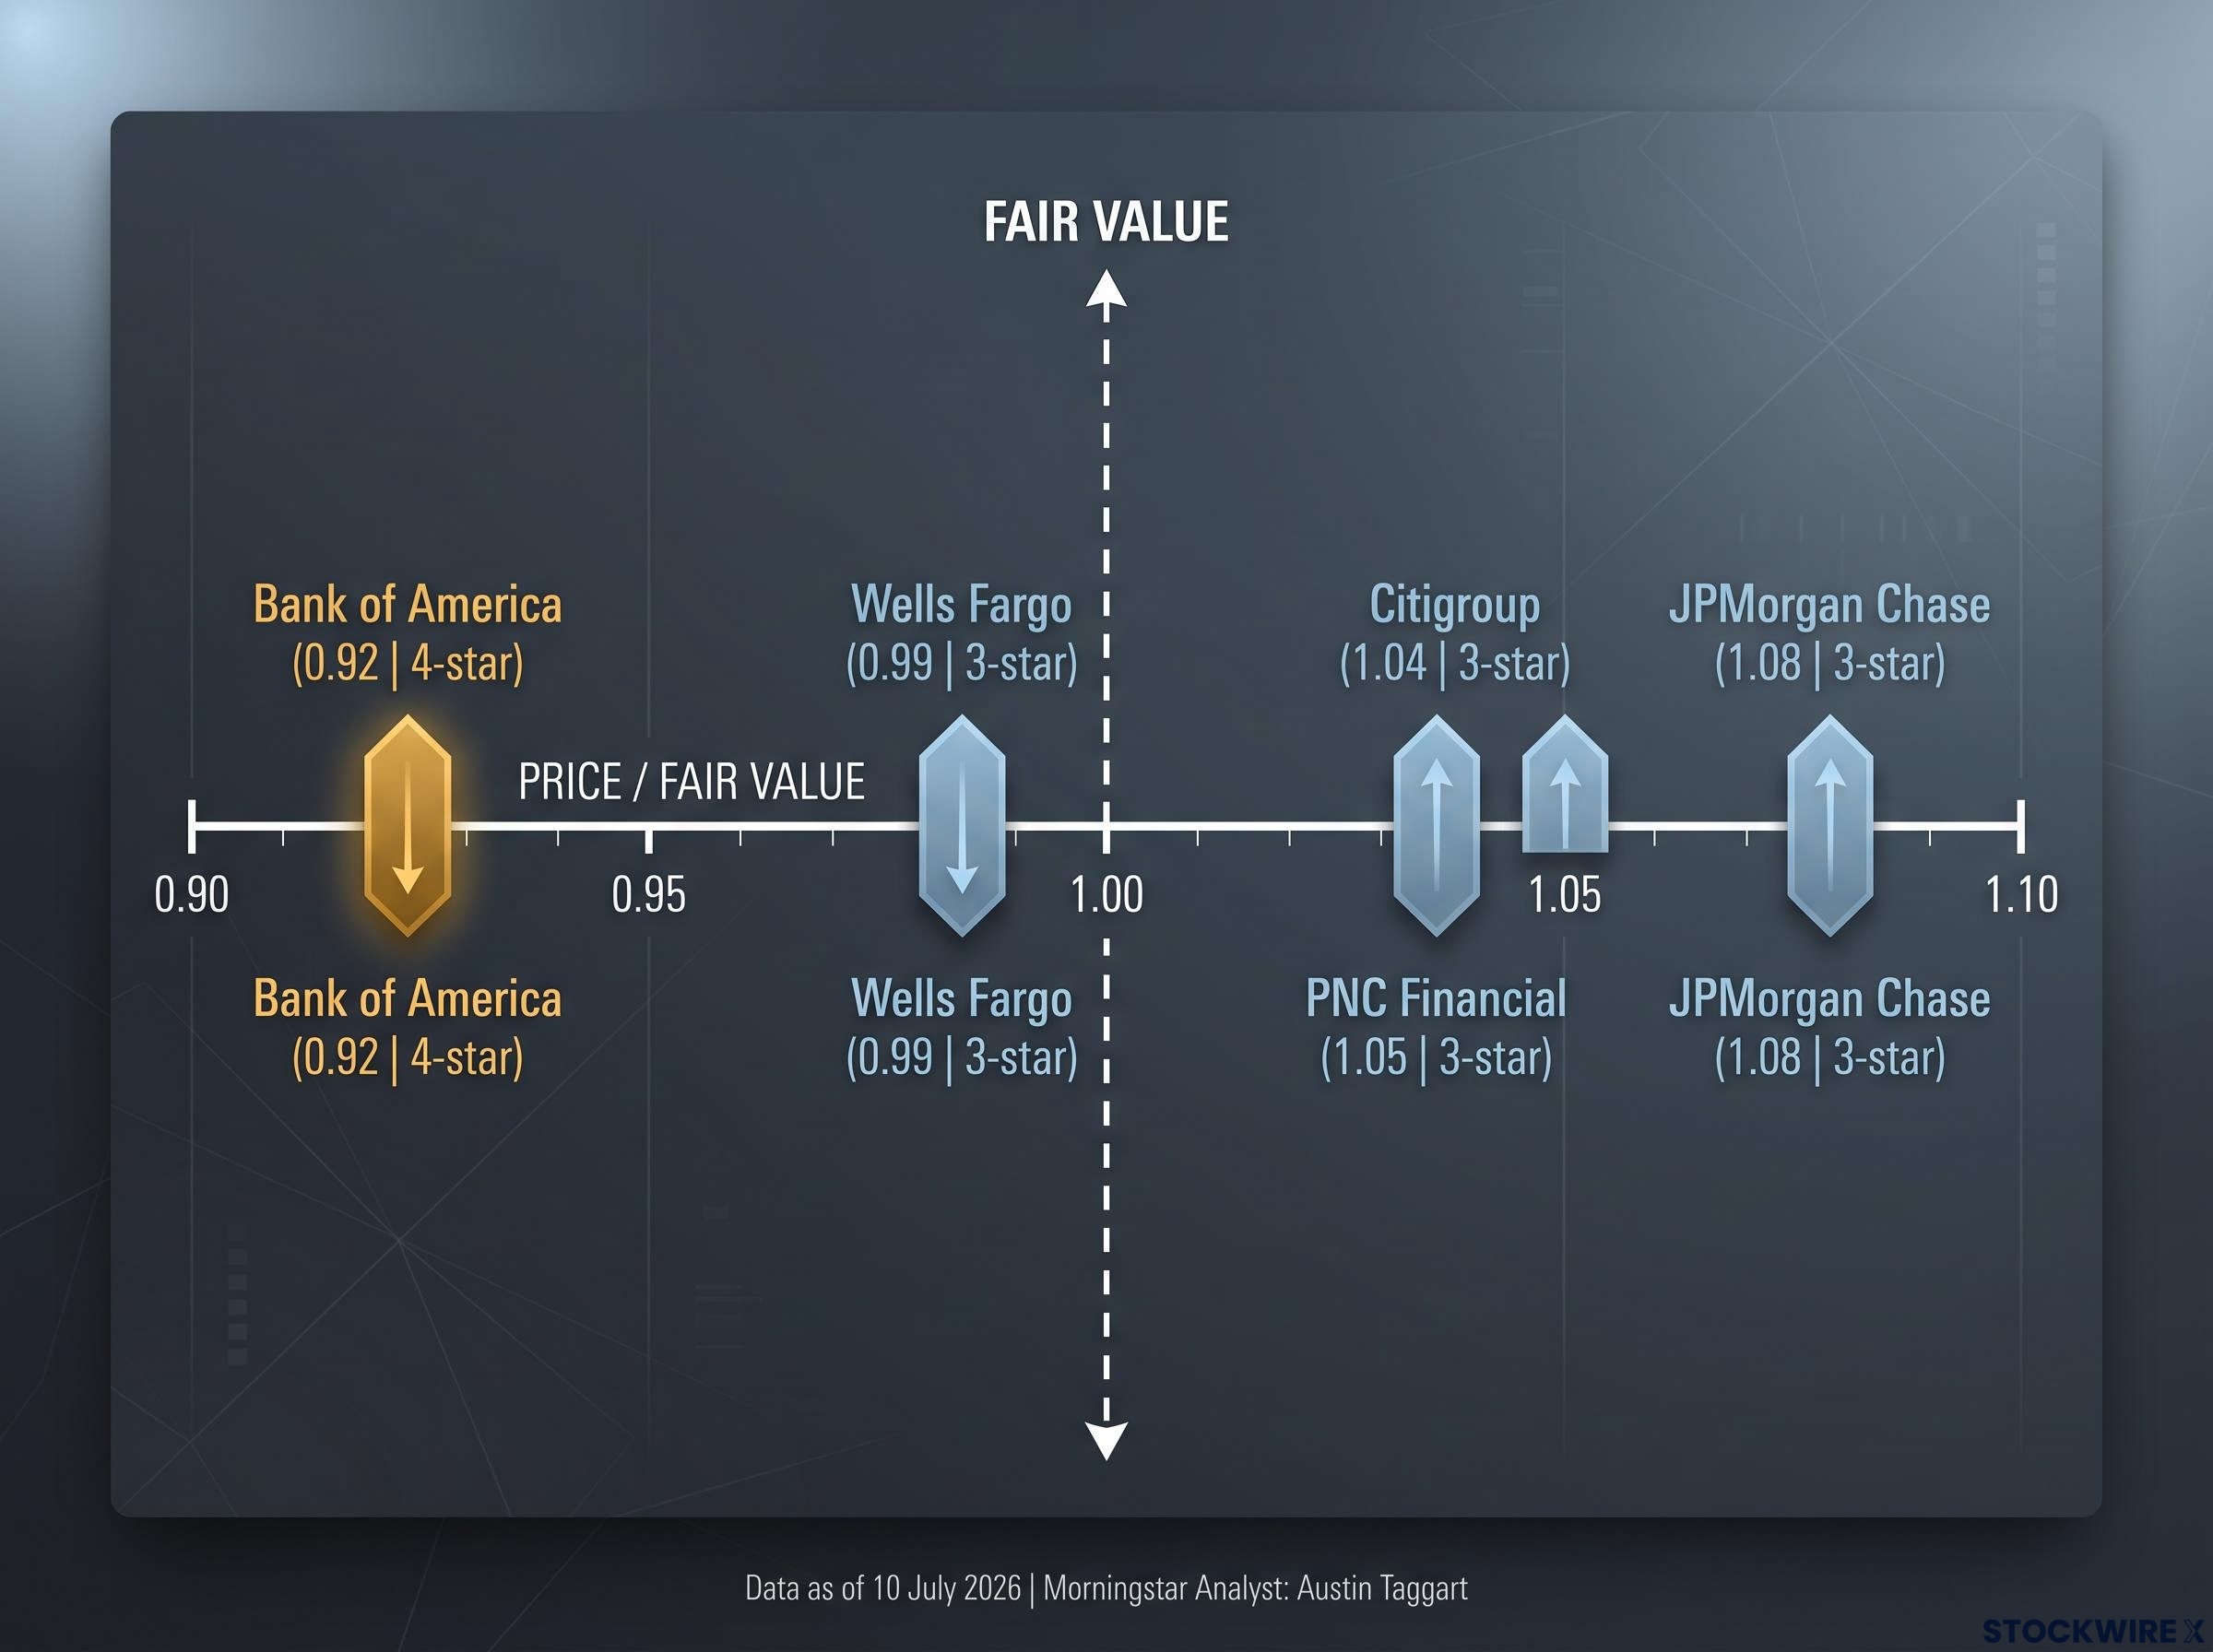
Morningstar’s valuations as of 10 July 2026 (analyst: Austin Taggart, Morningstar equity analyst) provide the context that separates a strong earnings print from a genuine investment opportunity.
| Bank | Morningstar Rating | Price / Fair Value | 1-Year Return | YTD Return |
|---|---|---|---|---|
| Bank of America (BAC) | ★★★★ (4-star) | 0.92 | +29.42% | +9.51% |
| Citigroup (C) | ★★★ (3-star) | 1.04 | +64.44% | +21.68% |
| JPMorgan Chase (JPM) | ★★★ (3-star) | 1.08 | +18.83% | +5.82% |
| PNC Financial (PNC) | ★★★ (3-star) | 1.05 | +30.69% | +22.32% |
| Wells Fargo (WFC) | ★★★ (3-star) | 0.99 | +8.01% | -5.52% |
Wells Fargo at 0.99 price-to-fair-value is the most straightforward case: roughly fairly valued, with Q2’s 17% profit growth potentially helping close a -5.52% YTD performance gap. JPMorgan at 1.08 trades at a modest premium, consistent with a best-in-class franchise. Record Q2 results reinforce what investors already paid for rather than dramatically rerating the stock.
Bank of America is the most analytically interesting case: the only four-star-rated major bank, trading at 0.92 price-to-fair-value, a meaningful discount heading into unreleased Q2 results.
That discount means BAC’s results carry stakes beyond the bank itself. If the numbers confirm the sector’s strength, that gap narrows. If they disappoint on credit or NII, it persists or widens.
Four questions Bank of America’s results will answer for the sector
BAC’s results are the final piece, and their arrival last in the sequence gives them disproportionate diagnostic power. Four specific questions will determine whether today’s sector story closes on a strong note or introduces a qualification:
- Consumer credit: Do card and auto delinquency trends by income segment confirm JPMorgan’s “resilient” characterisation, or reveal a sharper K-shaped divergence? A strong answer reinforces the late-cycle thesis. A weak one raises the timeline on credit deterioration.
- NII and loan growth: Does second-half 2026 guidance under higher-for-longer rates sustain the sector’s NII optimism, or flag headwinds JPMorgan and Wells Fargo did not? Confirmation extends the earnings tailwind narrative. Disappointment introduces doubt about rate sensitivity.
- Capital markets: Does BAC’s trading and investment banking performance match JPMorgan’s +35% markets revenue and Wells Fargo’s +24%, or lag? Confirmation makes elevated trading a sector story. A miss makes it a JPMorgan story.
- Capital returns: How confident is management’s tone on dividends and buybacks, bearing in mind that Basel III Endgame rules remain unfinished and stress capital buffers are not due to be reset until 2027? JPMorgan’s board approved a Q3 dividend of $1.65 per share. Whether BAC matches that measured confidence or shows greater caution signals how management reads the regulatory and cyclical outlook.
BAC’s 0.92 price-to-fair-value discount is the stakes. These four answers will determine whether it was a buying opportunity or a warning.
What the full Q2 picture will confirm about where the US economy actually stands
Strong loan growth. Resilient NII. A trading boom that refuses to normalise. Measured capital return confidence. Read together, the four themes describe a late-cycle US expansion that is slowing from a high level rather than cracking.
The combined signal from Q2 2026 big bank earnings is cautiously constructive rather than complacently bullish.
Two qualifications keep this from being an all-clear. Bank of America’s results are not yet confirmed, and consumer credit stress is concentrated in specific cohorts rather than broadly distributed, meaning the picture could look different by end of business today. The K-shaped risk is real, even if the headline numbers do not yet reflect it.
For you, the four themes covered here are not just a lens on today’s results. They are the analytical framework through which to interpret every major bank earnings cycle going forward, because they are the questions that connect bank performance to economic reality. Today’s big bank earnings are not background noise. They are among the most direct real-time economic indicators available.
This article is for informational purposes only and should not be considered financial advice. Investors should conduct their own research and consult with financial professionals before making investment decisions. Past performance does not guarantee future results.