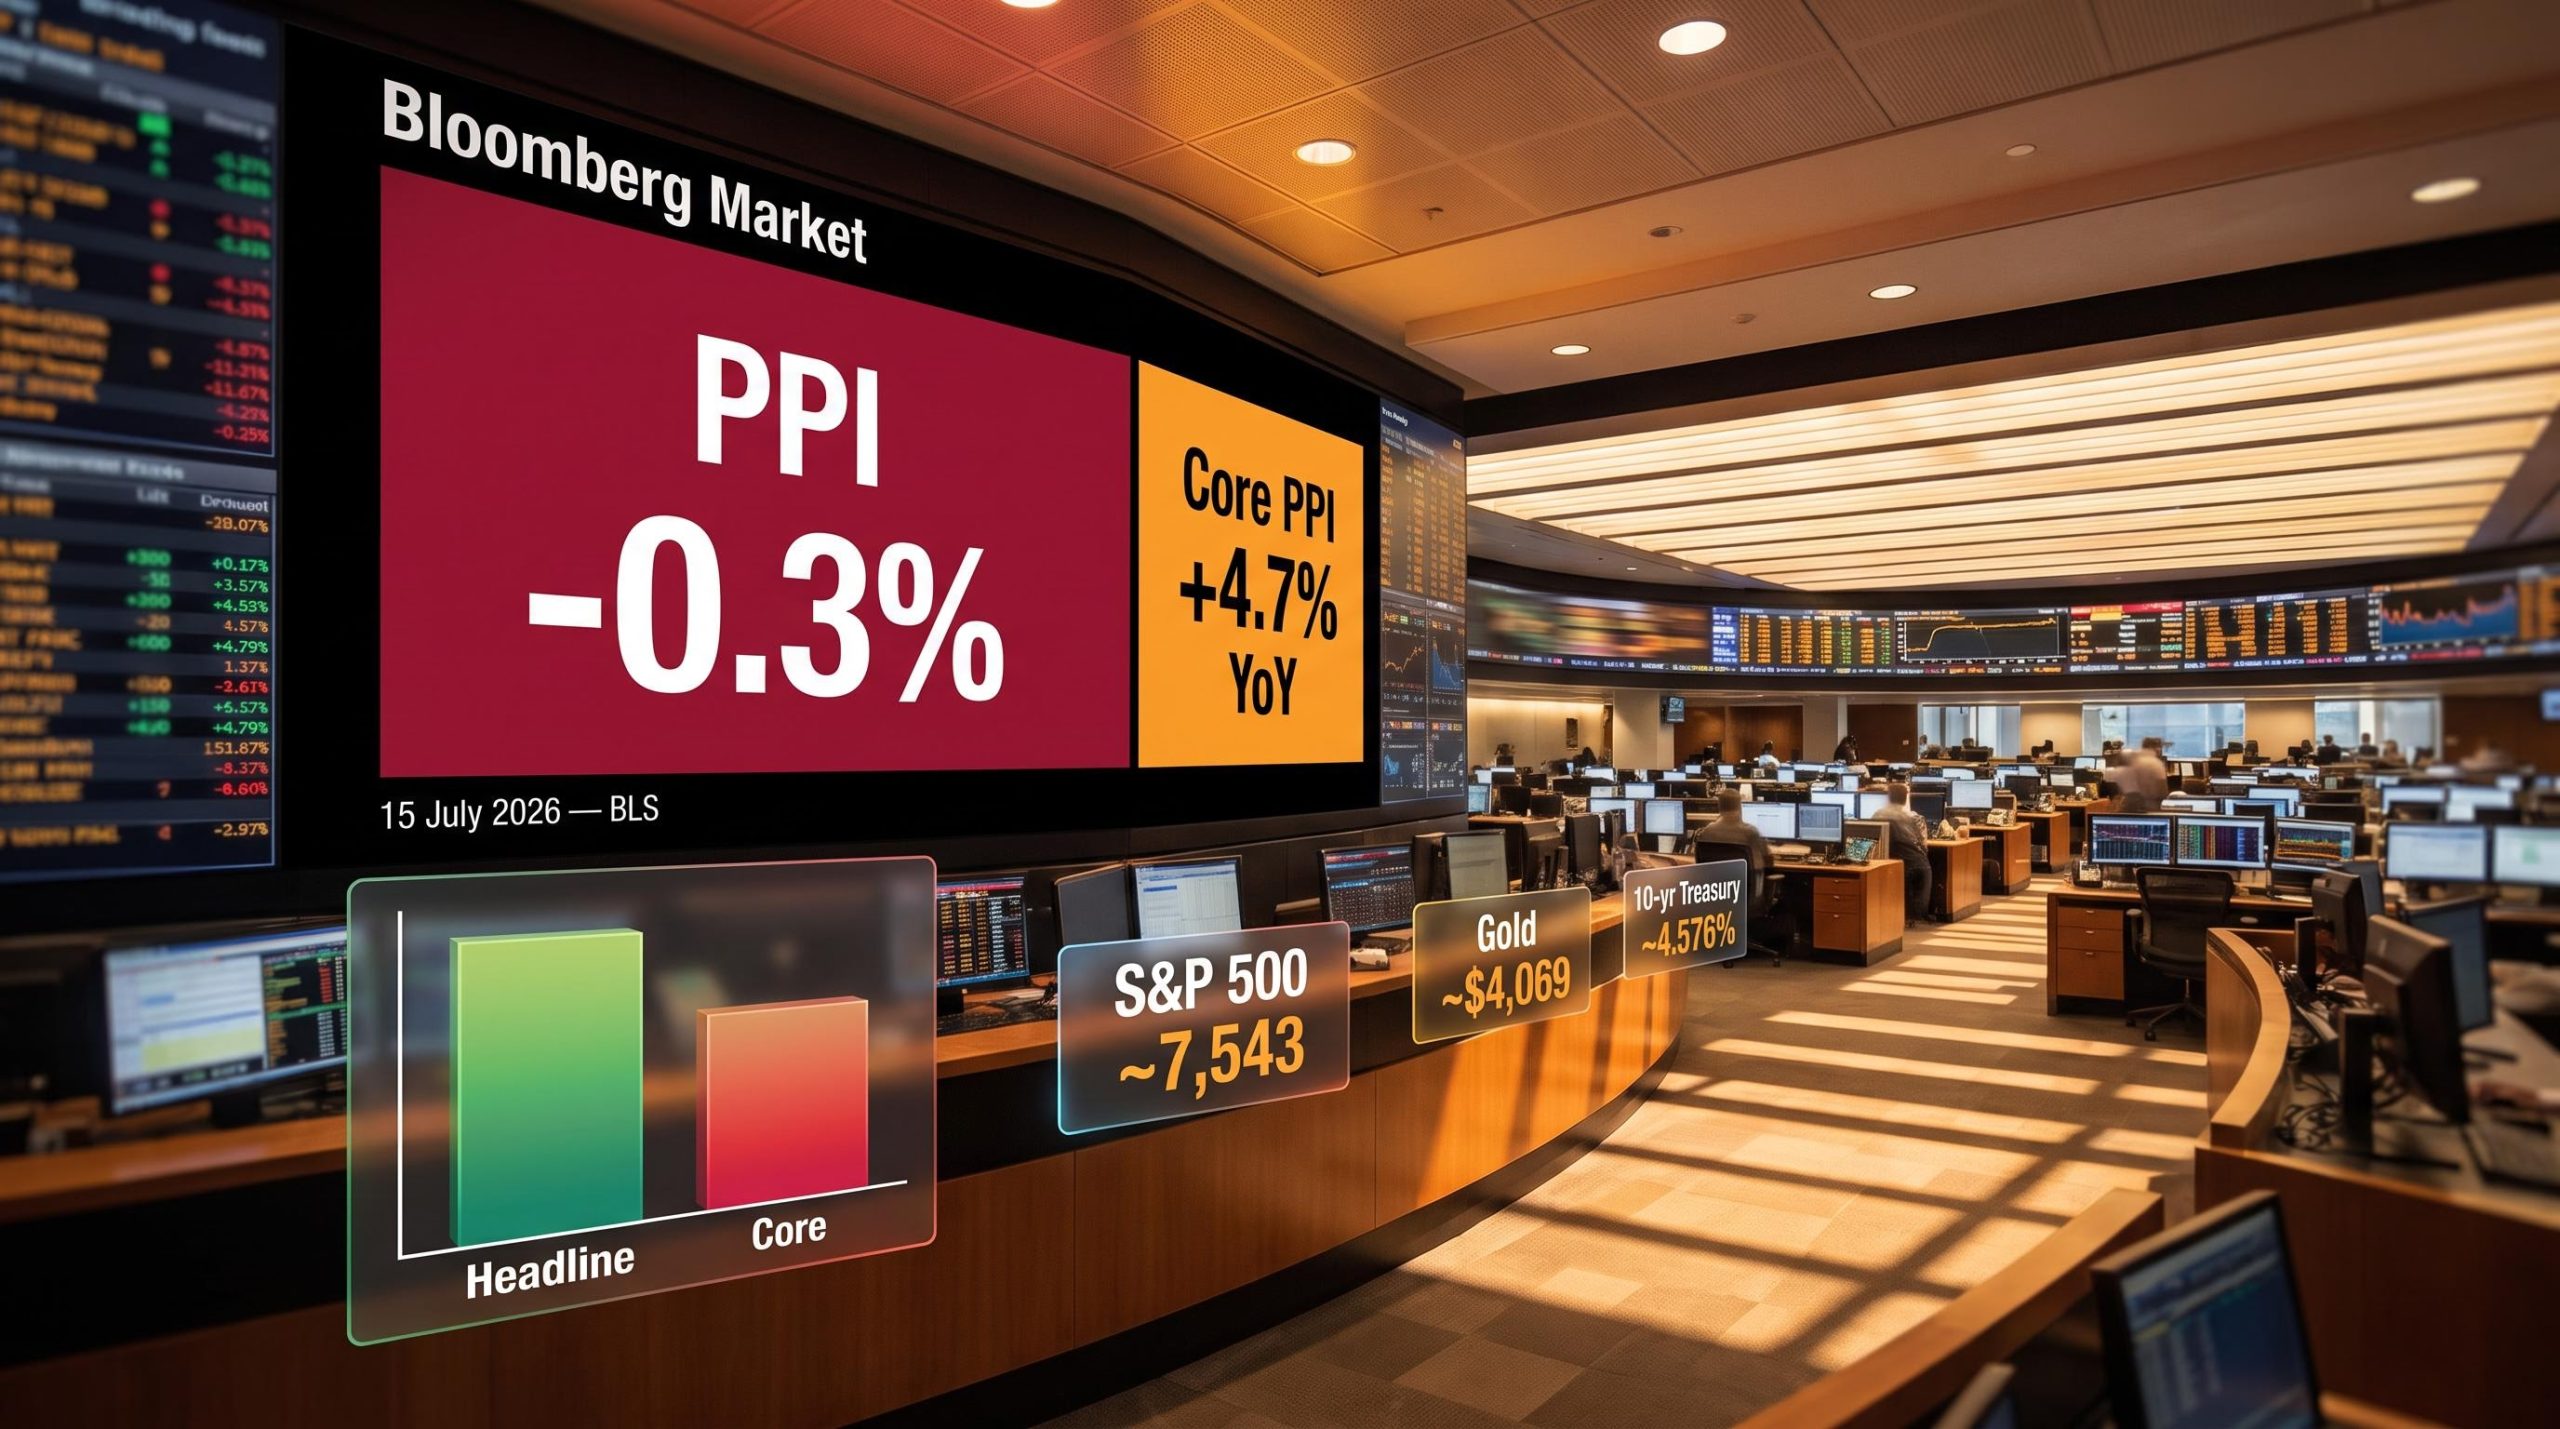
The June BLS data confirmed a 0.3% monthly drop in U.S. wholesale prices, the steepest decline recorded so far this year. The figures were published on 15 July 2026, arriving just twenty-four hours after separate data showed consumer prices had also retreated. Either print alone would have been notable. Together, they form the strongest signal yet that the inflationary surge of early 2026 is losing momentum at both ends of the pricing chain.
The context matters. Earlier this year, wholesale inflation was running at some of the hottest levels in recent memory. The June Producer Price Index (PPI) report from the Bureau of Labor Statistics (BLS) marks a genuine directional turn, though the BLS itself noted the underlying data is still being finalised and figures may be subject to revision in the coming weeks.
The April PPI surge of 1.4% month-over-month and 6.0% year-over-year, which collapsed rate cut probabilities from 42% to 4% in a single session, provides the baseline from which June’s 0.3% monthly decline is measured, illustrating just how sharp the directional reversal in wholesale prices has been over two reporting cycles.
Here is what the latest PPI data actually tells you, and what it does not. This piece breaks down the numbers, explains the gap between headline and core readings, walks through the Federal Reserve implications, and covers what the data means for equities, bonds, and precious metals in your portfolio.
What the June 2026 PPI report actually showed
The headline number is unambiguous in direction. The BLS data showed that the headline producer price index dropped 0.3% month-over-month in June 2026, representing a decisive turn away from the inflationary pressure that had built throughout the first half of the year. For anyone scanning for a single signal that the pipeline has shifted, that is it.
But then the second number arrives. Core PPI, which strips out volatile food and energy components, came in at +0.2% month-over-month, advancing even as the broader headline declined.
The year-over-year figures add a layer that neither monthly number captures on its own:
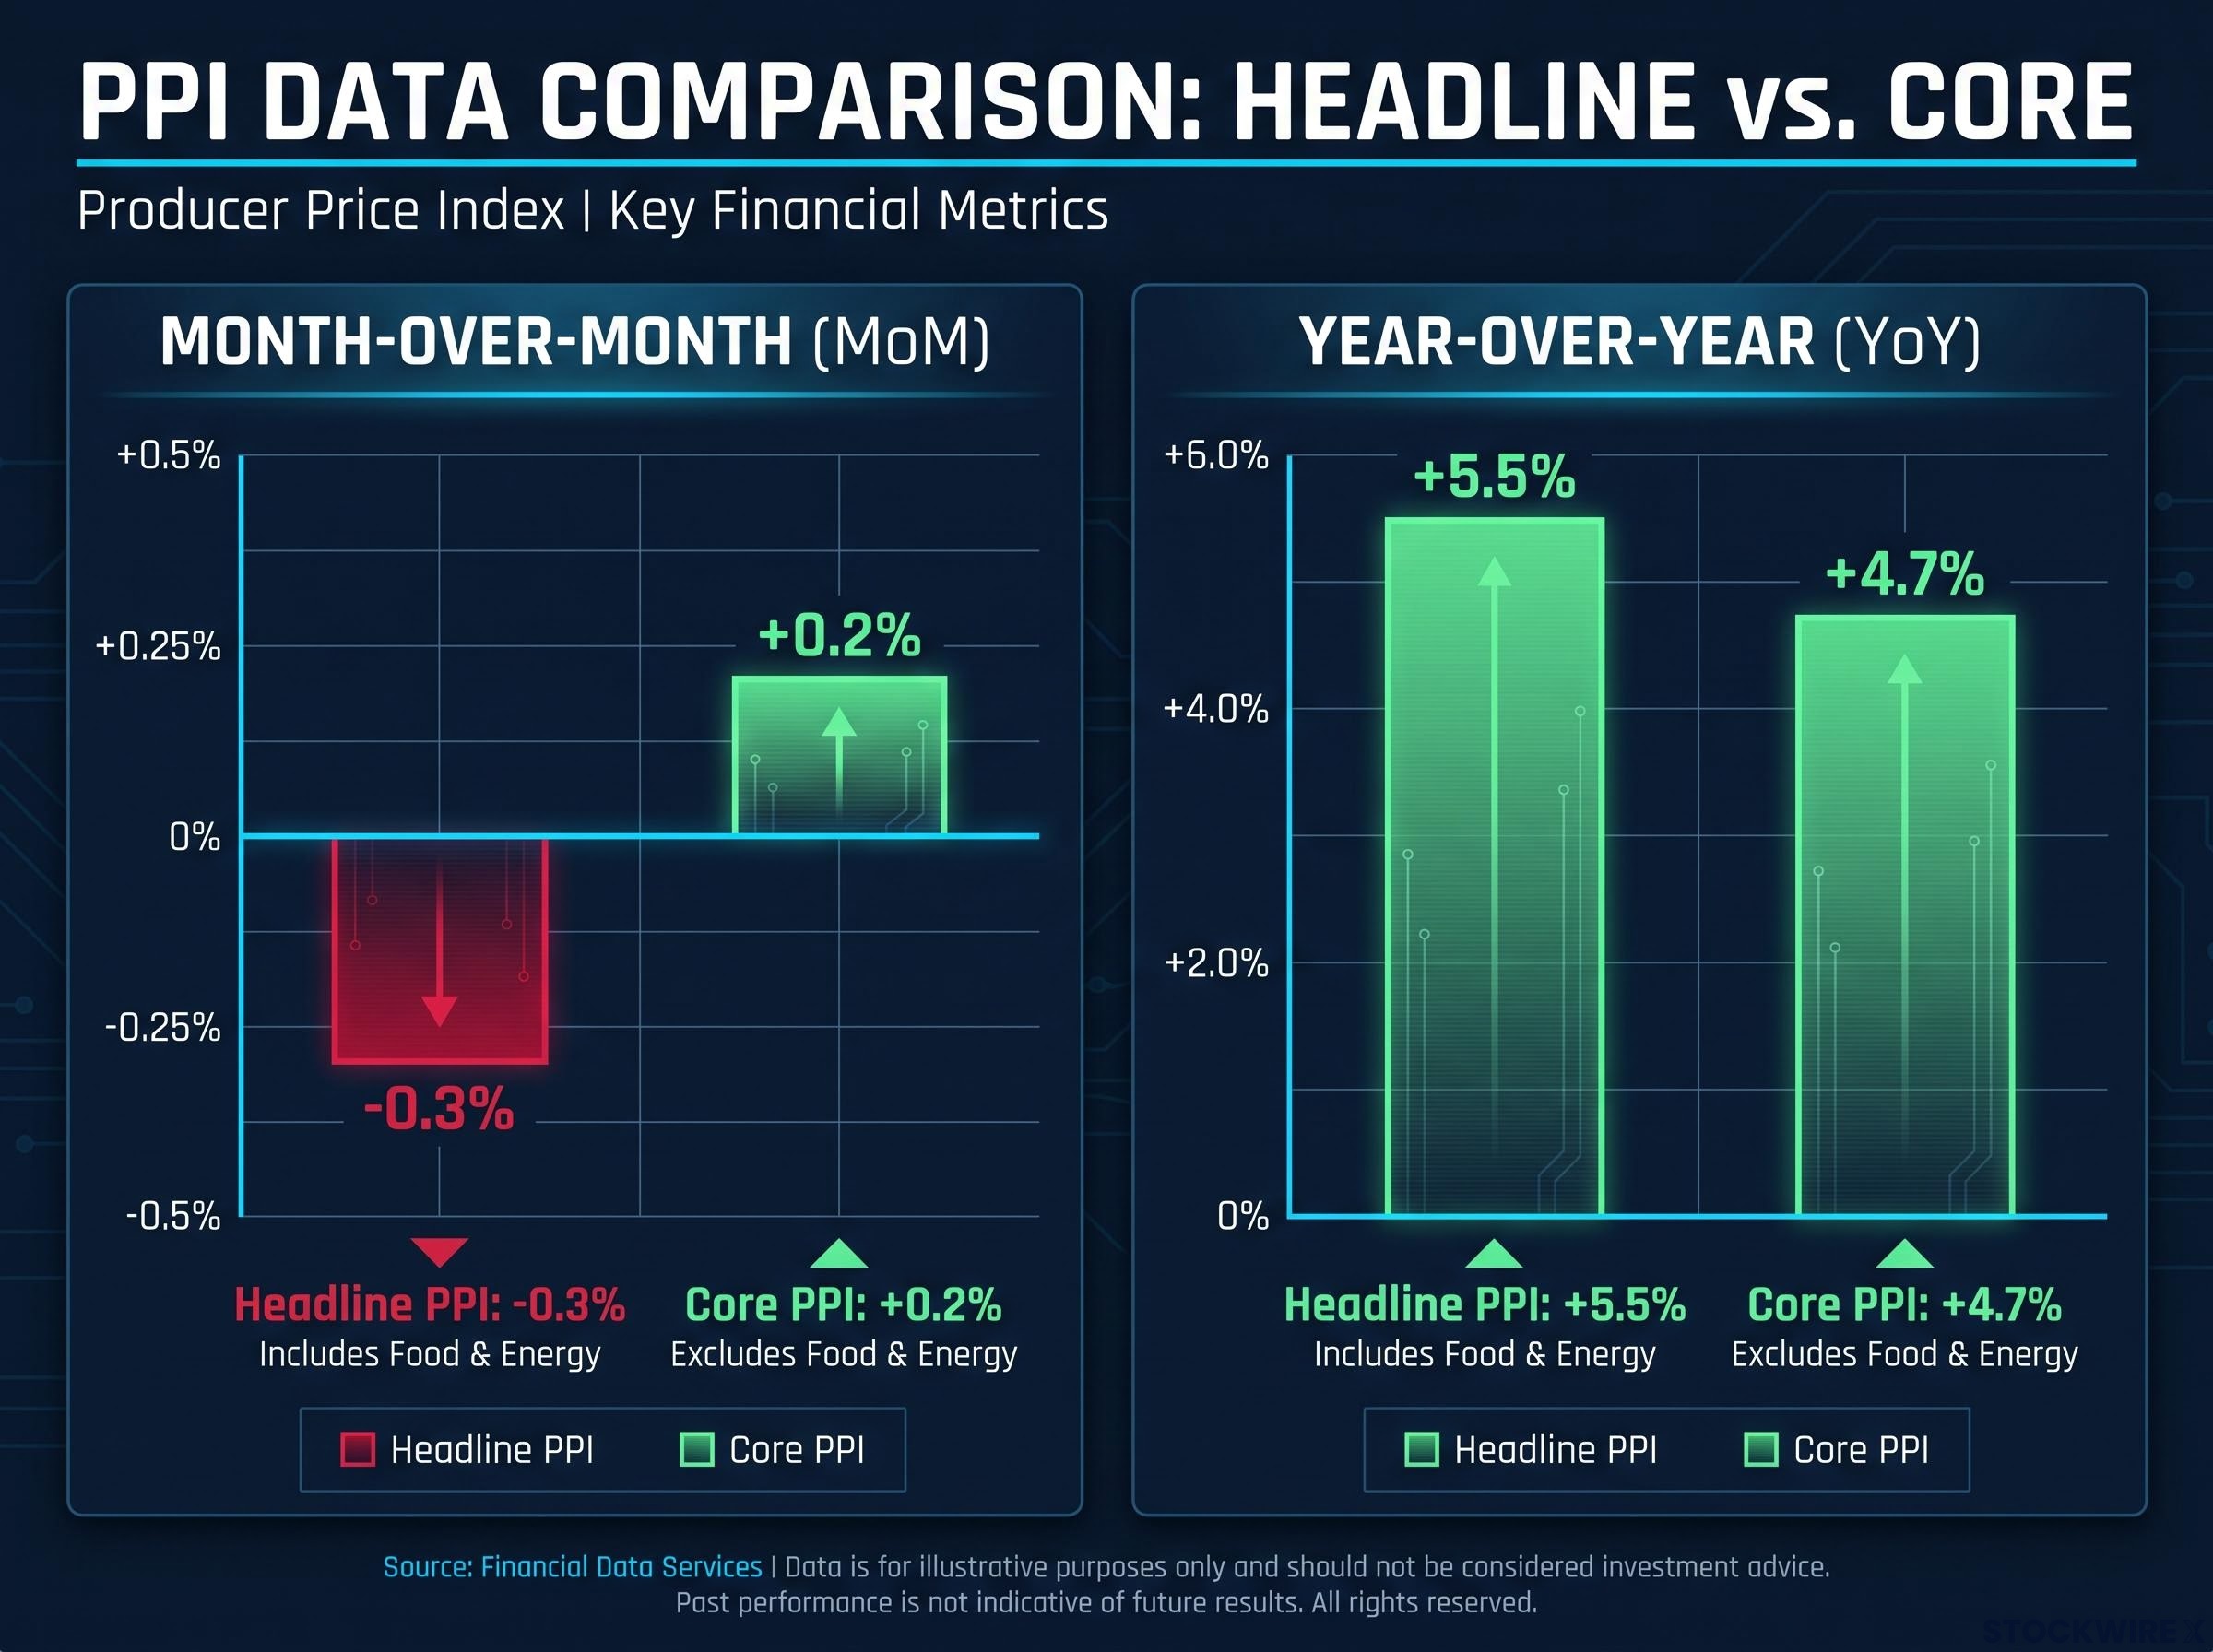
- Headline PPI: down 0.3% month-over-month
- Core PPI: up 0.2% month-over-month
- Headline PPI year-over-year: up 5.5%
- Core PPI year-over-year: up 4.7%
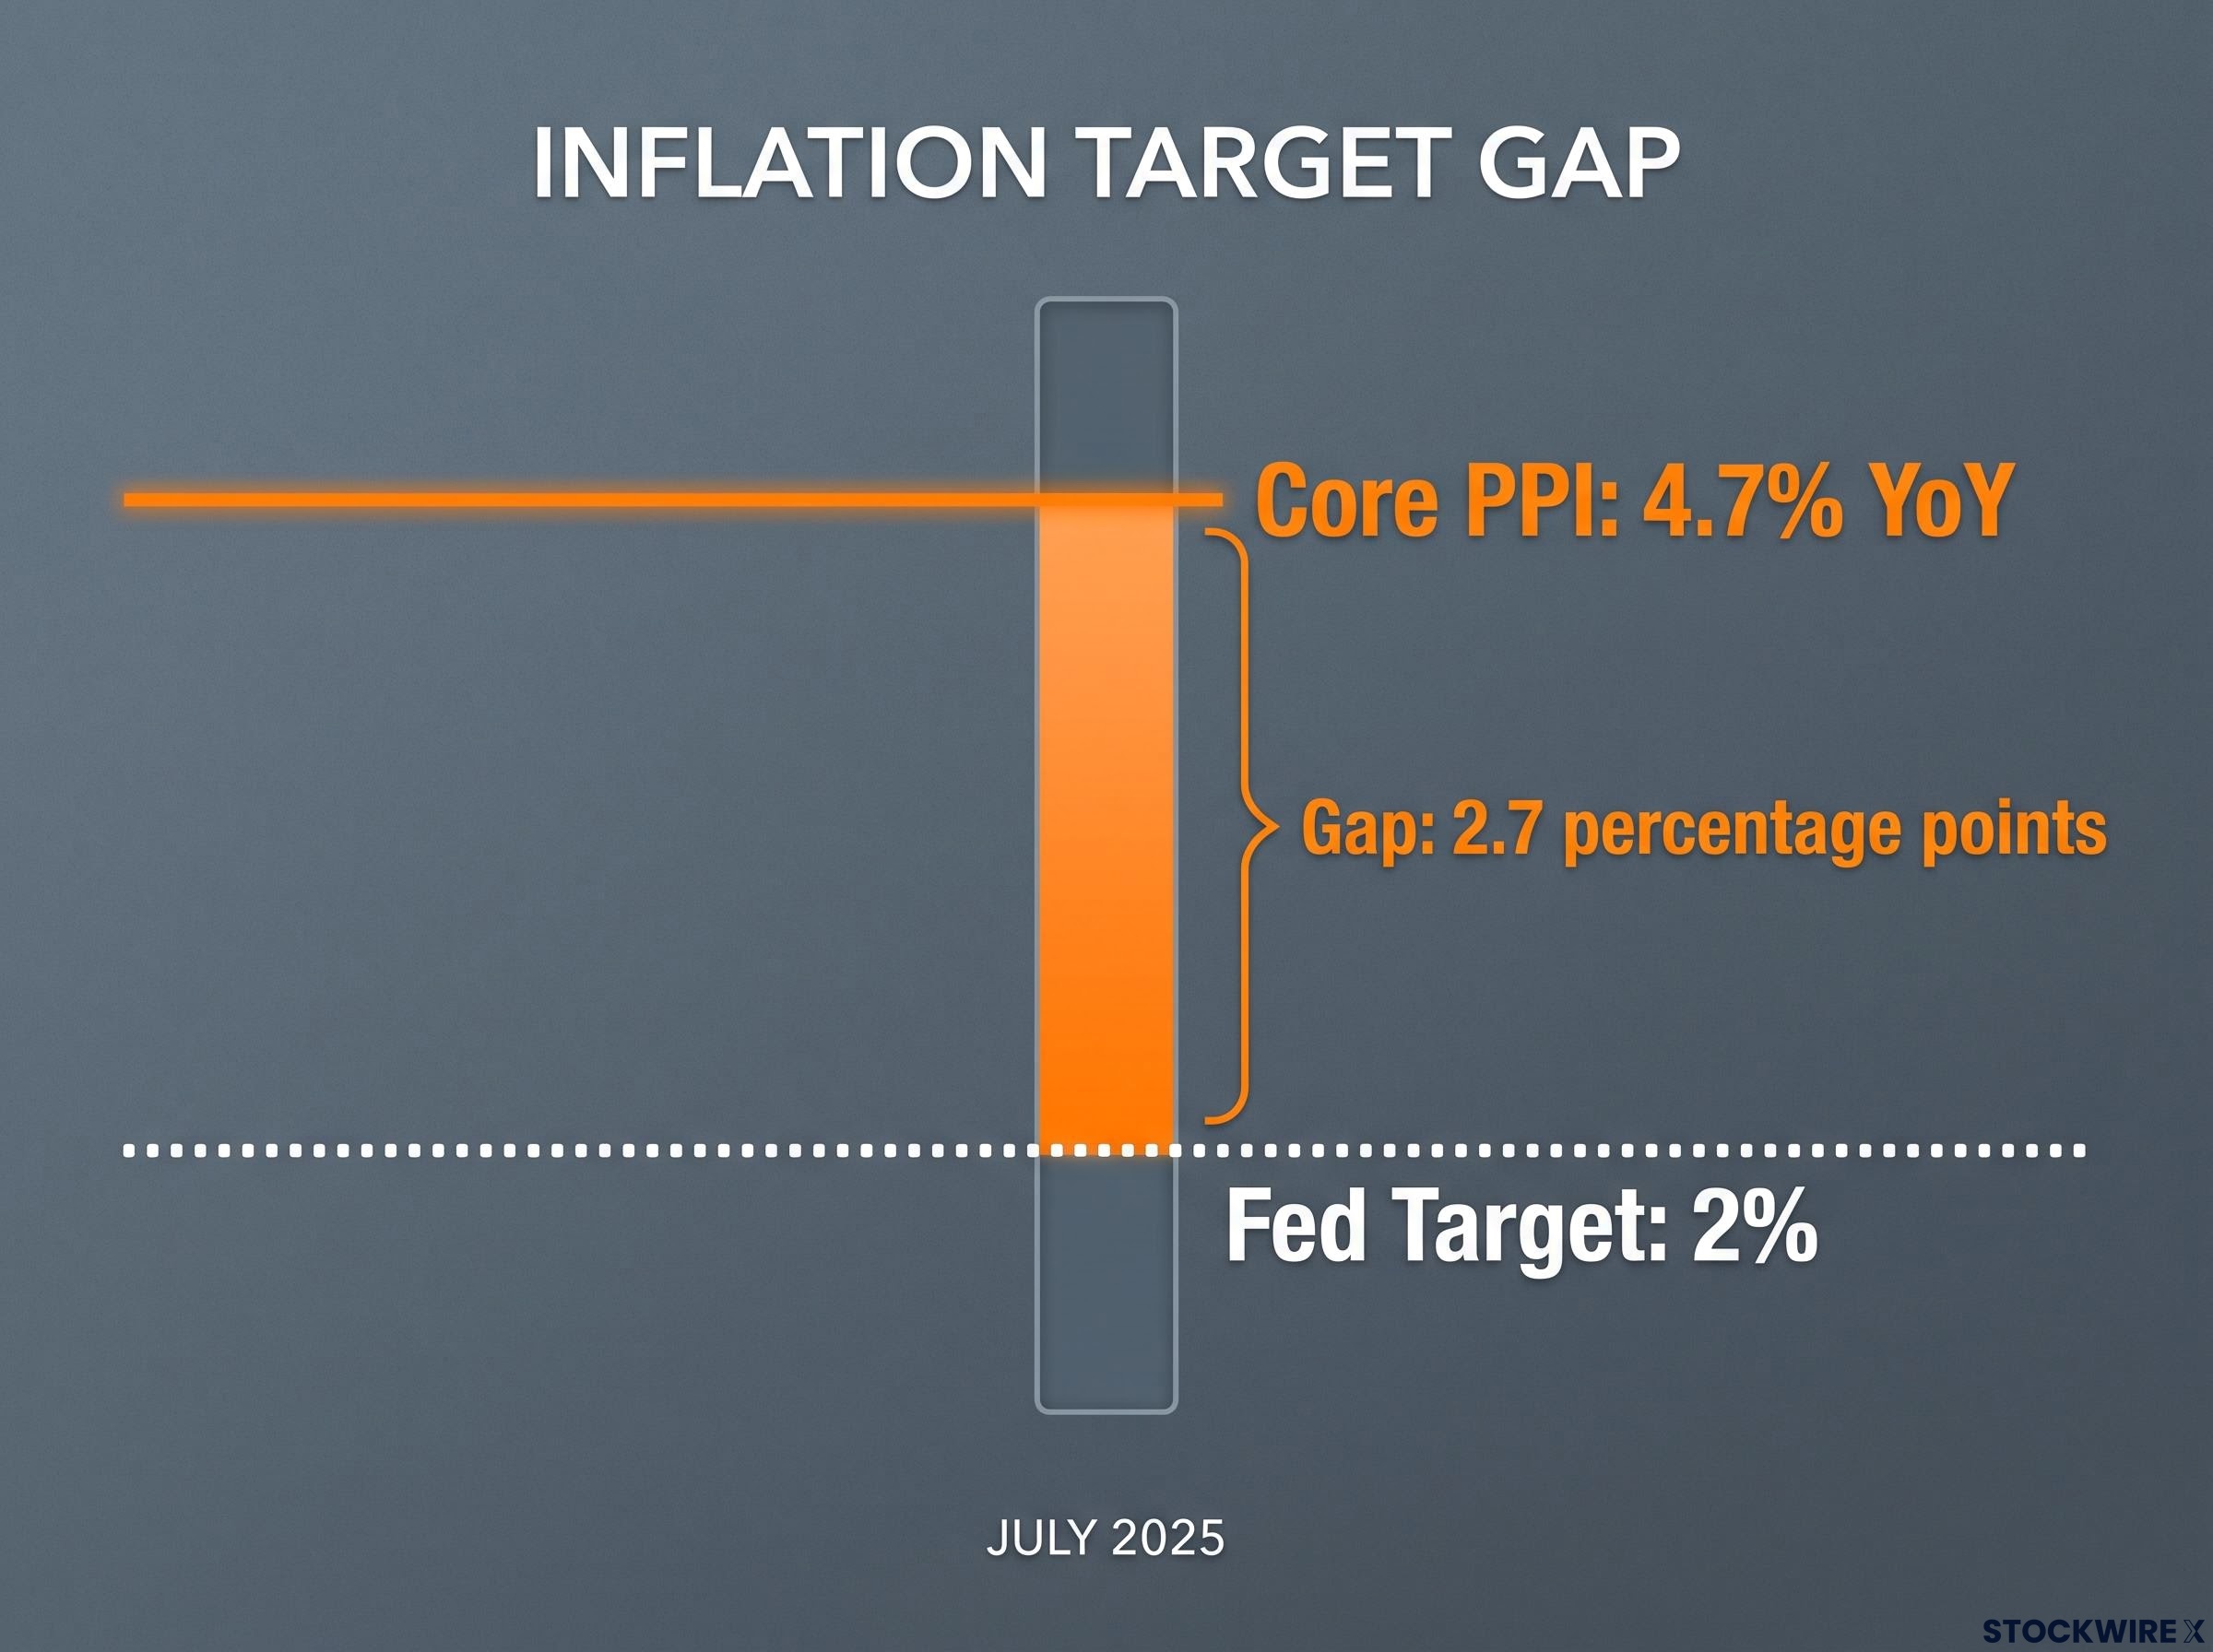
Core PPI at 4.7% year-over-year remains more than double the Federal Reserve’s 2% inflation target, a reminder that the distance still to travel is far greater than the ground covered in a single month.
A falling headline alongside a still-rising core is not a simple “inflation is over” signal. The monthly direction has shifted. The structural problem has not.
When big ASX news breaks, our subscribers know first
Why PPI matters and where it sits in the inflation pipeline
The Producer Price Index measures the prices that producers receive for their output, covering goods, services, and construction at the wholesale level. It sits upstream from the Consumer Price Index (CPI), which measures the prices consumers actually pay at the register. When PPI moves, it tells you what is happening to costs before those costs reach you.
How PPI connects to CPI and consumer prices
The transmission works with a lag. When wholesale prices rise, producers absorb the increase temporarily, then pass it through to retailers, who eventually raise shelf prices. That sequence typically plays out over weeks to months, which is why a softer PPI reading today can foreshadow softer CPI readings in future reports.
What makes June’s data particularly telling is that both measures softened at the same time. Headline CPI fell 0.4% month-over-month, with the annual rate easing to approximately 3.5%, according to market-reported data. When PPI and CPI cool in the same reporting cycle, it confirms that disinflation is operating at multiple levels of the pricing chain simultaneously, not isolated to one part.
The June CPI report, published a day before the PPI figures, showed headline consumer prices falling 0.4% month-over-month and core CPI printing at 0.0%, the largest downside miss relative to consensus in over a year, providing the companion data point that transforms a single PPI print into a cross-confirmed disinflation signal.
That is not coincidence. That is confirmation.
Headline down, core still firm: the split signal that defines this report
The reason headline PPI fell while core PPI rose comes down to what each measure includes. Headline PPI captures everything, and energy prices did the heavy lifting in June, declining enough to drag the overall figure negative. Energy is volatile by nature. It can reverse in a single month on supply disruptions, geopolitical shifts, or seasonal demand changes.
Core PPI excludes those swings deliberately. What it captures instead, wages, services costs, and rents, moves slowly and stubbornly. A 0.2% monthly increase in core PPI tells you the structural components of inflation are still grinding higher, even as the volatile surface layer cools.
| Measure | Monthly change | Year-over-year | Primary driver |
|---|---|---|---|
| Headline PPI | -0.3% | +5.5% | Energy price declines |
| Core PPI | +0.2% | +4.7% | Wages, services, rents |
The divergence is a caution signal. The worst of the inflationary shock may be receding, but core inflation at 4.7% year-over-year tells a structurally different story than the monthly headline. One month of falling headline PPI does not end the inflation fight when the components that matter most to the Fed are still climbing.
What the PPI data means for Federal Reserve policy
Softer headline PPI and CPI together meaningfully reduce the probability of additional near-term rate hikes. The data shows inflation is no longer accelerating, and that shifts the risk calculus the Fed faces at its next meeting.
The case for rapid rate cuts, however, is a different question entirely. Core PPI at 4.7% year-over-year and firm core CPI readings mean the Fed remains far from declaring the inflation problem resolved. The 2% target is not a suggestion; it is the benchmark against which every policy decision is calibrated.
With core inflation running at 4.7% year-over-year, the Fed sits approximately 2.7 percentage points above its 2% target, the primary constraint on any near-term pivot to rate cuts.
Market pricing reflected high probabilities of a rate hold following the June CPI release, and the PPI print reinforces that read. The bar for further hikes has risen substantially. But the bar for cuts has not yet been cleared.
The Fed committee split heading into the July meeting, with nine members favouring a hold and nine open to further hikes, means the June PPI print lands in an institution already divided on its next move, where a single data release can shift the internal balance of an active policy argument rather than merely confirm an established consensus.
The distinction matters for how you position around rates. “Inflation cooling” and “Fed pivoting to cuts” are two different conditions. The June data supports the first. It does not yet justify the second.
How equities, bonds, and precious metals are responding
The same inflation data lands differently depending on which market you are watching. Each asset class is pricing its own version of the same underlying question: how far has this disinflation actually gone?
Equities
The disinflation narrative is modestly constructive for equities, particularly rate-sensitive and cyclical names that benefit most when tightening risk fades. Lower wholesale prices support margins and reduce the probability of further monetary restriction.
But the starting point matters. The S&P 500 sat near 7,543 on 15 July 2026, with the Nasdaq near 26,107 and the Dow near 52,508. At those levels, a significant amount of positive news is already reflected in prices. For the PPI data to drive sharp upside, it would need to be part of a string of prints, not a standalone release.
Treasury bonds and yields
Long-term yields remain elevated, with the 10-year Treasury at approximately 4.576% and the 30-year at approximately 5.106%. A sustained disinflation trend could push yields gradually lower, but two forces keep a floor under rates. First, the level of inflation (not just its direction) remains well above target. Second, term premiums and fiscal dynamics provide structural support for higher yields independent of near-term inflation data.
Gradual duration extension makes sense if subsequent prints confirm the trend. The income on offer at current yields is real; the question is whether the disinflation path is durable enough to generate capital gains on top of it.
Gold and silver
Gold futures near $4,069 and silver near $58.78 are not speculative excess. They reflect rational hedging against unresolved structural inflation, policy uncertainty, and broader geopolitical risk. Precious metals at these levels tell you the market is pricing disinflation in progress, not a low-inflation equilibrium.
Until core inflation is durably near the Fed’s target, these hedges remain relevant as portfolio protection rather than momentum trades.
| Asset class | Current level | June PPI implication | Key constraint |
|---|---|---|---|
| S&P 500 | ~7,543 | Modestly constructive | Elevated valuations limit upside surprise |
| 10-year Treasury | ~4.576% | Gradual yield decline if trend confirmed | Term premiums and fiscal dynamics |
| Gold futures | ~$4,069 | Continued hedge demand | Unresolved core inflation and policy uncertainty |
Elevated equity indices, high precious metal prices, and still-elevated yields tell a coherent story together: markets are pricing disinflation in progress, not a problem that has been solved.
What to watch in the coming months before drawing conclusions
One month of softer data is a data point, not a trend. The variables that will either confirm or reverse the disinflation narrative are specific and trackable:
- Subsequent core PPI and CPI releases: Two or three consecutive prints showing core inflation cooling would represent a durable trend. A single month, however positive in direction, is not proof.
- Energy price trajectory: The June headline decline was energy-driven. Any reversal in energy markets would push the headline back up without indicating that structural inflation has worsened. Watch energy separately from core.
- BLS data revisions: The June PPI report was characterised as still developing. Revisions are possible and could alter the picture in either direction.
Core inflation at 4.7% year-over-year, approximately 2.7 percentage points above the Fed’s 2% target, is the baseline the Fed is watching. That gap will not close in a single release. Tracking core rather than headline in future reports will give you a more reliable read on where inflation and policy are actually headed.
A directional shift, not a resolved problem
The June PPI report changed the direction of the inflation story, not its conclusion. Headline wholesale prices fell, core remains sticky, and the combined PPI-plus-CPI picture confirms disinflation is operating at multiple levels of the pricing chain. That is genuine progress from where things stood earlier in 2026.
For the Fed, the data supports a hold and raises the bar for further hikes. It does not yet clear the bar for cuts. Core PPI at 4.7% year-over-year is the number that anchors that distinction.
The appropriate investor posture is selective and data-conditional: not broadly risk-on, not broadly defensive, and firmly focused on the next several inflation prints as the real test. “Cooling inflation” and “solved inflation” are categorically different conditions. The June data establishes the former without approaching the latter.
For investors wanting a structured approach to positioning across these conflicting signals, our dedicated guide to inflation investing strategy covers the barbell framework that balances defensive commodity hedges against AI and technology growth allocations, including specific tactical deployment guidelines for a higher-for-longer rate environment.
This article is for informational purposes only and should not be considered financial advice. Investors should conduct their own research and consult with financial professionals before making investment decisions. Past performance does not guarantee future results. Financial projections are subject to market conditions and various risk factors.