Two ASX-listed clean energy ETFs have reached 52-week highs within days of each other in mid-May 2026, with one posting an approximate return of approximately 78% over the past year. BetaShares Climate Change Innovation ETF (ERTH) and VanEck Global Clean Energy ETF (CLNE) have delivered returns that would have seemed implausible during the sector’s painful 2021-2022 drawdown. Their concurrent rallies are drawing renewed attention from Australian retail investors at a moment when thematic ETF inflows are climbing across the ASX. What follows is a breakdown of exactly what has happened to each fund’s price, why both are surging at the same time, how the two differ structurally, and what investors should weigh before treating either as a portfolio addition.
Thematic ETF inflows are climbing across the ASX against a backdrop of record market participation, with 411,000 Australians entering the ETF market for the first time in 2025 alone and funds under management reaching $330.6 billion by end-2025, a fivefold increase from 2020.
Two clean energy ETFs reach 52-week highs within days of each other
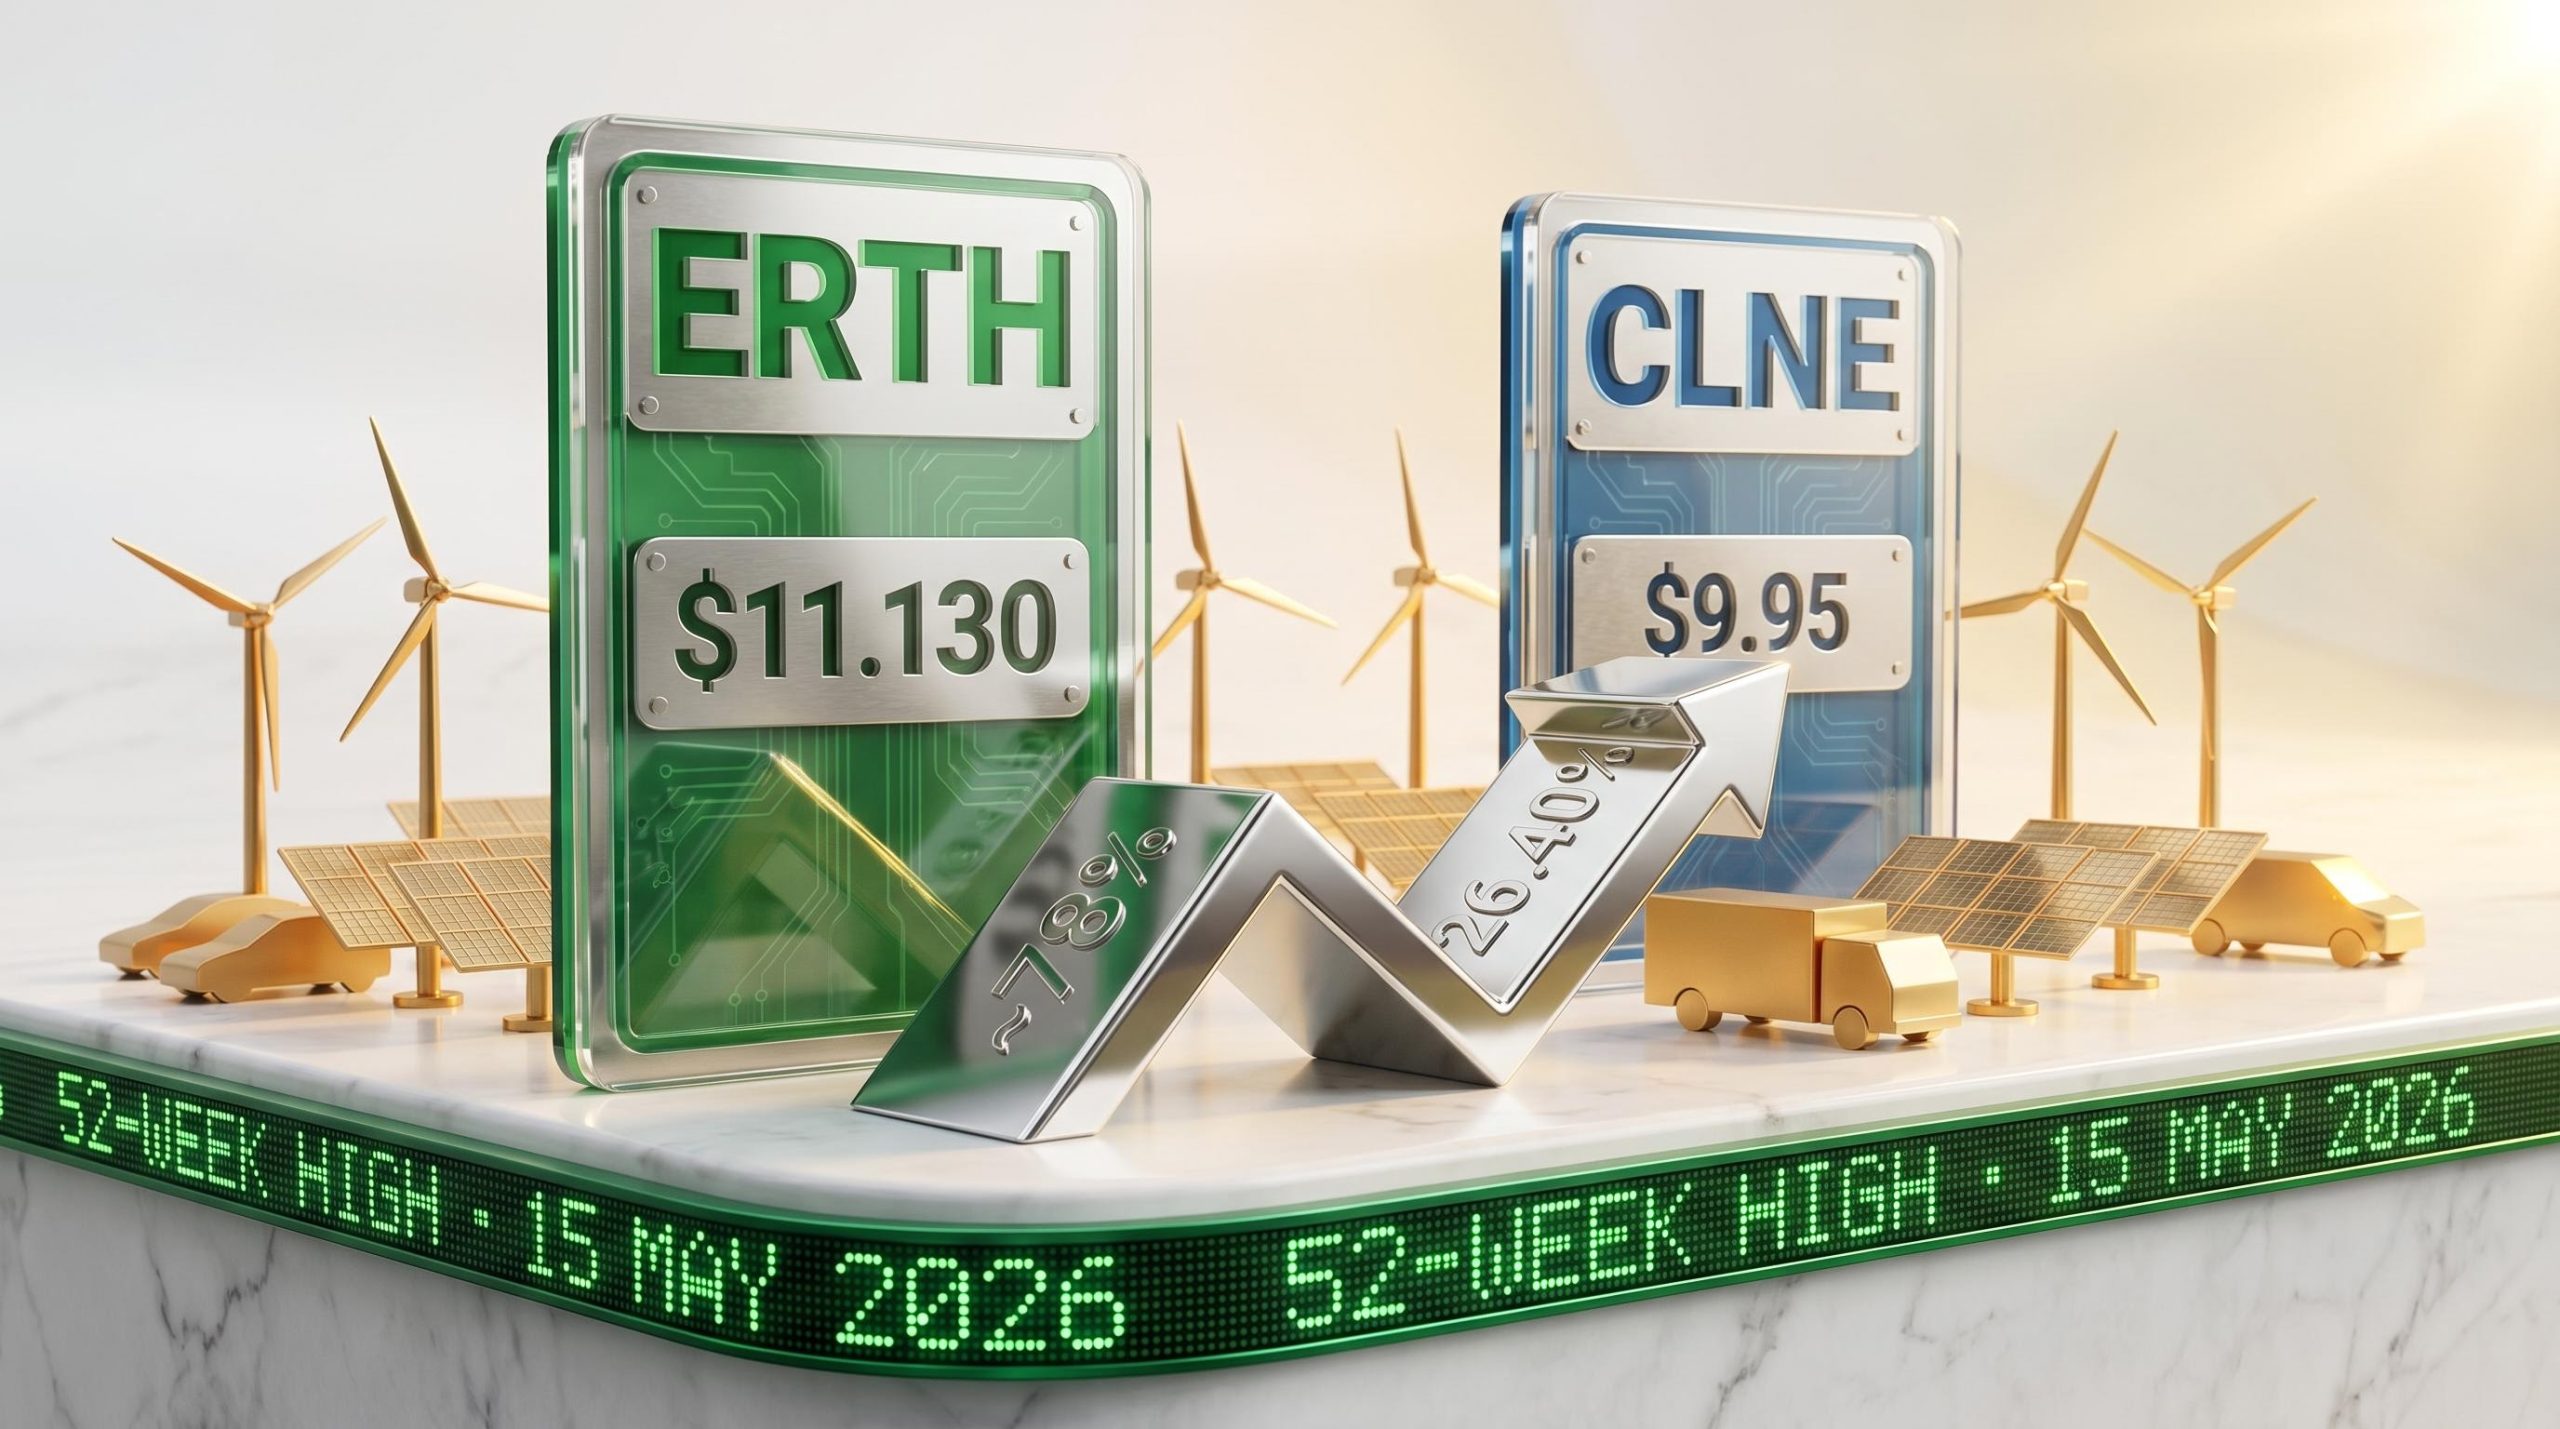
CLNE touched its 52-week high of $9.95 on 12 May 2026. Two days later, ERTH hit $11.130 on 14 May 2026. Both funds are now trading at or near the top of their 12-month ranges, and the timing is not a coincidence; it reflects shared sectoral momentum running through global clean energy equities.
The scale of the rallies, however, is far from equal. ERTH’s 12-month return stood at 26.40% as of 30 April 2026. CLNE’s approximate 12-month gain, based on its 52-week price range from a low of $5.59 to that $9.95 high, approaches approximately 78%.
CLNE’s approximate approximately 78% 12-month return makes it one of the strongest performing thematic ETFs on the ASX over the past year.
The key price milestones:
- ERTH 52-week high: $11.130 (14 May 2026)
- ERTH 52-week low: $9.02 (19 June 2025)
- CLNE 52-week high: $9.95 (12 May 2026)
- CLNE 52-week low: $5.59
Both funds were among five ASX ETFs reaching all-time or 52-week highs during the week of 15 May 2026, placing them within a broader thematic rally on the exchange. The gap between ERTH’s 26% and CLNE’s approximate approximately 78%, though, demands explanation, and the answer sits in how each fund is built.
When big ASX news breaks, our subscribers know first
ERTH and CLNE are not the same fund: how their mandates diverge
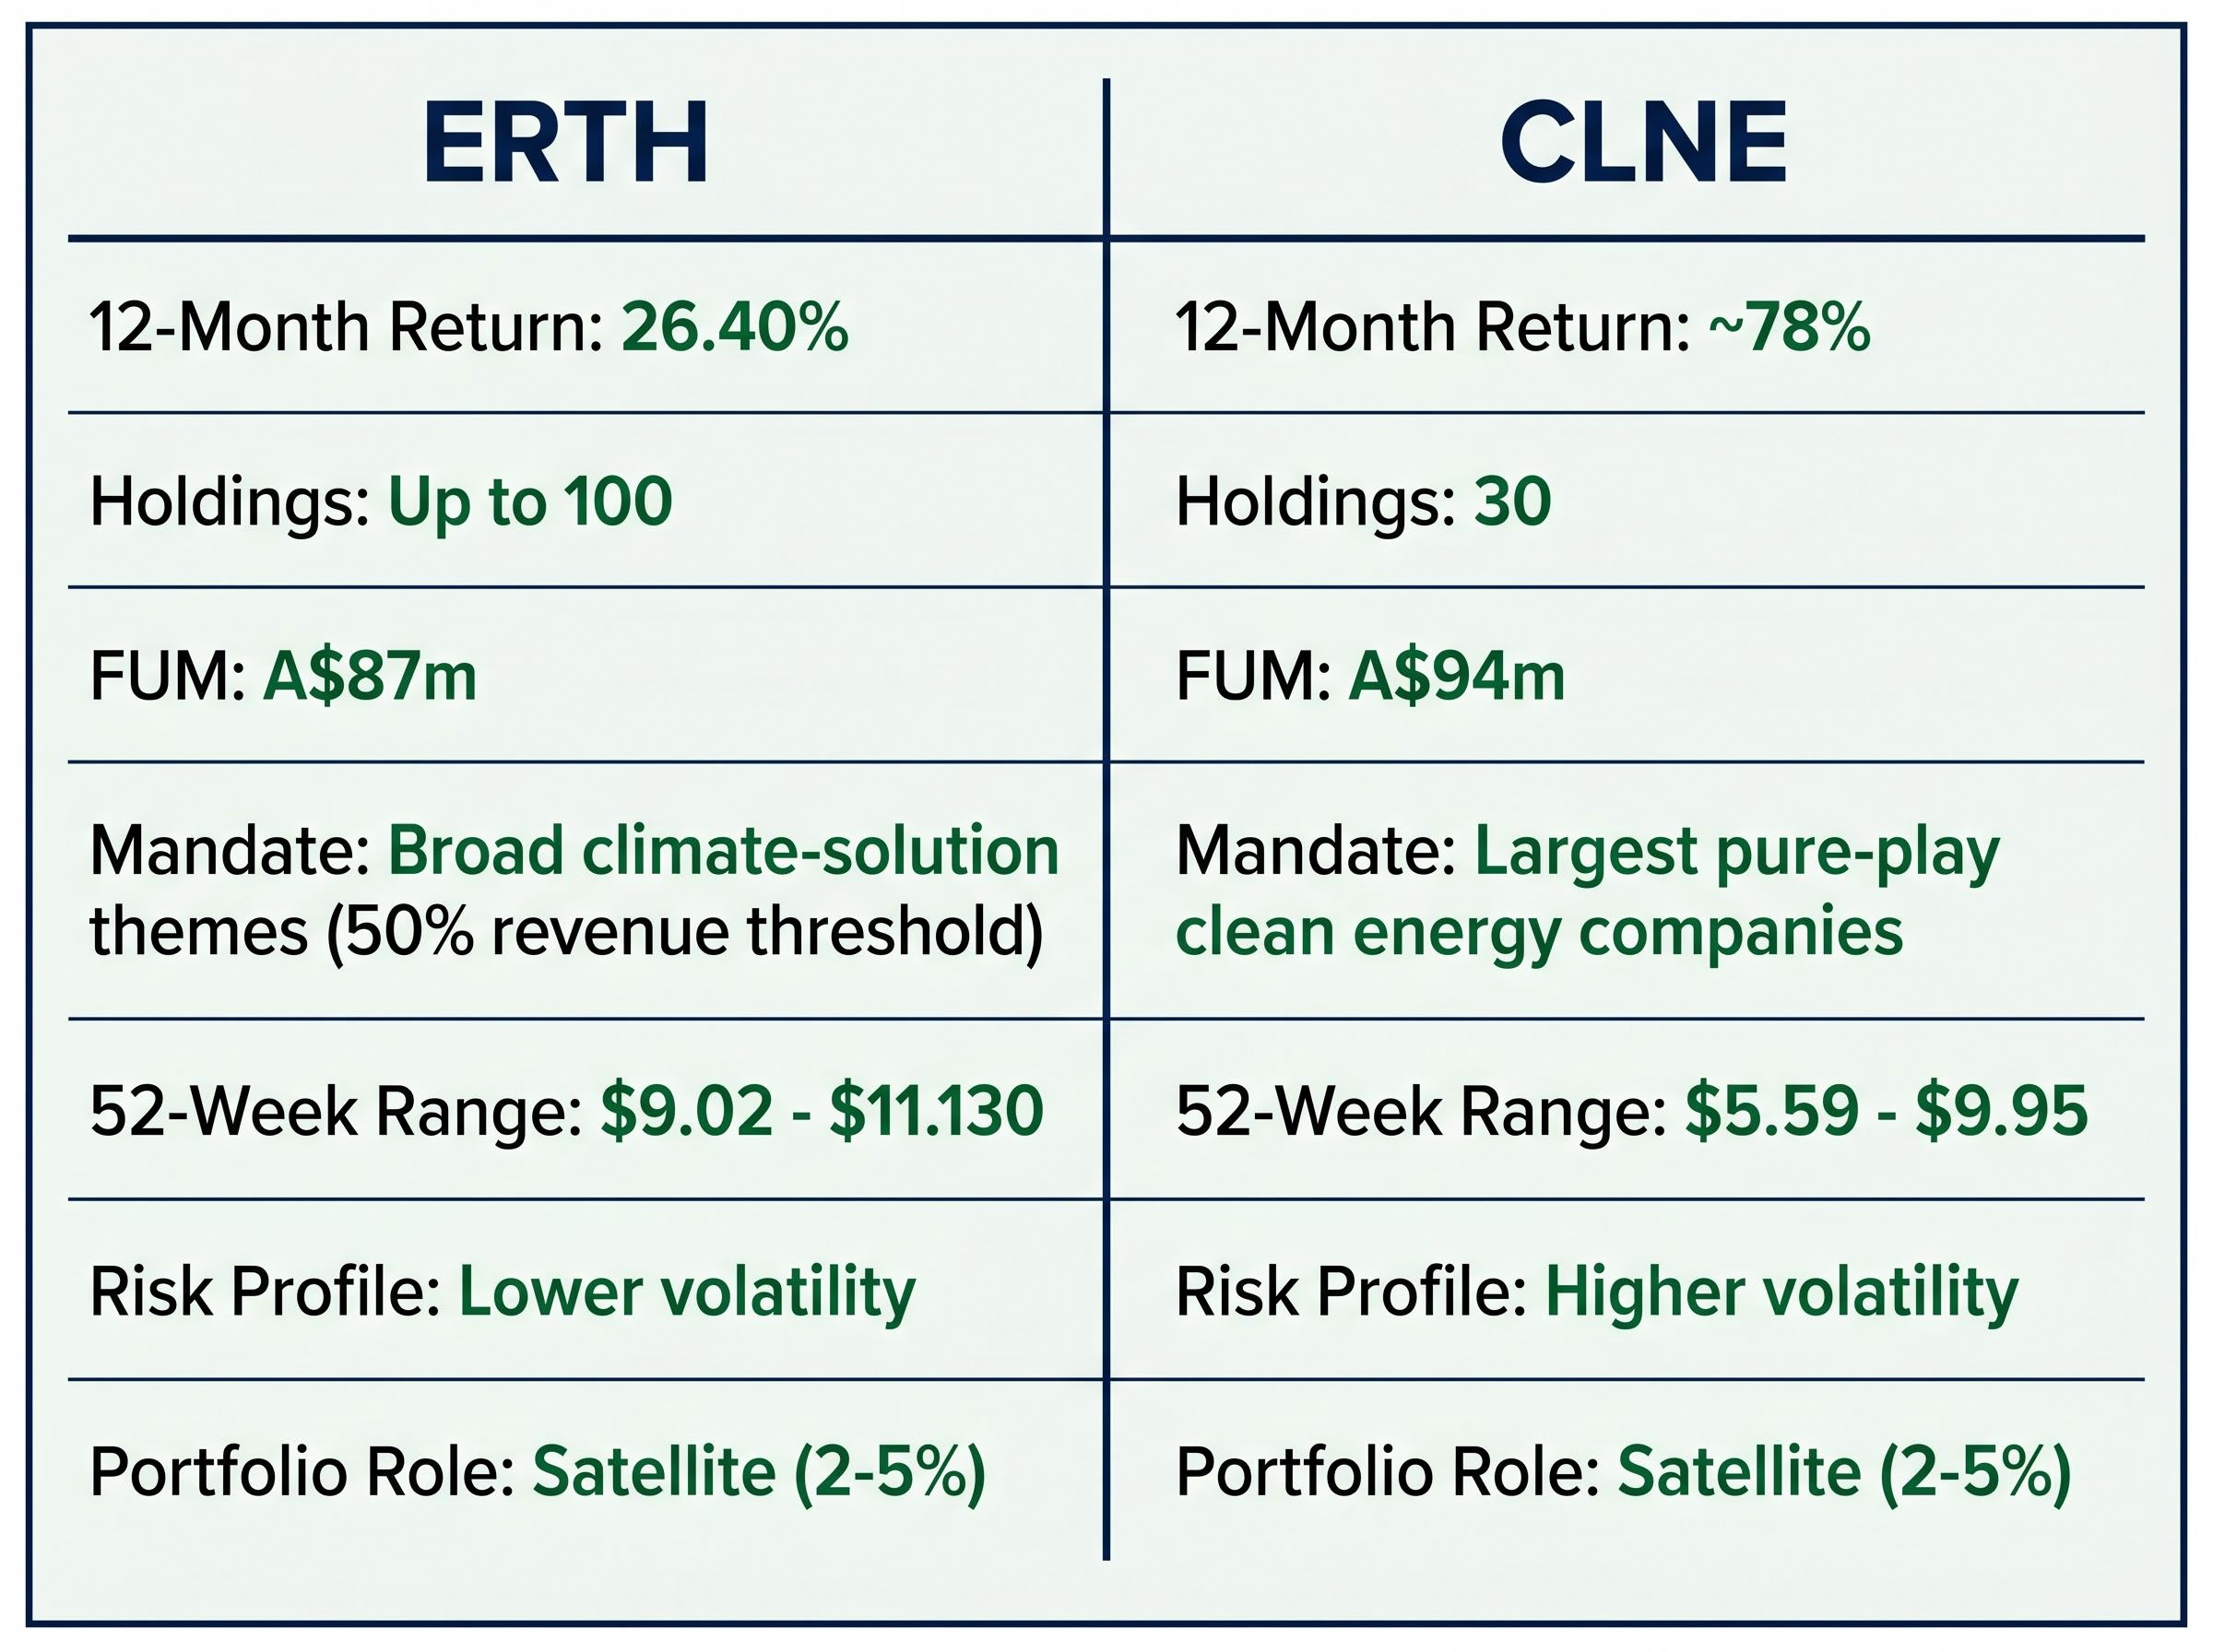
The performance gap between these two ETFs is a structural feature, not an anomaly. ERTH holds up to 100 global companies, each required to derive at least 50% of revenue from products or services addressing climate change. CLNE holds just 30 of the largest pure-play clean energy companies globally. That difference in concentration explains much of the return disparity, and the risk disparity that comes with it.
| Fund | Number of Holdings | Mandate Focus | Approximate FUM |
|---|---|---|---|
| ERTH | Up to 100 | Broad climate-solution themes (50% revenue threshold) | A$87m |
| CLNE | 30 | Largest pure-play clean energy companies | A$94m |
CLNE’s 30-stock concentration means it behaves as a higher-beta expression of the clean energy theme: more return upside in a rally, more downside exposure in a correction. ERTH’s broader mandate, spanning six thematic verticals, deliberately diversifies that risk. When the sector surges, CLNE captures more of the move. When it corrects, CLNE gives more back.
How ERTH spreads its climate bets
ERTH’s thematic sector breakdown as of 30 April 2026 shows how far beyond solar panels and wind turbines its mandate reaches:
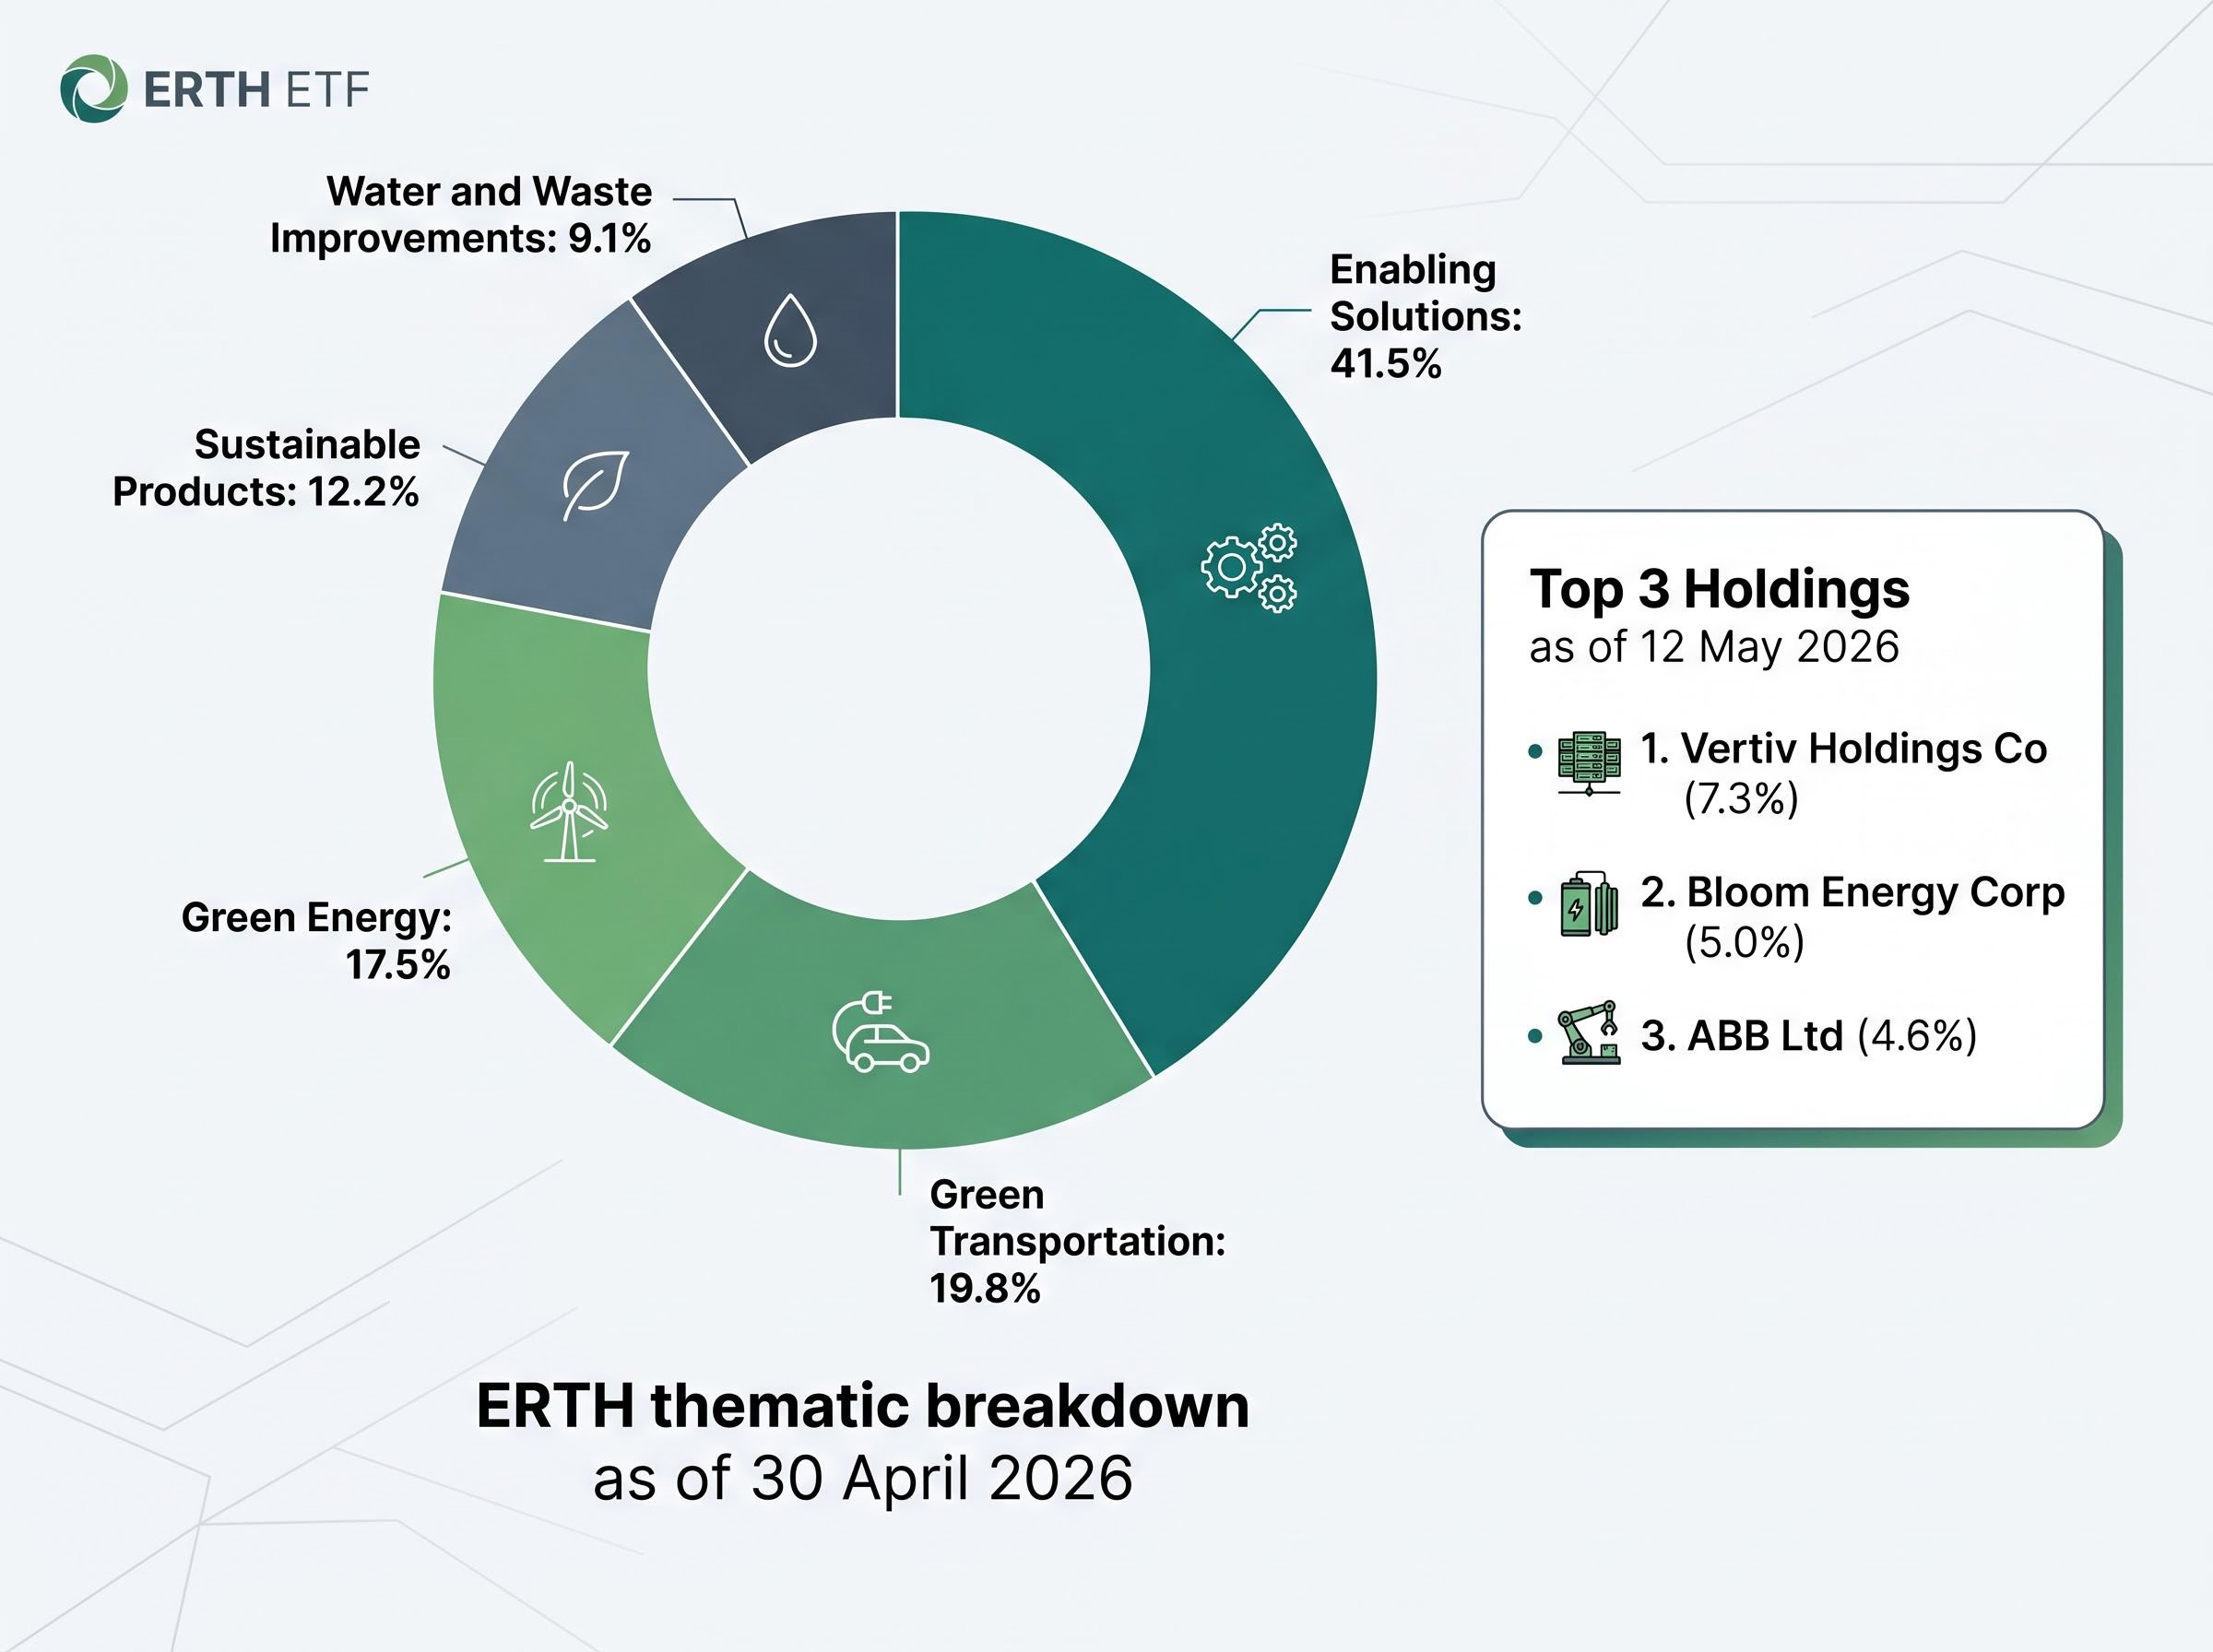
- Enabling Solutions: 41.5%
- Green Transportation: 19.8%
- Green Energy: 17.5%
- Sustainable Products: 12.2%
- Water and Waste Improvements: 9.1%
The largest category, Enabling Solutions, includes holdings such as Vertiv Holdings (7.3% of the fund) and ABB Ltd (4.6%), companies that supply data centre cooling and industrial automation rather than generating renewable electricity. This composition explains why ERTH tends to be less volatile than a concentrated renewables fund; its holdings are tied to the broader energy transition, not just one segment of it.
What clean energy actually means as an investment theme
The phrase “clean energy ETF” suggests a portfolio of solar farms and wind turbine manufacturers. The reality is broader, more industrial, and more sensitive to government policy than the label implies.
The investment universe these funds draw from includes electricity generators, equipment manufacturers, grid technology providers, electric vehicle companies, waste-to-value businesses, energy efficiency specialists, and storage solution developers. Thematic ETFs structured around this universe behave differently from broad-market index funds: they carry concentration in growth-oriented sectors, elevated sensitivity to interest rates, and higher correlation to policy developments than a diversified global equity holding.
ERTH’s top 10 holdings as of 12 May 2026 illustrate the point:
- Vertiv Holdings Co — 7.3%
- Bloom Energy Corp — 5.0%
- ABB Ltd — 4.6%
- Carrier Global Corp — 4.3%
- ASML Holding NV — 4.1%
- BYD Co Ltd — 3.6%
- Waste Management Inc — 3.5%
- Tesla Inc — 3.4%
- Synopsys Inc — 3.4%
- Ecolab Inc — 3.2%
ASML makes semiconductor lithography equipment. Waste Management runs landfills and recycling operations. Tesla straddles vehicles, energy storage, and software. These are not wind farm operators; they are companies whose revenues meet ERTH’s 50% climate-focused revenue threshold through products that enable, rather than directly generate, clean energy. CLNE, by contrast, focuses its 30 holdings squarely on the largest pure-play clean energy operators, utilities, and equipment makers.
ERTH’s since-inception return of -2.21% p.a. (from 9 March 2021) is a reminder that the sector’s recent rally follows a period of steep losses that still weigh on longer-term performance.
The policy and macro tailwinds driving the rally
This is not random momentum. A set of converging policy and macro forces has driven both funds higher, and understanding which tailwinds are structural helps investors assess how durable the rally may be.
Australian policy driving local sentiment
Australia’s Capacity Investment Scheme (CIS) expansion through 2024 and 2025 has provided developers with long-dated revenue certainty through firmed renewable capacity tenders, underpinning sentiment toward listed clean energy equipment and storage companies. The AEMO 2024 Integrated System Plan reinforced the structural case, projecting rapid renewable and transmission build-out requirements through to 2050.
Australia’s Capacity Investment Scheme targets 82% renewable electricity by 2030 across a 40 GW expansion, with a long-term revenue safety net designed to reduce financial risk for project developers and underpin the demand pipeline that benefits listed clean energy equipment and storage companies held by both ERTH and CLNE.
The Safeguard Mechanism reforms, effective 1 July 2023, have also contributed by tightening emission caps on large industrial facilities. The result has been growing corporate demand for renewable power purchase agreements and storage, improving long-term demand visibility for the types of companies held by both ERTH and CLNE.
Australia’s clean energy investment reached a record $12.7 billion in 2024 before a roughly 20% slump in 2025 driven by grid connection bottlenecks rather than deteriorating economics, a distinction that matters when evaluating whether domestic policy sentiment translates into the earnings of globally-held companies like those inside ERTH and CLNE.
Global policy and macro factors have reinforced the domestic picture:
- US Inflation Reduction Act (second wave, 2024-2026): Multi-year project announcements and earnings forecast upgrades for IRA-exposed holdings are now flowing through to ETF unit prices.
- EU Green Deal and REPowerEU: Continued European policy support provides a floor for renewable utilities and equipment makers held in both funds.
- Record renewable deployment: IEA and BloombergNEF data for 2024-2025 show global renewable capacity additions setting or approaching record highs.
- Re-rating after drawdown: After the 2021-2022 sell-off driven by rising rates and supply-chain stress, moderating rate expectations from late 2023 onward supported a recovery in growth-oriented clean energy names.
ERTH’s 3-year return of 3.78% p.a. as of 30 April 2026 captures both the difficult drawdown period and the subsequent recovery, illustrating the cyclicality investors should expect from this theme.
What Australian investors should weigh before acting on this rally
The returns are real. The question is whether investors arriving at this story now are positioned to benefit from what comes next, or whether they are buying at the point of maximum optimism.
| Fund | 12-Month Return | Risk Profile | Suggested Portfolio Role |
|---|---|---|---|
| ERTH | 26.40% | Lower volatility (diversified climate themes) | Satellite (2-5% of portfolio) |
| CLNE | ~approximately 78% | Higher volatility (concentrated pure-play) | Satellite (2-5% of portfolio) |
Adviser consensus and Morningstar commentary position both funds as satellite holdings, typically 2-5% of a total portfolio, rather than core allocations. The reasoning is straightforward: sector concentration, interest rate sensitivity, and policy dependency make these inappropriate as foundation positions.
Mid-rally entry after a approximately 78% or 26% run means buying at or near 52-week highs, not at the point of maximum pessimism. Online brokerage data from platforms including Stake, SelfWealth, and CommSec show clean energy ETFs are back on most-traded and most-watched thematic lists, which may signal sentiment crowding.
The behaviour gap in thematic funds is well-documented: Morningstar’s 2025 research estimates thematic investors systematically underperform reported fund returns by 2-3% annually due to poorly timed inflows near peak valuations, a pattern illustrated by the ARK Innovation ETF reporting a time-weighted return of plus 233% while the typical investor experienced approximately negative 35%.
Before acting, investors should verify:
- Management fees and total expense ratios (available in BetaShares and VanEck product disclosure statements)
- Exact top holdings for CLNE (available via VanEck’s monthly factsheet)
- Currency exposure and hedging status (both funds hold global equities, creating unhedged foreign currency exposure)
- Position sizing relative to existing sector and thematic exposures in the broader portfolio
A strong run that invites caution as much as attention
ERTH’s 26.40% and CLNE’s approximate approximately 78% 12-month returns reflect genuine structural momentum in clean energy investment globally. Both funds were among five ASX ETFs to reach 52-week or all-time highs during the week of 15 May 2026, confirming the breadth of the thematic rally.
The distinction between the two funds remains the most actionable takeaway. ERTH offers diversified exposure across climate innovation verticals with lower volatility. CLNE delivers concentrated pure-play clean energy exposure with the sharper moves in both directions that come with a 30-stock portfolio.
Whether this rally extends depends on policy continuity, particularly the IRA and Australia’s Capacity Investment Scheme, interest rate trajectories, and whether current prices already incorporate the optimistic scenarios. ERTH’s since-inception return of -2.21% p.a. serves as a reminder that this sector rewards patience and position sizing over performance-chasing. The returns are headline-worthy. The decision to invest should not be.
This article is for informational purposes only and should not be considered financial advice. Investors should conduct their own research and consult with financial professionals before making investment decisions. Past performance does not guarantee future results.