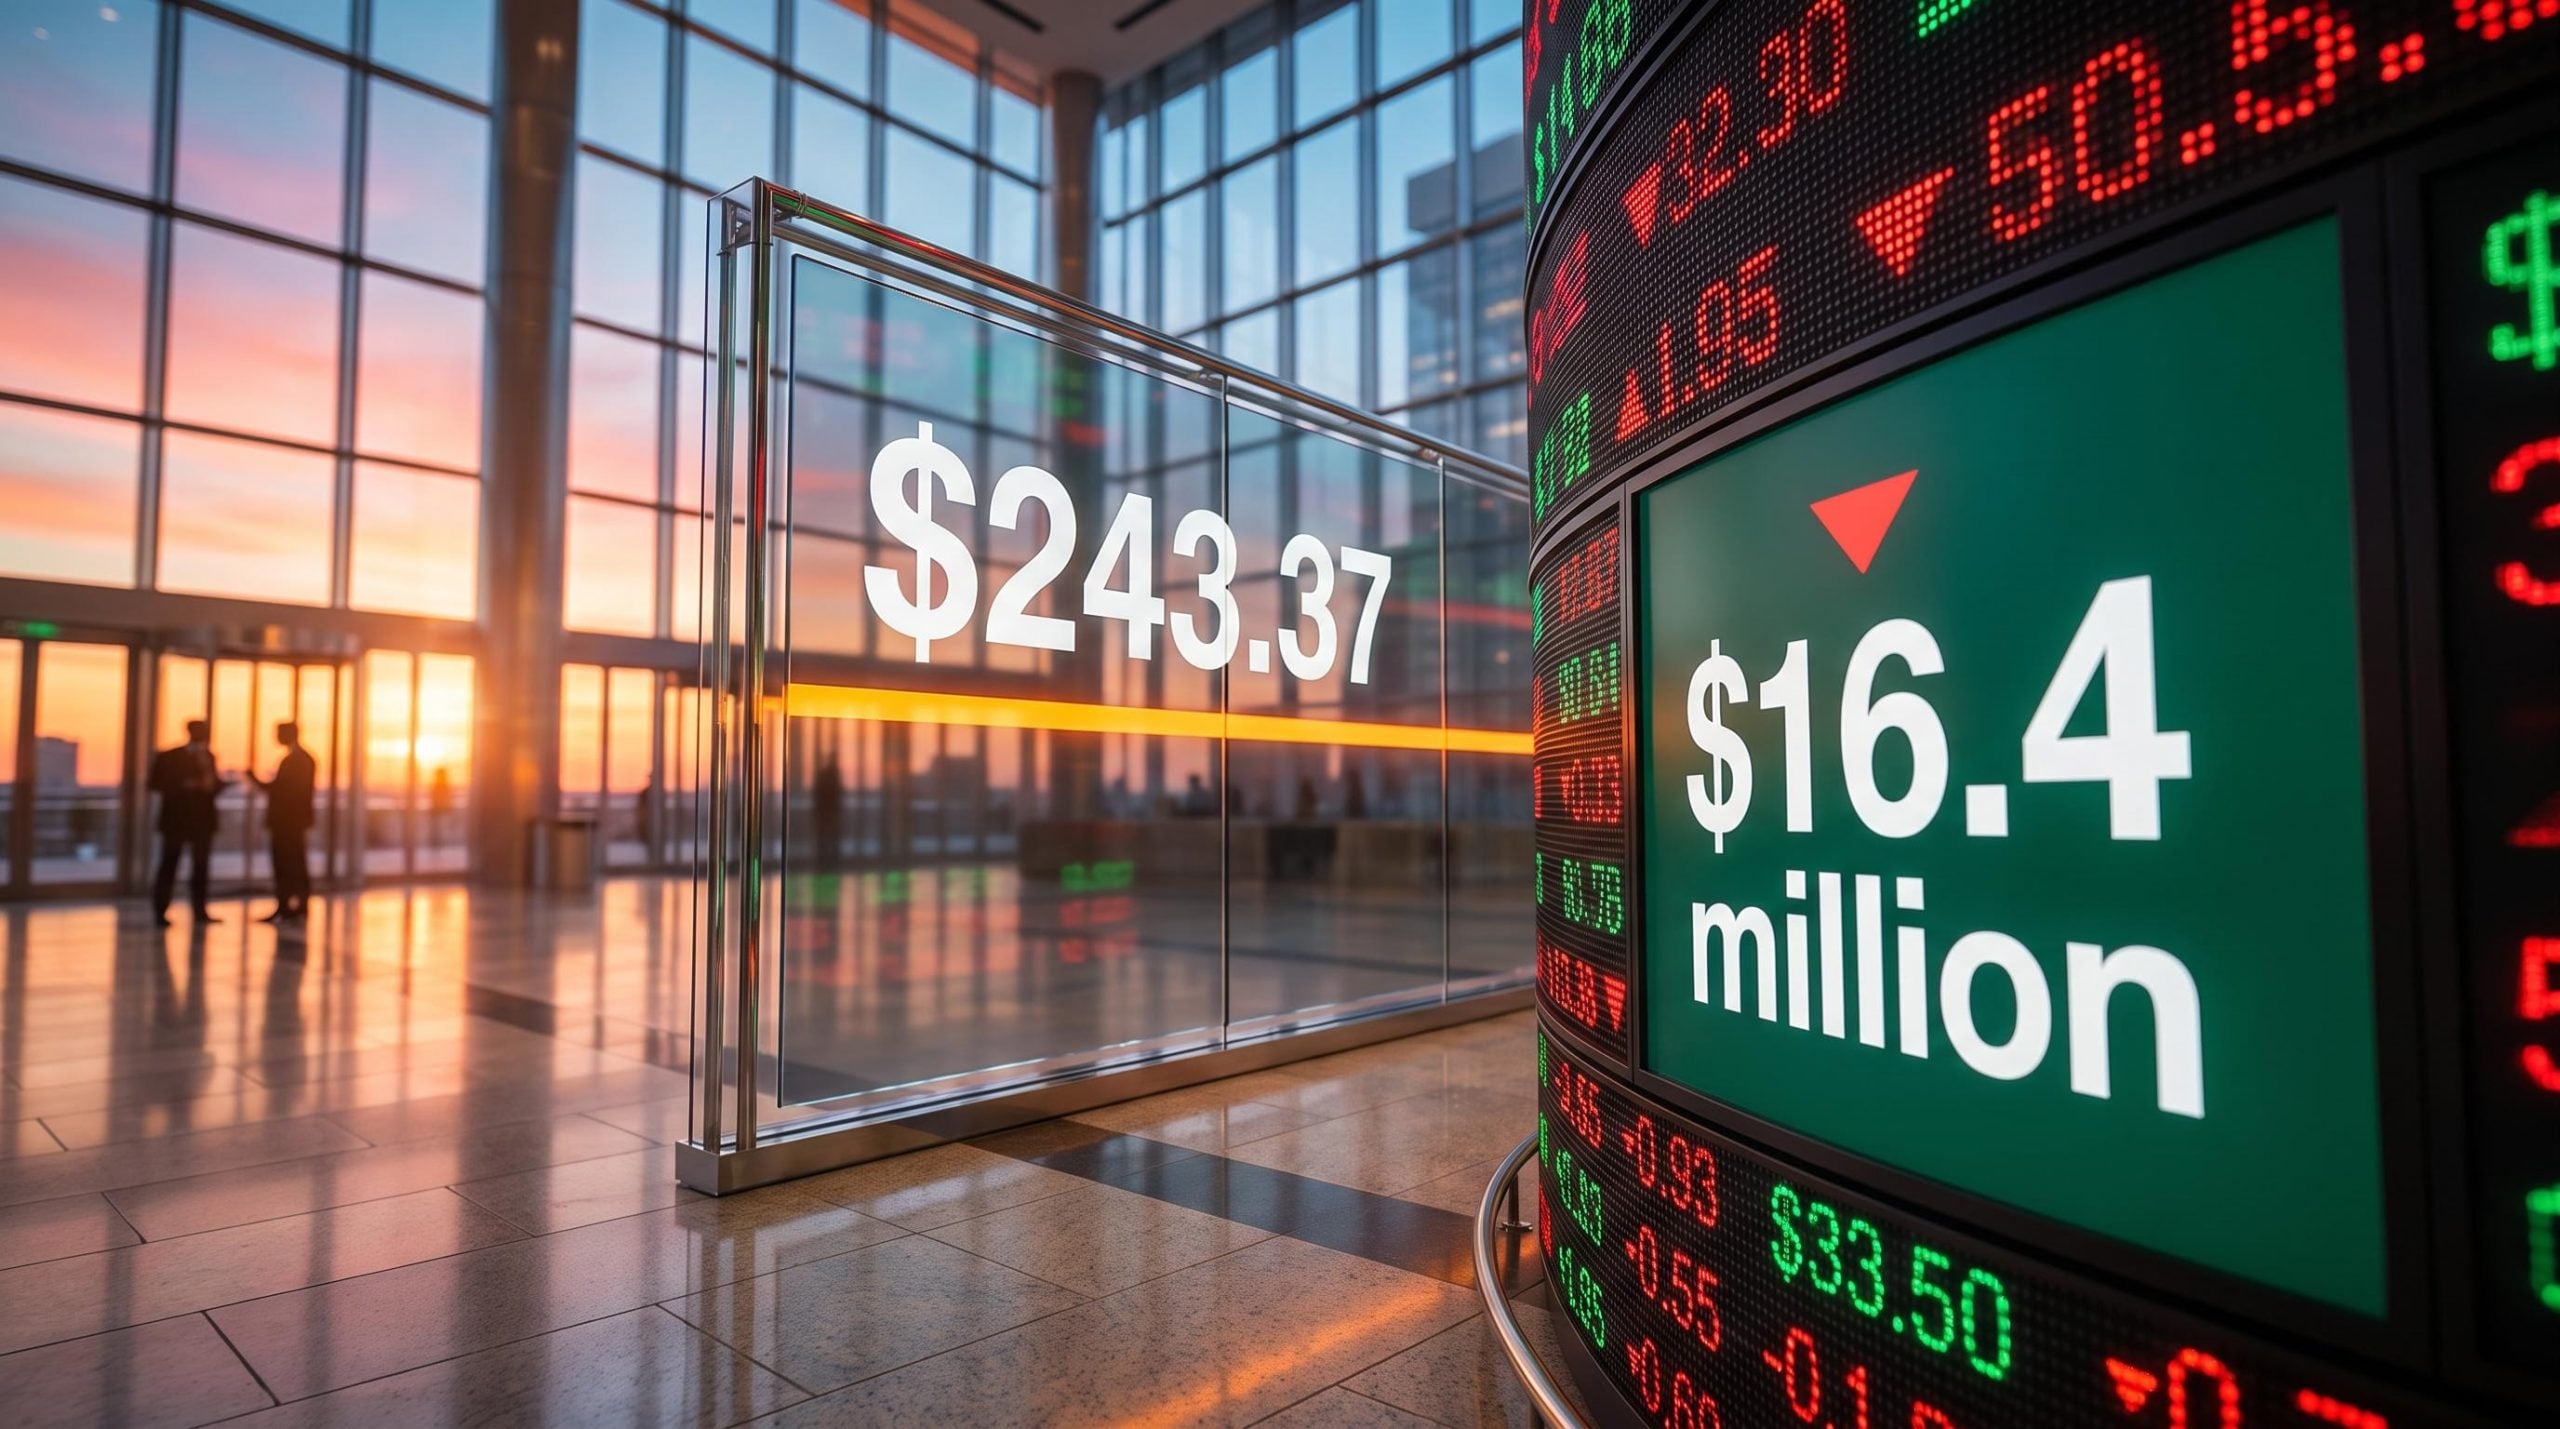
Roughly $16.4 million in bullish options bets landed in Nvidia and Apple during a week when both stocks were falling. Most of the calls only pay off if the shares climb to new 52-week highs. Buying the dip with options is usually read as a bet on a bounce, but these traders are pricing something larger than that.
The weakness had clear sources. Fears about AI spending followed an update on OpenAI’s revenue run rate, and worries about iPhone demand weighed on Apple. Traders used the soft prices to buy calls and sell puts.
One caveat applies throughout. The flow comes from a single presenter account, the Tasty Live “Signal Versus Noise” programme, and the trades were not independently confirmed. Read it as one trader-watcher’s view, not proof of institutional intent.
Here is how to read these trades yourself: the break-evens, the expiries measured against earnings dates, and the difference between buying calls and selling puts. You will also see what this flow proves and what it leaves unproven.
What $16.4 million in bullish bets on Nvidia and Apple actually looks like
Start with the split. Nvidia drew about $12.6 million of the exposure across four legs. Apple drew about $3.8 million through two December call sweeps.
Nvidia closed at $239.24 on 6 October 2026, according to the presenter, just below its record close of $243.37.
| Trade | Action | Premium | Break-even or effective price | Expiry context |
|---|---|---|---|---|
| NVDA 30 Oct 2026 $240 call | Bought at the ask | ~$2.1M | $243.30 | Expires before November earnings |
| NVDA Mar 2027 $230 calls | Bought at the ask | ~$3.7M | $254.85 | About 4.7% above the record close |
| NVDA May 2027 $245 puts | Sold | ~$5.1M | ~$214.30 effective purchase | Long-dated, paid to wait |
| NVDA May 2027 $240 puts | Sold | ~$1.7M | ~$212.15 effective purchase | Long-dated, paid to wait |
| AAPL 18 Dec 2026 $330 calls | Two sweeps, at and above the ask | ~$3.8M combined | Requires new all-time highs | Spans late-October earnings |
All figures above rest on the presenter’s account and were not independently confirmed.
Each of these legs rests on the basic mechanics of call and put options, where one contract controls 100 shares and a buyer’s maximum loss is the premium paid.
Nvidia: four legs, three time horizons
The October 30 call stands apart from the other three legs. Its break-even of $243.30 sits almost exactly at the record close, and it expires before Nvidia reports in November. That makes it a pure run-up trade, and it needs a fresh high within weeks.
The March 2027 calls allow far more time but carry a harder target. They break even at $254.85, which means the stock has to clear its record by nearly 5%.
The put sales are where the conviction shows. By selling the May 2027 puts, these traders collected premium in exchange for agreeing to buy shares at effective prices near $212-$214. The presenter reads this as the strongest signal in the group, because it implies they are willing to own the stock.
That point matters for how you read the whole package. These traders appear comfortable owning Nvidia roughly 10% below its current price, which is a very different position from betting on a quick bounce.
Apple: two sweeps into an earnings catalyst
A sweep is a large order split across several exchanges to fill quickly. Apple’s two 18 December 2026 $330 call sweeps hit while the stock was down about 2%. One filled at the ask and the other above it, so the buyers paid up for speed.
Open interest at that strike was already large, which means these buyers joined an existing crowd. The calls need new all-time highs to profit, and their expiry spans the late-October earnings report. That report is the catalyst these buyers are waiting for.
When big ASX news breaks, our subscribers know first
Why traders bought weakness: the AI spending and iPhone demand backdrop
The headlines gave both stocks a reason to fall. Look closer, though, and the evidence pulls in two directions at once.
Nvidia and the AI revenue question
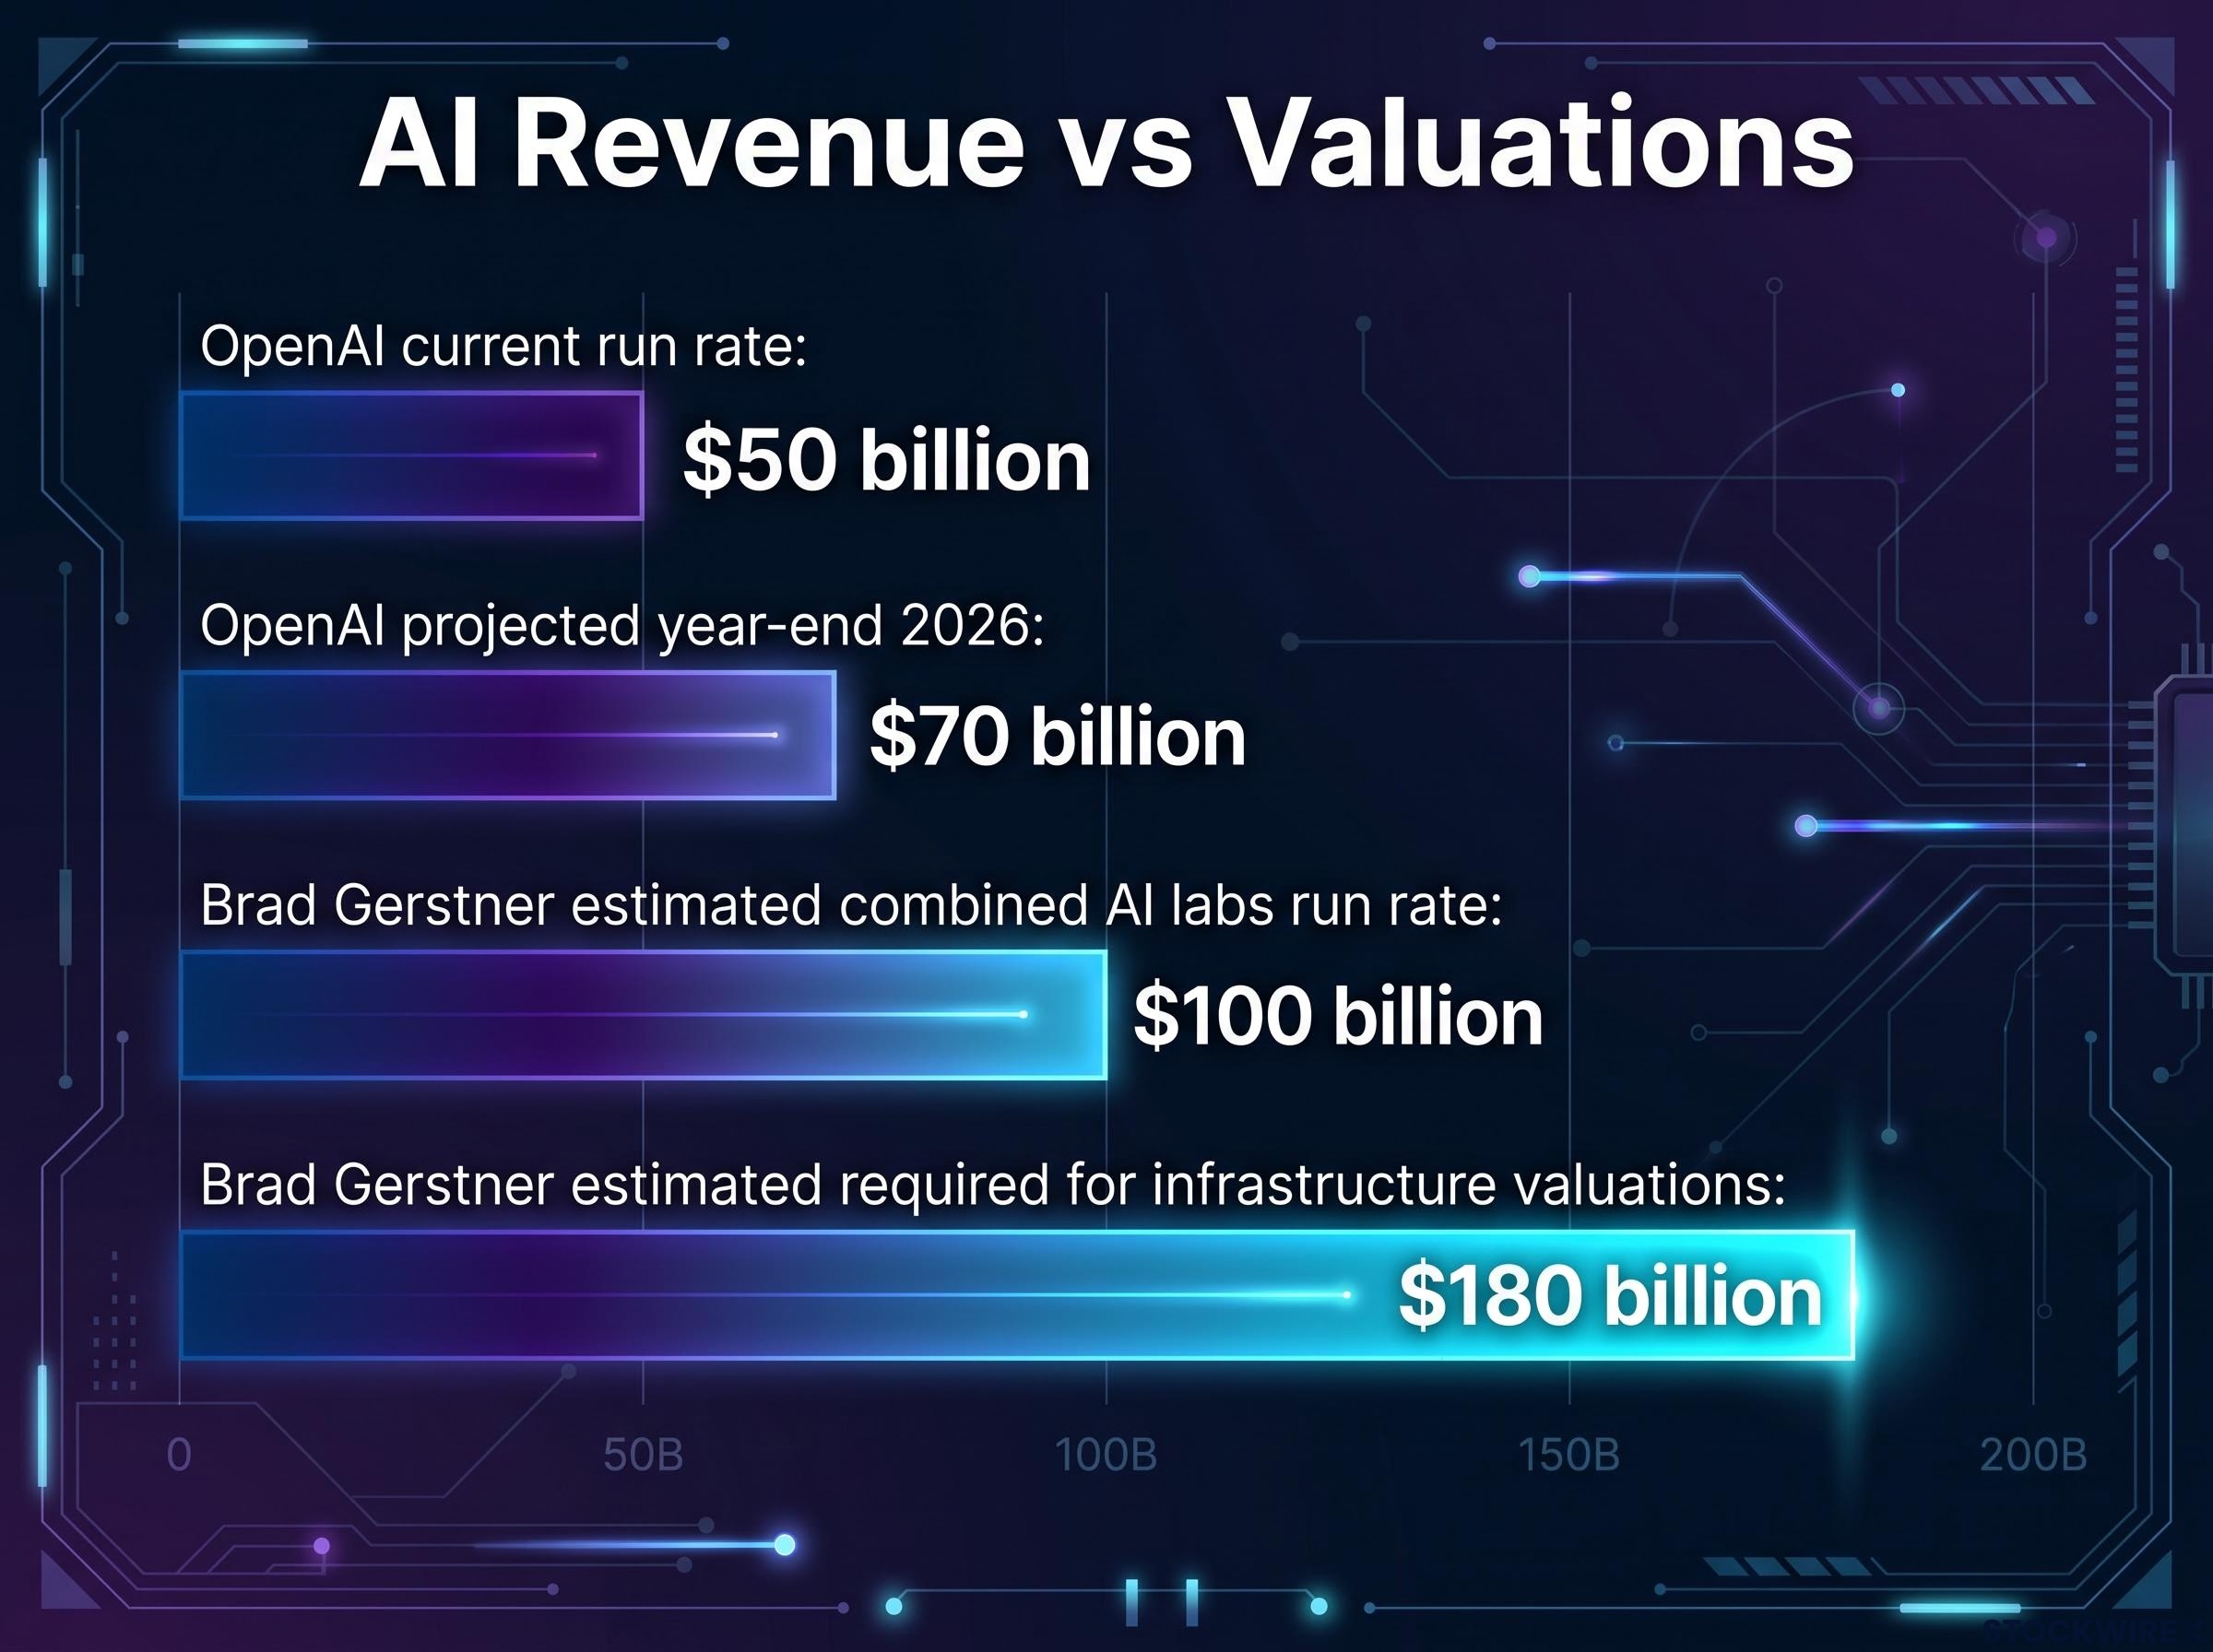
OpenAI reportedly told investors its annualised revenue run rate was about $50 billion. A run rate takes current revenue and projects it over a full year. CNBC reported that the figure fell short of a widely cited $68 billion estimate, which had included partner gross sales. Nvidia, Oracle and other AI stocks dropped after the update.
The picture then shifted. According to the original source, the $50 billion reflected the end of September, with about $70 billion projected by year-end 2026. CNBC also reported that OpenAI cited 77% run-rate growth in its third quarter and 107% growth in its enterprise business.
The valuation argument sits underneath all of this. Altimeter’s Brad Gerstner estimated a combined run rate of about $100 billion across the major AI labs, against roughly $180 billion he argued would be needed to justify infrastructure valuations. That estimate was not independently confirmed. If it holds, current revenue is impressive but still short of what the market is pricing.
Whether AI lab revenue can close the gap to the roughly $180 billion Gerstner cites is the variable that will test Nvidia’s valuation, and each new disclosure moves the odds.
Apple and the iPhone demand tug-of-war
Apple’s debate is less about whether people want iPhones and more about whether Apple can supply them at prices buyers will accept.
“demand robustness is running into a wall of supply and cost challenges.” J.P. Morgan analysts led by Samik Chatterjee
The evidence splits cleanly:
- Bearish: MarketBeat reported that Apple cut component orders for the iPhone 18 Pro and Pro Max by at least 15%, and possibly 20%.
- Bearish: Jefferies cut its iPhone average selling price growth forecast from 9.0% to 6.8% for fiscal 2026-2031, and KeyBanc moved to underweight.
- Constructive: Revenue rose 16% in Q1 2026, with iPhone sales up 23%.
- Constructive: Analyst Mohan argues demand is largely unaffected by price rises of $50-$100.
The news explains why the stocks fell, but it does not settle the underlying question. You should read the bullish trades as a bet on an unresolved debate, not as a verdict on it.
How to read break-evens, expiries and the call-versus-put difference
Three mechanics turn a headline dollar figure into a trade you can actually judge. Each one can be tested on the trades above.
Break-evens
A long call breaks even at expiry when the stock reaches the strike price plus the premium paid. The Nvidia October $240 call cost about $3.30 per share, which puts its break-even at $243.30.
A cash-secured short put works in reverse. Its break-even is the strike minus the premium collected. On the May $245 puts, roughly $30.70 of premium brings the effective purchase price down to about $214.30.
Selling cash-secured puts works as income on reserved capital, but the downside mirrors owning the shares at the strike, with the premium offering only a modest buffer.
Expiry and earnings
Implied volatility, or IV, is the size of the price move the options market expects. It usually rises before earnings and then collapses once results are out, a drop known as IV crush.
The October 30 Nvidia call avoids earnings altogether, so it relies purely on momentum. The Apple December calls run through the late-October report, so their buyers paid for that event. If the move turns out smaller than the market expected, they can still lose money.
Calls versus short puts
| Feature | Long call | Cash-secured short put |
|---|---|---|
| Break-even | Strike plus premium | Strike minus premium |
| Max loss | Premium paid | Strike minus premium, if the stock goes to zero |
| Upfront cash flow | Pay premium | Receive premium |
| Main risk | Time decay and IV crush | Assignment during a steep fall |
Time decay, or theta, is the value an option loses each day as expiry approaches. Options educators often describe short puts as a synthetic limit buy order: you collect income while you wait, but you also take on downside risk.
Before trusting any flow headline, run a three-step check:
- Break-even: How far does the stock have to move for the trade to pay off?
- Expiry versus earnings: Does the position need a catalyst, or does it need to move before one?
- Opening versus hedging: Is this a new directional bet, or part of a spread, a hedge or a closing trade?
Unusual activity means volume or open interest far above normal levels. Size alone does not reveal intent. Once you can calculate the break-even and check the expiry, you can tell whether a trader needs a fast breakout or just patience, and whether they are paying for the move or being paid to wait.
What the flow cannot tell you, and the risks of buying the dip with options
The appeal is easy to see. Calls offer exposure to a sharp rebound for a limited outlay, and short puts pay income upfront. Both suit traders who view Nvidia and Apple as long-term winners going through a temporary sentiment shock.
The ways these trades fail are just as specific:
- Elevated IV: Buying into a selloff means paying for inflated volatility, and the option can lose value even if the stock recovers modestly.
- Time decay: The October 30 call has roughly three weeks left to reach a record high. A slow recovery erodes it.
- Assignment: If the decline deepens, short put sellers can be forced to buy shares and end up with a concentrated long position.
- Gap risk: Mega-cap tech stocks can drop sharply overnight on earnings or macro shocks, and leverage magnifies the damage.
History supports this caution. During the 2022-2023 tech drawdown, short-dated dip-buying calls often expired worthless as the declines dragged on. Longer-dated calls and cash-secured puts sometimes worked, depending on the time horizon and the strikes chosen.
Key caution A large trade can be a hedge, one leg of a spread or a closing transaction.
In this case, nothing about the trades has been independently confirmed, and the trader’s identity and existing positions are unknown. Treat unusual flow as one input about positioning, not as a forecast, because you cannot see the hedges, the other legs or the trader’s wider book.
For readers weighing short puts themselves, our dedicated guide to setting a loss exit rule before selling puts shows how to set a buyback target before entry.
What the dip-buying flow changes, and what it leaves open
The trades show conviction spread across different time horizons. They range from a three-week Nvidia sprint to positions running out to May 2027, and the put sales carry the strongest signal of willingness to own the stock. They do not resolve whether AI lab revenue can grow into infrastructure valuations, or whether iPhone buyers will absorb higher prices.
Your decision points are near. Apple reports in late October, Nvidia follows in November, and further OpenAI revenue updates will test the spending story directly. Each of these events will either support or undercut the hurdles these traders accepted.
Use the flow as context. It shows where some money is leaning and how much time it is giving the trade, but it is not a trading signal to copy.
This article is for informational purposes only and should not be considered financial advice. Investors should conduct their own research and consult with financial professionals before making investment decisions. Options involve substantial risk, and past performance does not guarantee future results.