
Ray Dalio did not predict an AI crash this week. He said the AI bubble is “close” to the stage of the cycle where bubbles tend to burst, and many headlines treated that as a forecast. He gave no date and no estimate of how far prices might fall.
That gap matters because the conditions he described are real. The 10-year US Treasury yield closed at 5.22% on 8 October 2026, after touching about 5.37% earlier in the week, its highest level in 24 years. Morgan Stanley estimates that AI-linked debt issuance is heading toward roughly $570 billion this year.
Dalio made his remarks at the Forbes Global CEO Conference in Singapore, during a panel on 7 October. The combination of rising borrowing costs and record AI borrowing is the setup he says turns enthusiasm into forced selling.
Here is how to read his warning for what it is, set it against what options markets are actually pricing, and track the indicators that would show whether his concern is starting to play out.
What did Dalio actually say, and what did he leave out?
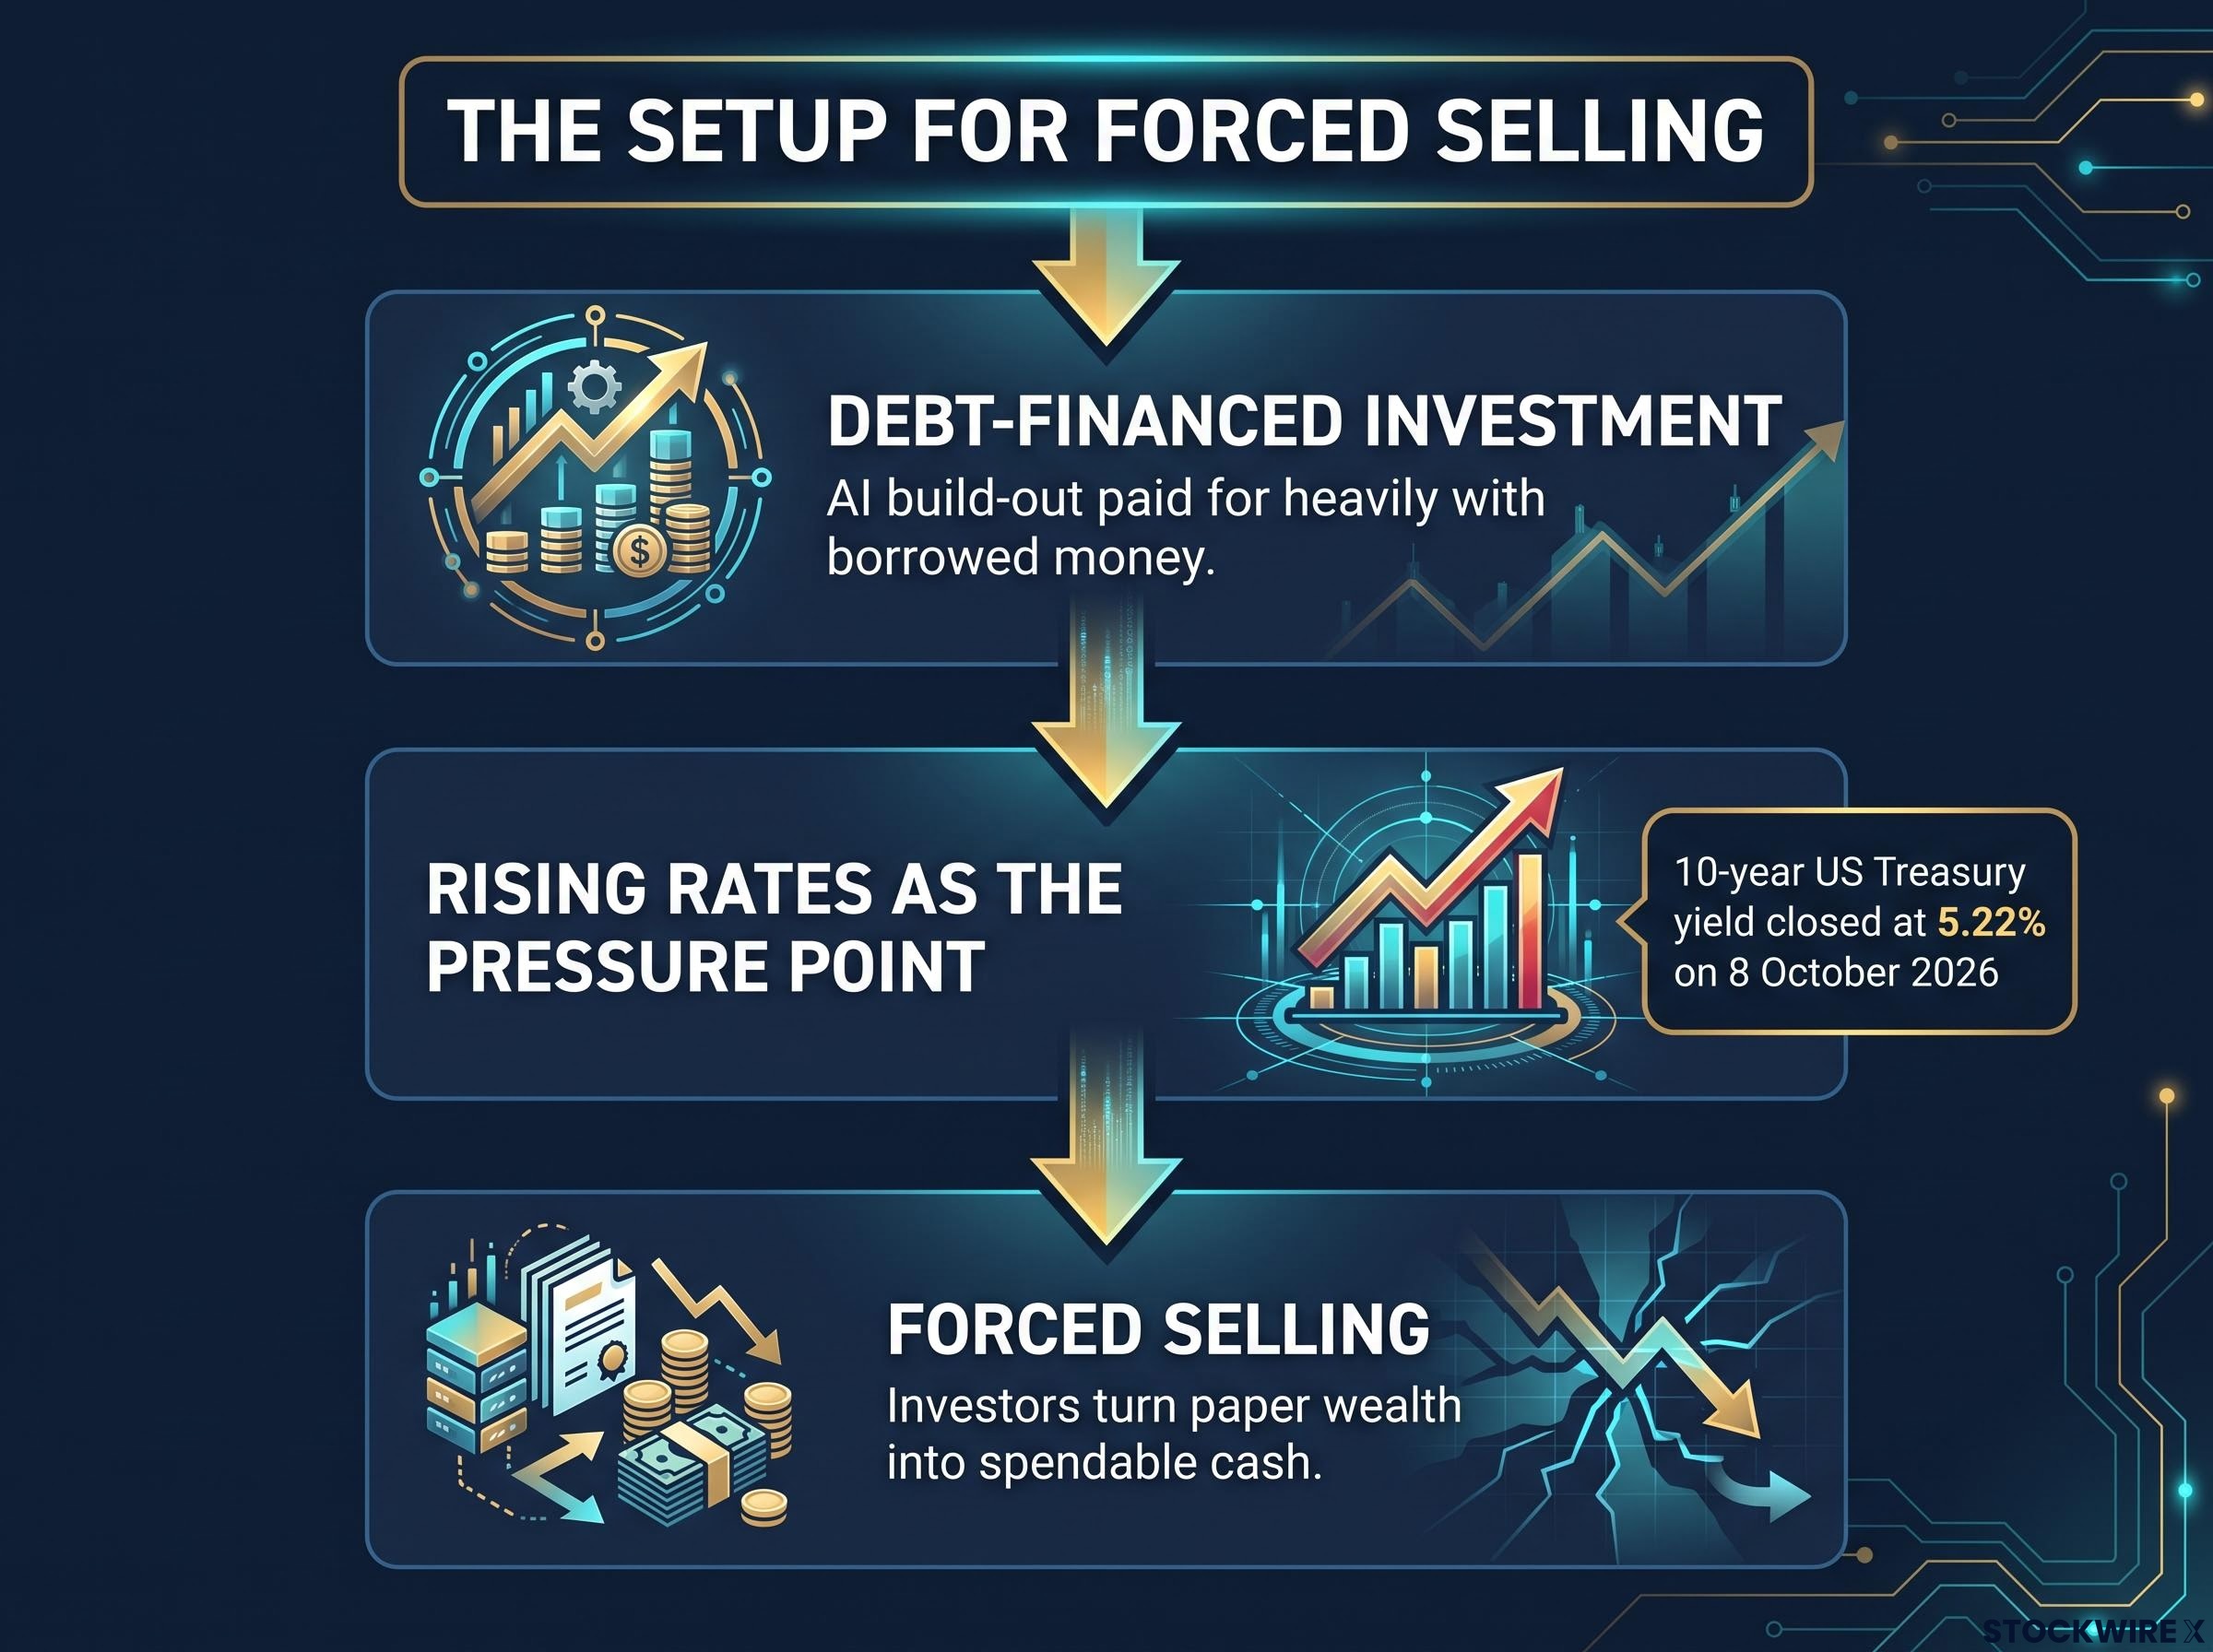
The argument is specific. Ray Dalio, co-founder of Bridgewater Associates (founded in 1975 and known for its research on debt cycles), set out a three-part chain:
- Debt-financed investment: the AI build-out is being paid for heavily with borrowed money.
- Rising rates as the pressure point: higher interest rates are the force that tends to deflate bubbles built on borrowing.
- Forced selling: investors eventually need to turn paper wealth into spendable cash, for taxes or spending, and higher financing costs make those sales more likely.
He pointed to gains concentrated in a handful of AI-linked stocks and compared the setup with the 1920s and with the 2000 dot-com bubble. According to the Business Times, he said there was “a lot of pressure” for further rate rises.
He also made a concession. Dalio accepted that AI could change the economy profoundly, and that major technologies often arrive alongside major bubbles. His open question is whether share prices have run ahead of the productivity AI will actually deliver.
Dalio’s debt crisis research traces how leverage builds and how tightening credit forces asset sales, the same chain he now applies to AI-linked borrowing, though that framework describes mechanics rather than a timetable.
Then look at how he described the timing.
Dalio on timing: The current stage is “the part of the cycle that is before that but approaching that,” he said, adding: “I think we’re close to that.”
“Approaching.” “I think.” “Close.” The mechanism is precise, but the outcome is left open. Dalio did not say a fall would come within 12 months, and he did not say prices would halve.
For you, this means his remarks describe the conditions that make a market fragile, not a countdown. Treating them as a sell signal reads more into them than he said.
When big ASX news breaks, our subscribers know first
How do 1929 and 2000 compare with today’s setup?
Dalio’s two precedents took different routes to the same trigger. In the 1920s, stocks rose on new technologies such as radio and cars, and many investors bought with margin loans (money borrowed from a broker against the shares themselves). When rates rose and credit tightened, those loans forced selling.
In 2000, internet enthusiasm lifted the Nasdaq while unprofitable dot-coms burned through cash. The Federal Reserve raised rates, financing windows closed, and companies that depended on fresh capital ran out of money.
| Episode | Peak | Trough | Decline | Time to regain high |
|---|---|---|---|---|
| Dow, 1929-1932 | 381.17 (3 Sep 1929) | 41.22 (8 Jul 1932) | About 89% | Until 23 Nov 1954 |
| Nasdaq Composite, 2000-2002 | About 5,048 (10 Mar 2000) | About 1,114 (9 Oct 2002) | About 78% | Roughly 15 years (around 2015; some sources run to 2017) |
The Nasdaq-100 fell by more than 80% over the same period. These are price-index figures; recovery measured with dividends included was typically faster.
The common thread is borrowed money meeting tighter credit. Today’s version is corporate rather than personal. Morgan Stanley data shows Amazon, Microsoft, Alphabet, Meta and Oracle issued about $200 billion of investment-grade debt in H1 2026. Some of that capital flows in a circle, with suppliers such as Nvidia financing customers that buy their products.
Bear market recovery time depends heavily on the cause of the decline; valuation-driven busts like 2000 have historically taken years of earnings growth to absorb, while dividends reinvested shorten the path back to prior highs.
What this tells you is that the damage in past bubbles came less from the initial fall than from the decades of recovery. If you have a finite investing horizon, that timeline is the real risk.
Where the analogy strains
Many dot-com firms had little or no revenue. Today’s AI leaders generate substantial earnings, cash flow and cash balances.
Several large sell-side firms and asset managers, including Goldman Sachs, Morgan Stanley and BlackRock, are commonly cited as holding a “rich but not a bubble” view. On that reading, AI leaders are expensive, concentrated and vulnerable to shocks, but backed by real profits. This is a widely reported position rather than a confirmed consensus.
What would a 78% or 89% fall in the Nasdaq-100 look like?
Take the Nasdaq-100’s close of 30,725 on 8 October. The index then set a record close of 30,883.15 on 9 October, but the arithmetic below uses the Thursday figure.
| Scenario | Decline | Implied level | Points lost |
|---|---|---|---|
| Repeat of 2000-2002 | 78% | About 6,750 | About 24,000 |
| Repeat of 1929-1932 | 89% | About 3,380 | About 27,300 |
A fall to about 6,750 would return the index to a level it first reached in 2017, more than nine years ago. Either scenario wipes out more than 20,000 points of gains.
Those numbers are uncomfortable by design. They are also deliberately extreme.
Illustrative, not a forecast: These figures apply the two worst historical drawdowns to today’s level to show scale. Neither Dalio nor any source cited here predicts a decline of this size. Past performance does not guarantee future results.
Read them as a measure of tail risk, meaning the rare but severe outcomes at the edge of the range. They help you ask how much of your portfolio you could watch fall this far without being forced to sell.
What do options markets actually price in?
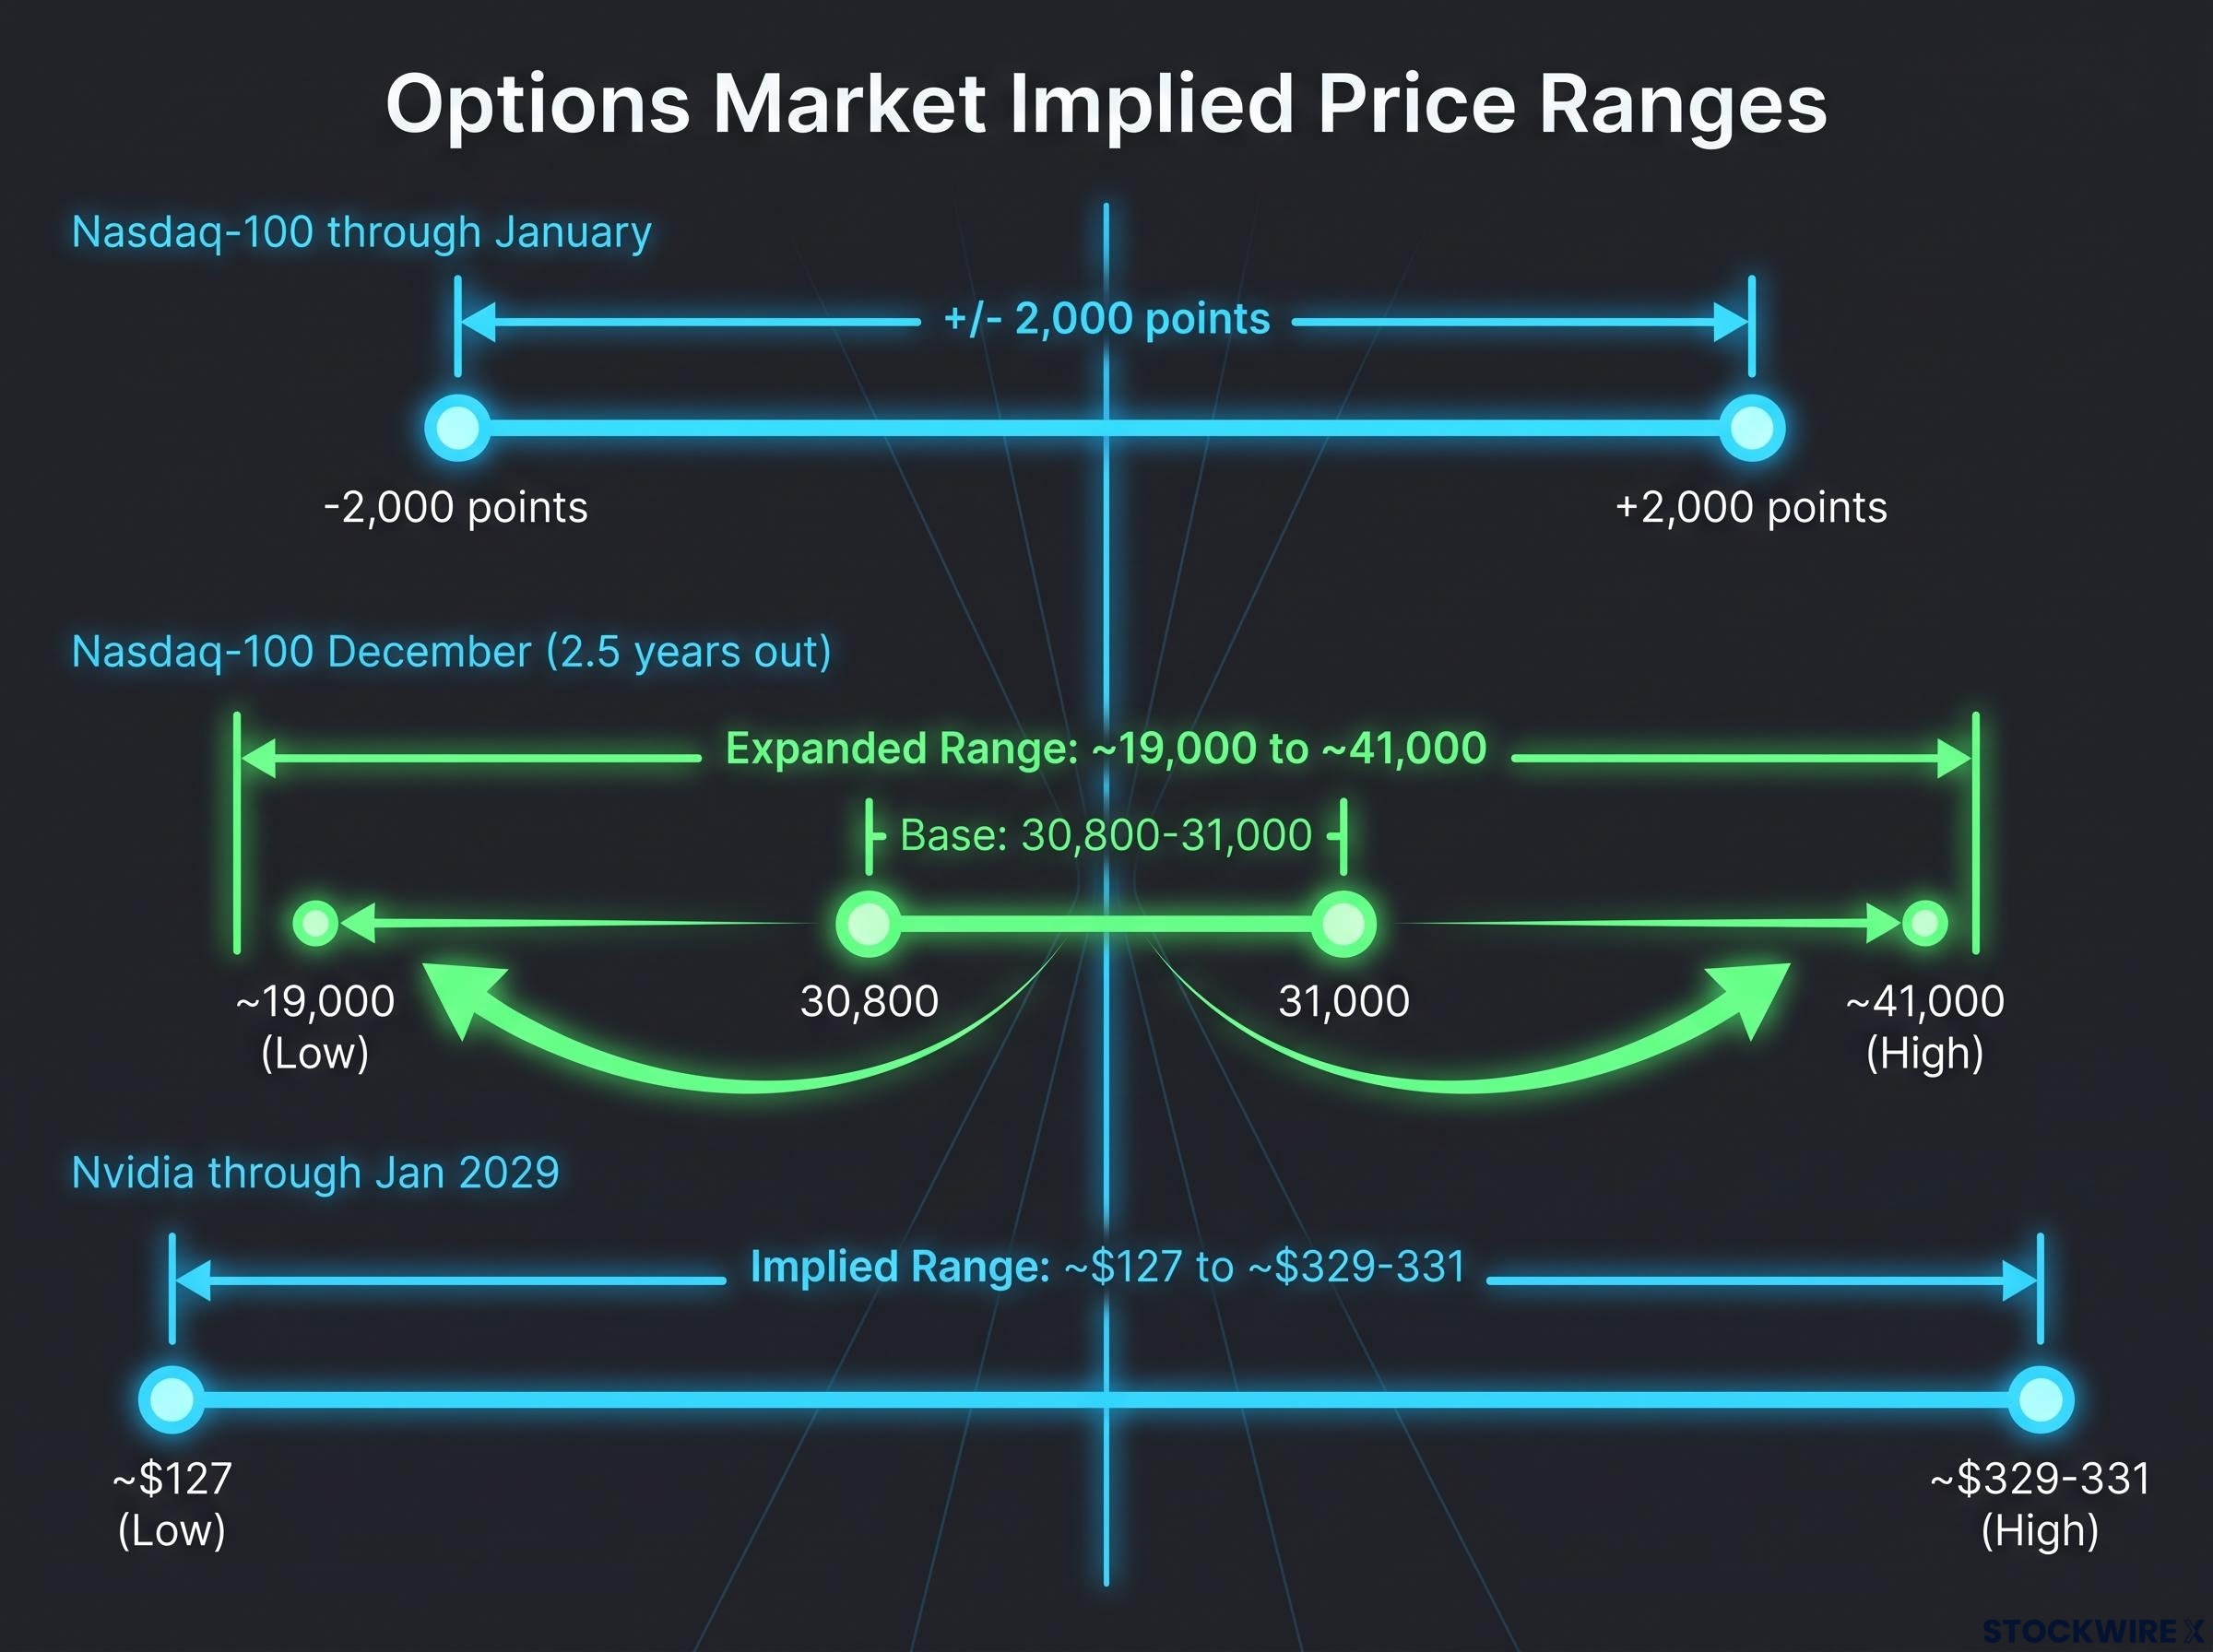
Against those drawdowns, the options market looks far calmer. According to straddle analysis by Jamal Chandler of Math Check, the implied ranges are wide but nowhere near a historic collapse:
- Nasdaq-100 through January: roughly a 2,000-point move in either direction.
- Nasdaq-100, furthest-dated December contracts (about 2.5 years out): roughly 10,000 points either way, implying about 19,000 on the low side and 41,000 on the high side from a base near 30,800-31,000.
- Nvidia through January 2029: about $102 either way, implying roughly $127 low and $329-331 high.
These are one analyst’s calculations, not a public benchmark. Public reporting did not independently locate the 2028-2029 contract data.
Implied volatility, the level of future price swings built into option prices, is the key input. It is a risk-neutral price of uncertainty, meaning a market price for risk rather than a real-world probability. It is shaped by hedging, speculation and demand from structured products, so it does not measure the odds of a collapse.
How to read an implied move
A straddle means buying a call option (a bet the price rises) and a put option (a bet the price falls) at the same strike price. What it costs tells you how big a move the market is paying to protect against, in either direction.
That range is symmetric by construction. It says nothing about which way prices will go.
This tells you the market is pricing a wide spread of outcomes, not a crash. A low-probability tail like the one Dalio describes may be underpriced or simply ignored, and implied volatility alone cannot tell you which.
Which indicators separate a warning from a forecast?
A warning flags vulnerability and the triggers that could expose it. A forecast commits to timing and magnitude. Dalio offered the first, which means the useful response is to watch the triggers yourself.
- Bond yields: sustained 10-year yields above about 5% raise the discount rates used to value long-dated growth.
- Credit spreads and issuance: spreads are the extra yield companies pay over government bonds. A sudden widening or a drop in issuance often comes before investors cut risk; the 2000-2002 and 2007-2008 episodes are commonly cited examples.
- Capex versus cash generation: a warning sign is capital spending persistently growing faster than operating cash flow, especially where it is funded by customer financing.
- Concentration: gains narrowing further into a few mega-caps echoes 1929 industrials, the 1970s Nifty Fifty and the 2010s FAANG stocks.
- Leverage: rising margin debt, leveraged ETFs and derivatives exposure amplify moves in both directions.
| Indicator | Current reading | Warning sign |
|---|---|---|
| 10-year Treasury yield | 5.22% close, 8 Oct (FRED) | Holding above about 5% |
| AI-linked issuance | Heading toward about $570B in 2026, more than double 2025 (Morgan Stanley) | Abrupt slowdown or wider spreads |
| Capex vs cash flow | Large share of operating cash flow directed to capex | Capex growth outpacing cash generation |
| Concentration | Gains concentrated in a handful of AI-linked stocks | Further narrowing of leadership |
Context cuts both ways. The Math Check presenter says AI-tied debt is being issued at roughly 5-6%, which has not been independently verified and is not a record compared with 1980s borrowing costs. Lower interest rates, or easing US-Iran tensions that reduce oil prices and inflation, could relieve the pressure.
With the 10-year yield above 5%, the equity risk premium has collapsed toward zero, meaning stocks and risk-free bonds now compete for the same dollar at roughly equal yields.
For you, the practical takeaway is that yields and credit conditions give earlier and more measurable signals than anyone’s timing call.
What the warning changes, and what it does not
The mechanism Dalio describes holds together: heavy borrowing, rising rates and forced selling have ended booms before. The 1929 and 2000 parallels are instructive, but today’s AI leaders have the earnings those earlier markets lacked. Options markets price a wide range of outcomes without a crash.
That makes the warning a prompt to review your exposure, hedging and liquidity, not a signal to time an exit.
Three variables deserve your attention from here: the trend in the 10-year yield, the pace of AI debt issuance alongside credit spreads, and whether capital spending keeps outrunning cash flow. Nobody can predict when, or whether, the pressure breaks.
Readers interested in a credit-cycle lens on this build-out can read our deep-dive into Austrian business cycle theory, which tests four markers of credit-driven malinvestment against the AI boom.
This article is for informational purposes only and should not be considered financial advice. Investors should conduct their own research and consult with financial professionals before making investment decisions. Forward-looking statements are speculative and subject to change based on market developments.