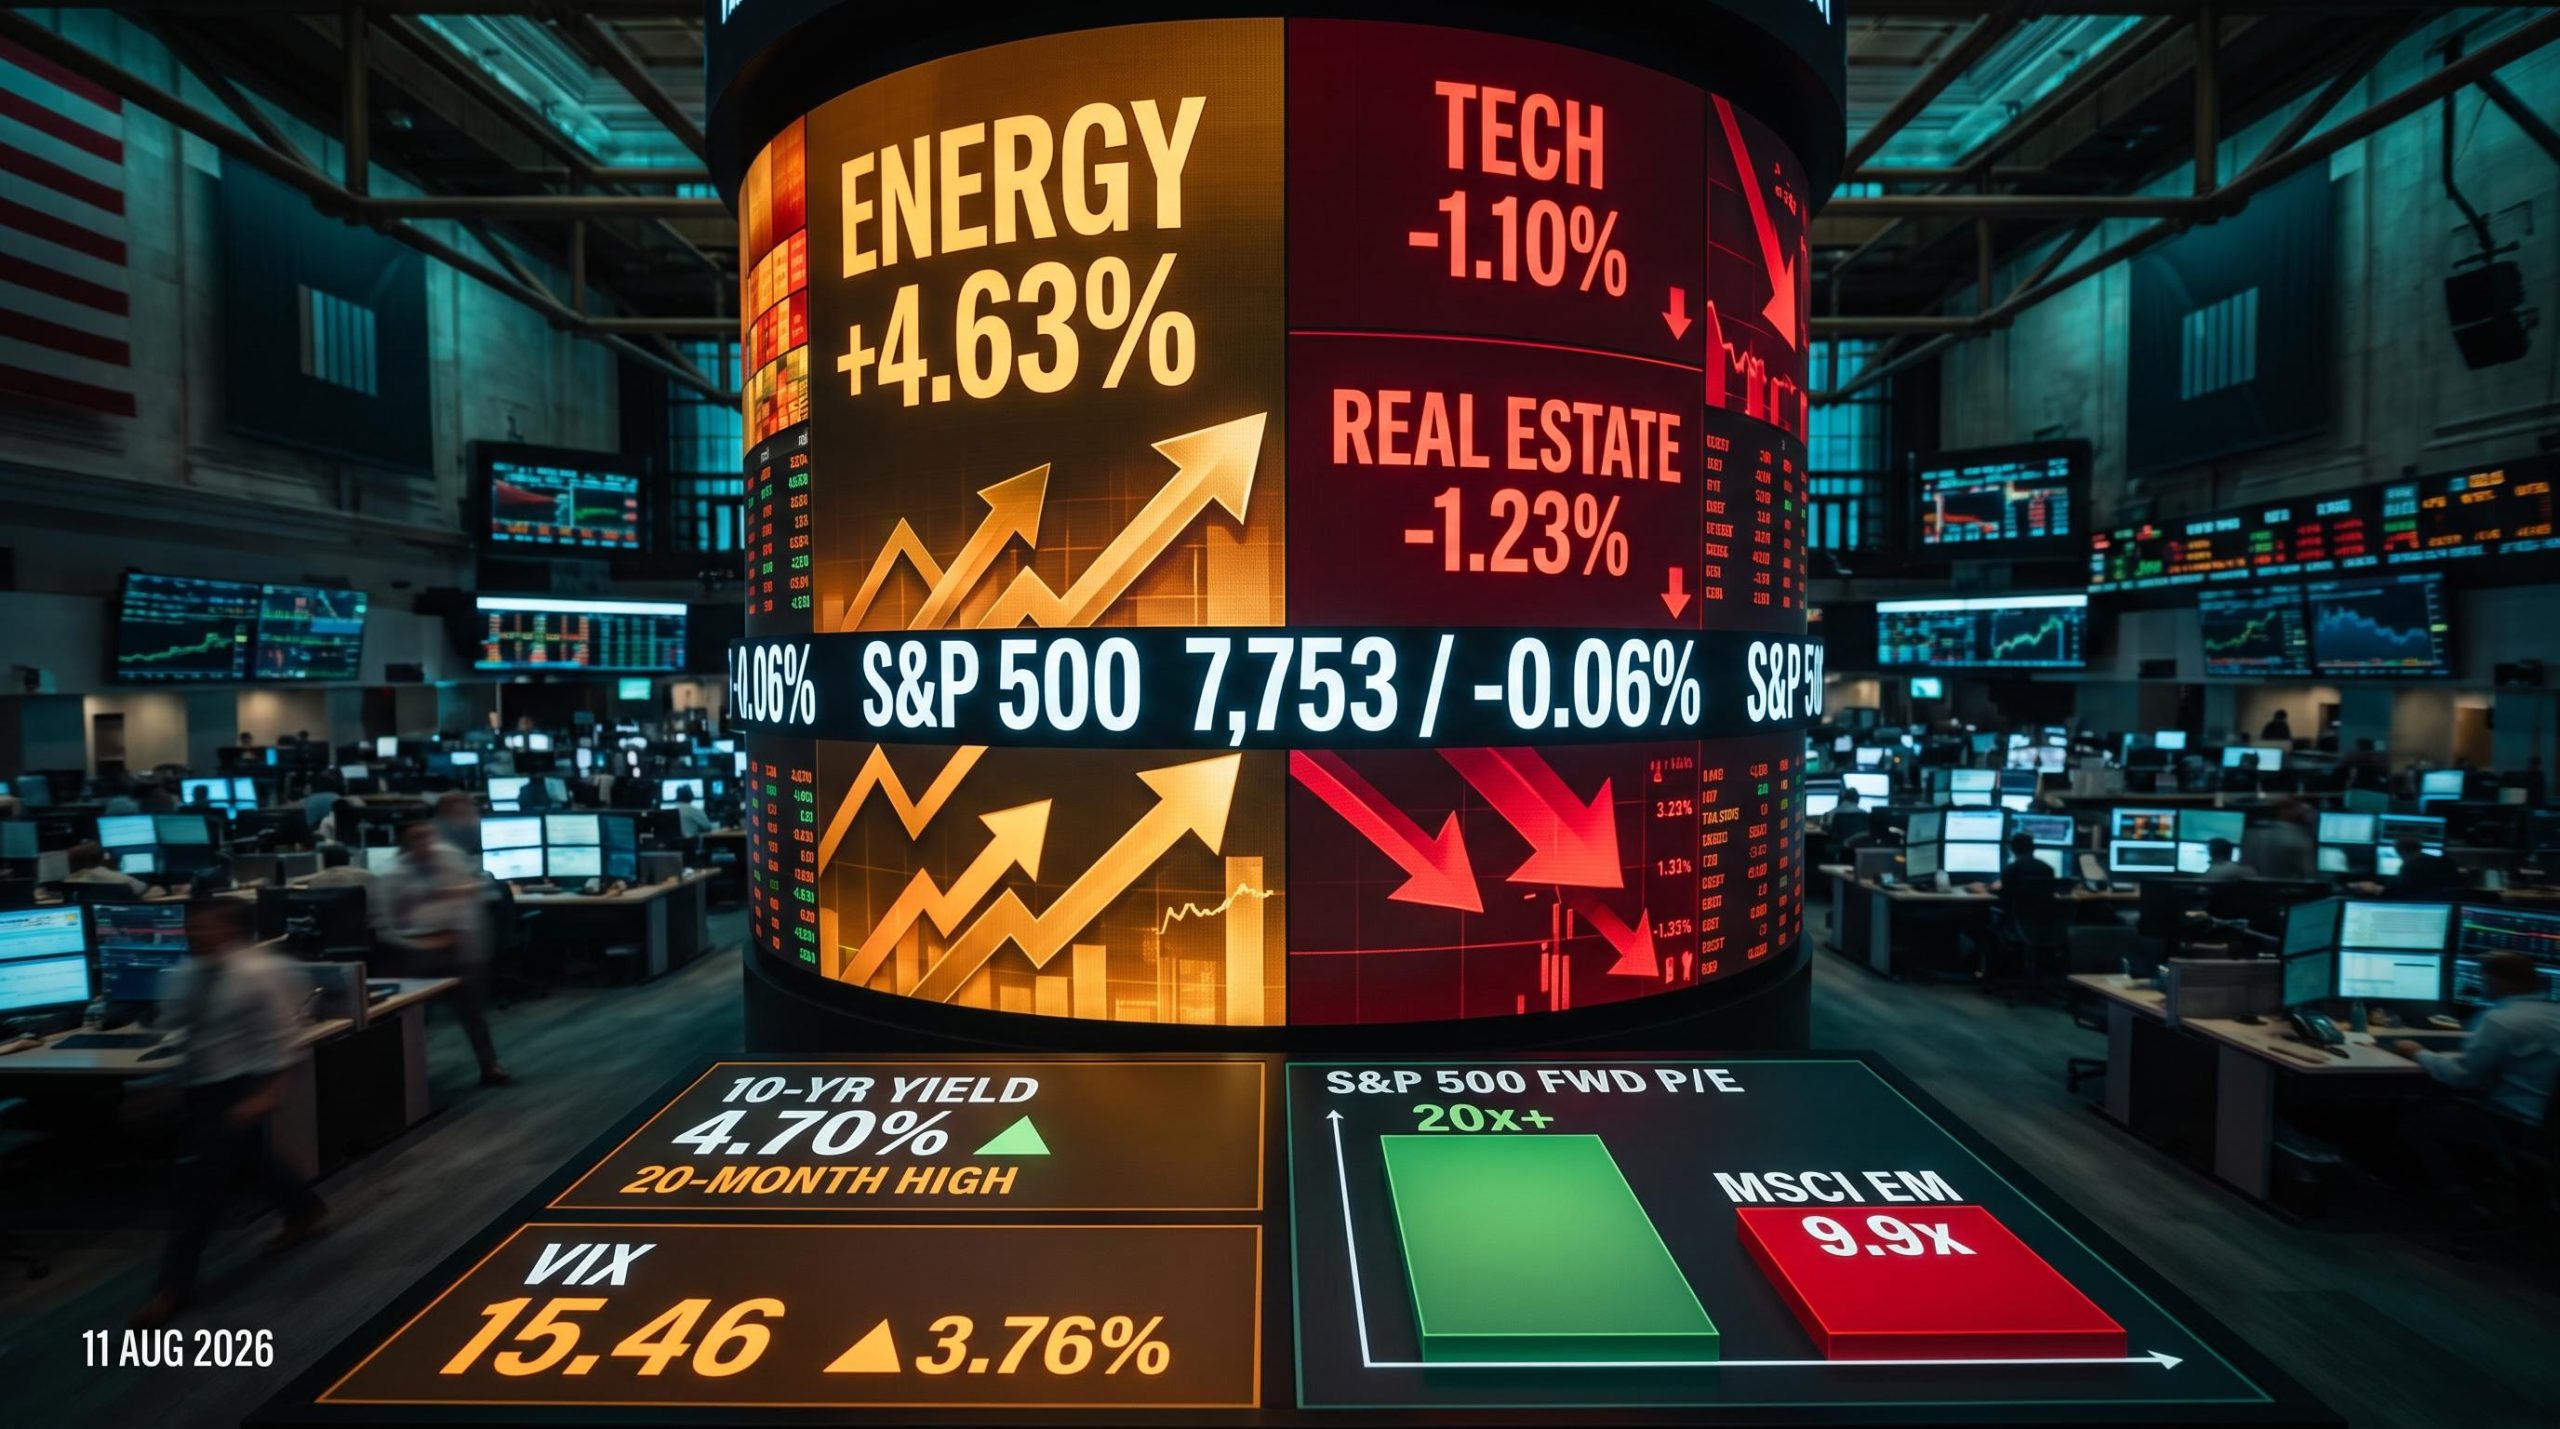
The S&P 500 closed at 7,753 on Tuesday, down just 0.06%, the kind of session most investors would scroll past without a second thought. Beneath that stillness, the session contained one of the sharpest single-day sector divergences of 2026, a bond yield spike approaching a 20-month high, and options positioning that historically signals a market primed for a correction.
The flat close is the headline. The story is everything underneath it.
Tuesday, 11 August 2026, was a session where the headline number actively misled. Six of eleven S&P 500 sectors posted gains. Energy surged nearly 5%. The equal-weight index finished within a point of its all-time high. Yet the cap-weighted number, the one that lands in every push notification, registered a loss. For anyone searching for US stock market news today, the surface calm masks a meaningful shift in market leadership, rate sensitivity, and investor sentiment.
Here is what each of Tuesday’s hidden signals means for your portfolio, and the specific questions you should be asking right now.
Indices flatline, but the numbers underneath tell a different story
The four major indices all closed lower, but the losses were marginal and almost entirely driven by concentrated weakness in large-cap technology names.
| Index | Close | Change (%) |
|---|---|---|
| S&P 500 | 7,753 | -0.06% |
| Dow Jones Industrial Average | 53,976 | -0.11% |
| NASDAQ Composite | 26,605 | -0.32% |
| Russell 2000 | 3,017 | -0.56% |
The breadth signal matters more than the headline
More than half of all sectors finished in positive territory. The equal-weight S&P 500, which assigns an identical weighting to every constituent rather than scaling by market capitalisation, closed just one point short of the all-time high it set on 4 August 2026.
That divergence tells you something specific: the bull market is not breaking down broadly. A small cohort of overweight mega-caps is dragging the headline number. For most stocks, Tuesday was an unremarkable, slightly positive day. Understanding that distinction, cap-weighted versus equal-weighted performance, is how you diagnose whether a weak session represents broad deterioration or concentrated pressure on a handful of names.
The divergence between the cap-weighted S&P 500 and its equal-weight counterpart is not new to 2026: S&P 500 concentration risk has been building for months, with just 19 semiconductor stocks driving approximately 70% of the index’s year-to-date market capitalisation gains and the effective number of stocks powering returns shrinking to roughly 54 of 503 constituents.
When big ASX news breaks, our subscribers know first
Energy’s 4.63% surge and what sector rotation is actually signalling
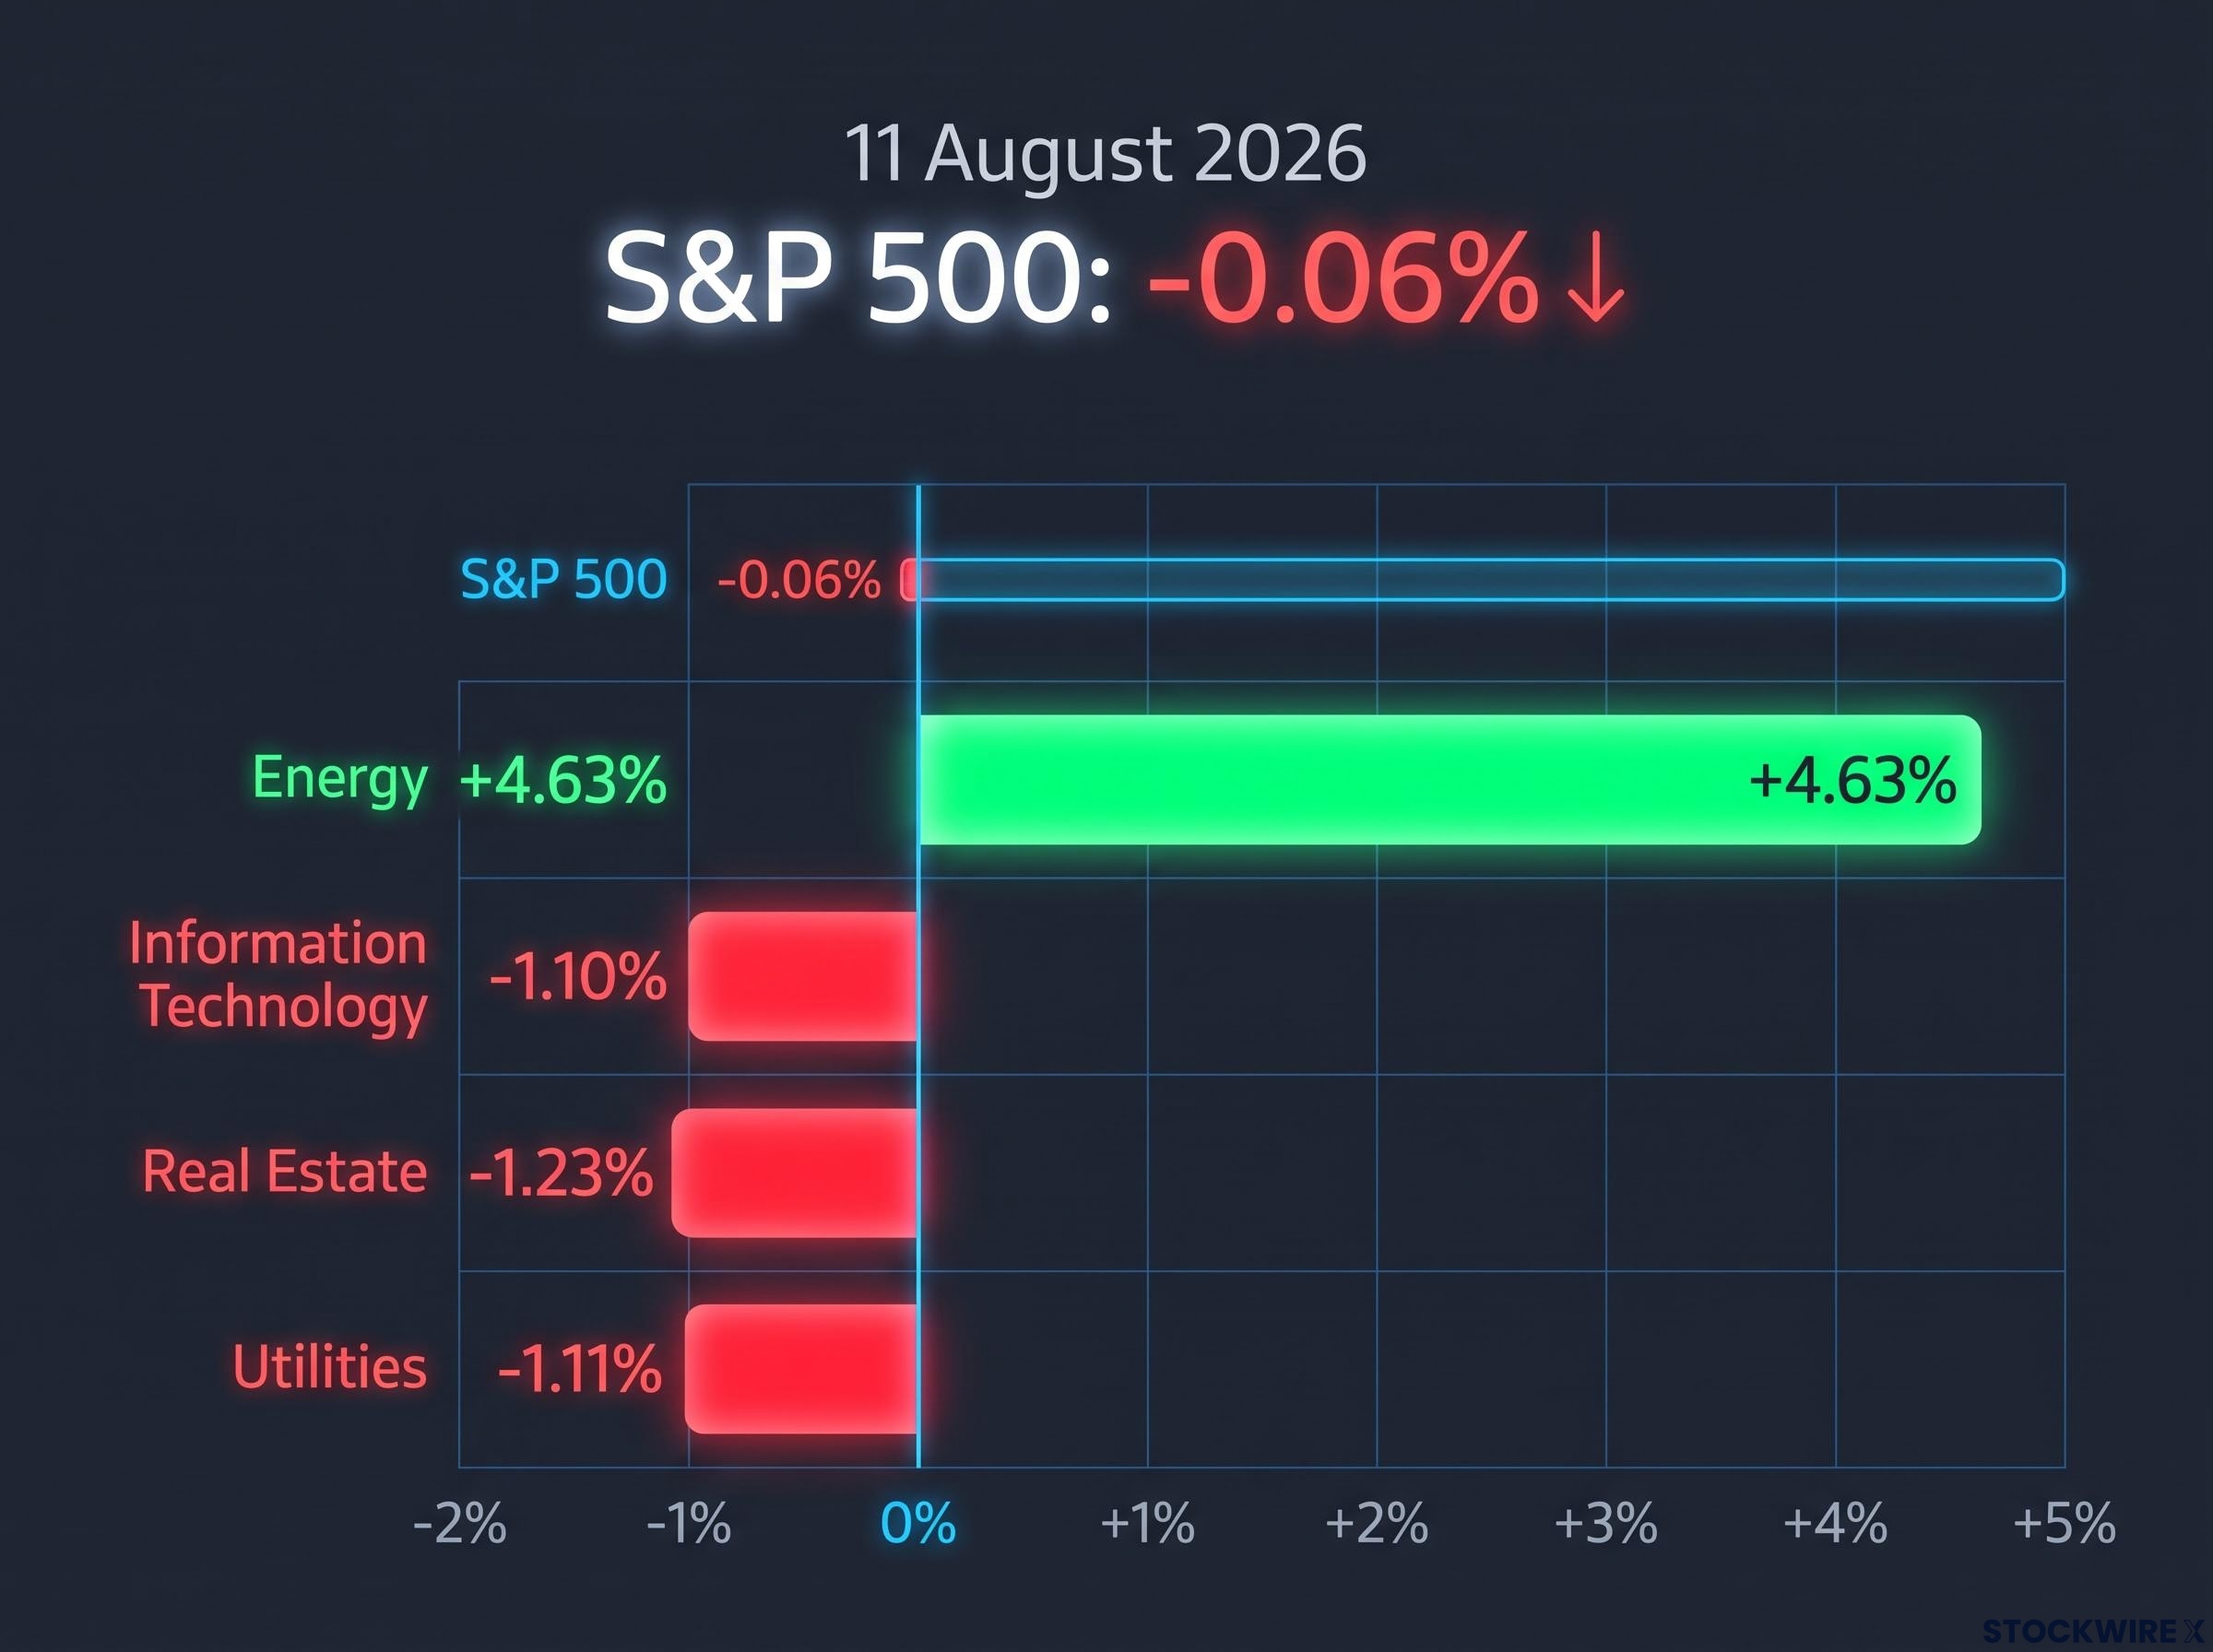
Energy sector: +4.63%, the session’s defining outlier against a flat market.
The number demands explanation. Rising oil prices lifted producer earnings expectations across the sector, and the cost implications rippled outward. Higher energy costs feed directly into inflation expectations, which in turn push bond yields higher, which in turn punish the rate-sensitive parts of the market. One sector’s gain becomes another sector’s loss, and Tuesday made that chain visible in a single session.
The performance breakdown across sectors was stark:
- Energy: up 4.63%, the session’s top performer
- Information Technology: down 1.10%
- Real Estate: down 1.23%
- Utilities: down 1.11%
A portfolio with zero energy exposure meaningfully underperformed even a flat market on Tuesday. That is not a one-off curiosity. Commodities and value sectors historically outperform when inflation and rates are sticky, and this session is a concrete illustration of why sector allocation, not just stock selection, is the primary performance driver in this environment.
Tuesday’s session fits a pattern that has been visible across 2026: institutional capital rotation out of stretched mega-cap technology and into energy, industrials, and traditional-economy sectors has made sector selection, not broad index exposure, the dominant performance driver of the year.
Why rising bond yields are putting pressure on the market’s most expensive corners
The 10-year Treasury yield climbed 5 basis points to settle at 4.70%, putting it within striking distance of a fresh 20-month high. The VIX rose 3.76% to 15.46.
That yield move is not abstract. Here is the mechanism in plain terms. Long-duration assets, meaning investments where most of the value lies in cash flows expected years or decades from now, are worth less today when the rate used to discount those future cash flows rises. A higher discount rate mathematically reduces the present value of distant earnings. That is not opinion; it is arithmetic.
Tuesday’s sector damage confirmed the mechanism in real time. The three categories of holdings that carry the most duration sensitivity all fell while yields climbed.
Which holdings face the most yield headwind right now
- High-P/E growth stocks. Their valuations embed years of future earnings growth. A higher discount rate compresses what investors are willing to pay today for that growth.
- REITs (Real Estate Investment Trusts). These use significant leverage, so higher borrowing costs squeeze margins. Rising yields also compress capitalisation rates, reducing property valuations.
- Utilities. These trade as bond proxies, meaning investors own them for steady income. When actual bond yields rise, utilities become relatively less attractive.
At 4.70% and approaching a 20-month high, the 10-year yield is telling you that the cost of carrying high-multiple, long-duration positions is rising. If you hold significant exposure to premium-priced tech, REITs, or utilities, Tuesday’s session is a live stress test of whether that exposure is sized for this environment.
Record debt issuance from tech giants and what it means for equity investors
Tuesday saw the US investment-grade bond market host more issuers in a single day than at any point since January 2026.
The mega-cap technology firms were prominent participants, and the scale of their borrowing programmes is worth sitting with.
The investment-grade bond market’s busiest single day since January 2026 sits inside a larger structural shift: AI bond market issuance has already surpassed twice the full-year 2025 hyperscaler total, with Goldman Sachs estimating close to $500 billion in AI-related debt in 2026 alone, a volume that is visibly distorting spreads on highly rated paper.
| Company | IG Bond Index Rank | Outstanding Debt | Capital Deployment Focus |
|---|---|---|---|
| Amazon | 5th largest | ~US$120 billion | Data centres, AI infrastructure, logistics |
| Oracle | 6th largest | ~US$115 billion | Cloud capacity, AI infrastructure |
This is not financial distress. Management teams are borrowing at current rates to fund multi-year infrastructure investments, signalling confidence that the return on deployed capital will exceed the cost of borrowing. The capital is going toward data centres, AI infrastructure, cloud capacity, and logistics, the structural buildout of the next decade’s competitive moats.
The short-term equity implications are real: heavy issuance can create modest price pressure and nudge overall yields higher. But the longer-term question for equity investors is whether the return on that capital will justify the leverage over a 3-5 year horizon. When Amazon and Oracle are simultaneously among the largest debt issuers in the world and deploying that capital into AI and infrastructure at this scale, that is the question worth tracking.
What historically extreme options sentiment tells you about this market’s next move
S&P 500 options positioning swung to historically bullish extremes on Tuesday. The market’s appetite for downside protection on the S&P 500 retreated to its weakest level since April 2025.
Hedging demand for S&P 500 downside exposure dropped to a level last seen in April 2025, marking the most complacent positioning in more than fifteen months.
That is a yellow flag, not a red one. The mechanism is worth understanding: positioning driven by fear of missing out has left the market broadly exposed, and when sentiment is this one-sided, any shock tends to produce sharper corrections because there is little protective cushion already in place. Meanwhile, on the prior Friday, retail investors became net sellers of SpaceX shares for the first time since the company listed in June 2026, a modest but potentially telling sign that appetite for high-beta, story-driven names is beginning to soften.
The practical response is not to sell everything, but to act while protection is still cheap. The VIX at 15.46 is still at a contained level historically, which means hedging costs less right now than it will after a selloff begins.
- Review position sizes in crowded trades, particularly mega-cap tech and popular AI beneficiaries
- Consider basic hedging via index puts or collars at current VIX levels, while volatility remains subdued
- Ensure diversification across uncorrelated assets so a single sentiment reversal does not hit every position simultaneously
The valuation gap between US and emerging market equities is now at a generational extreme
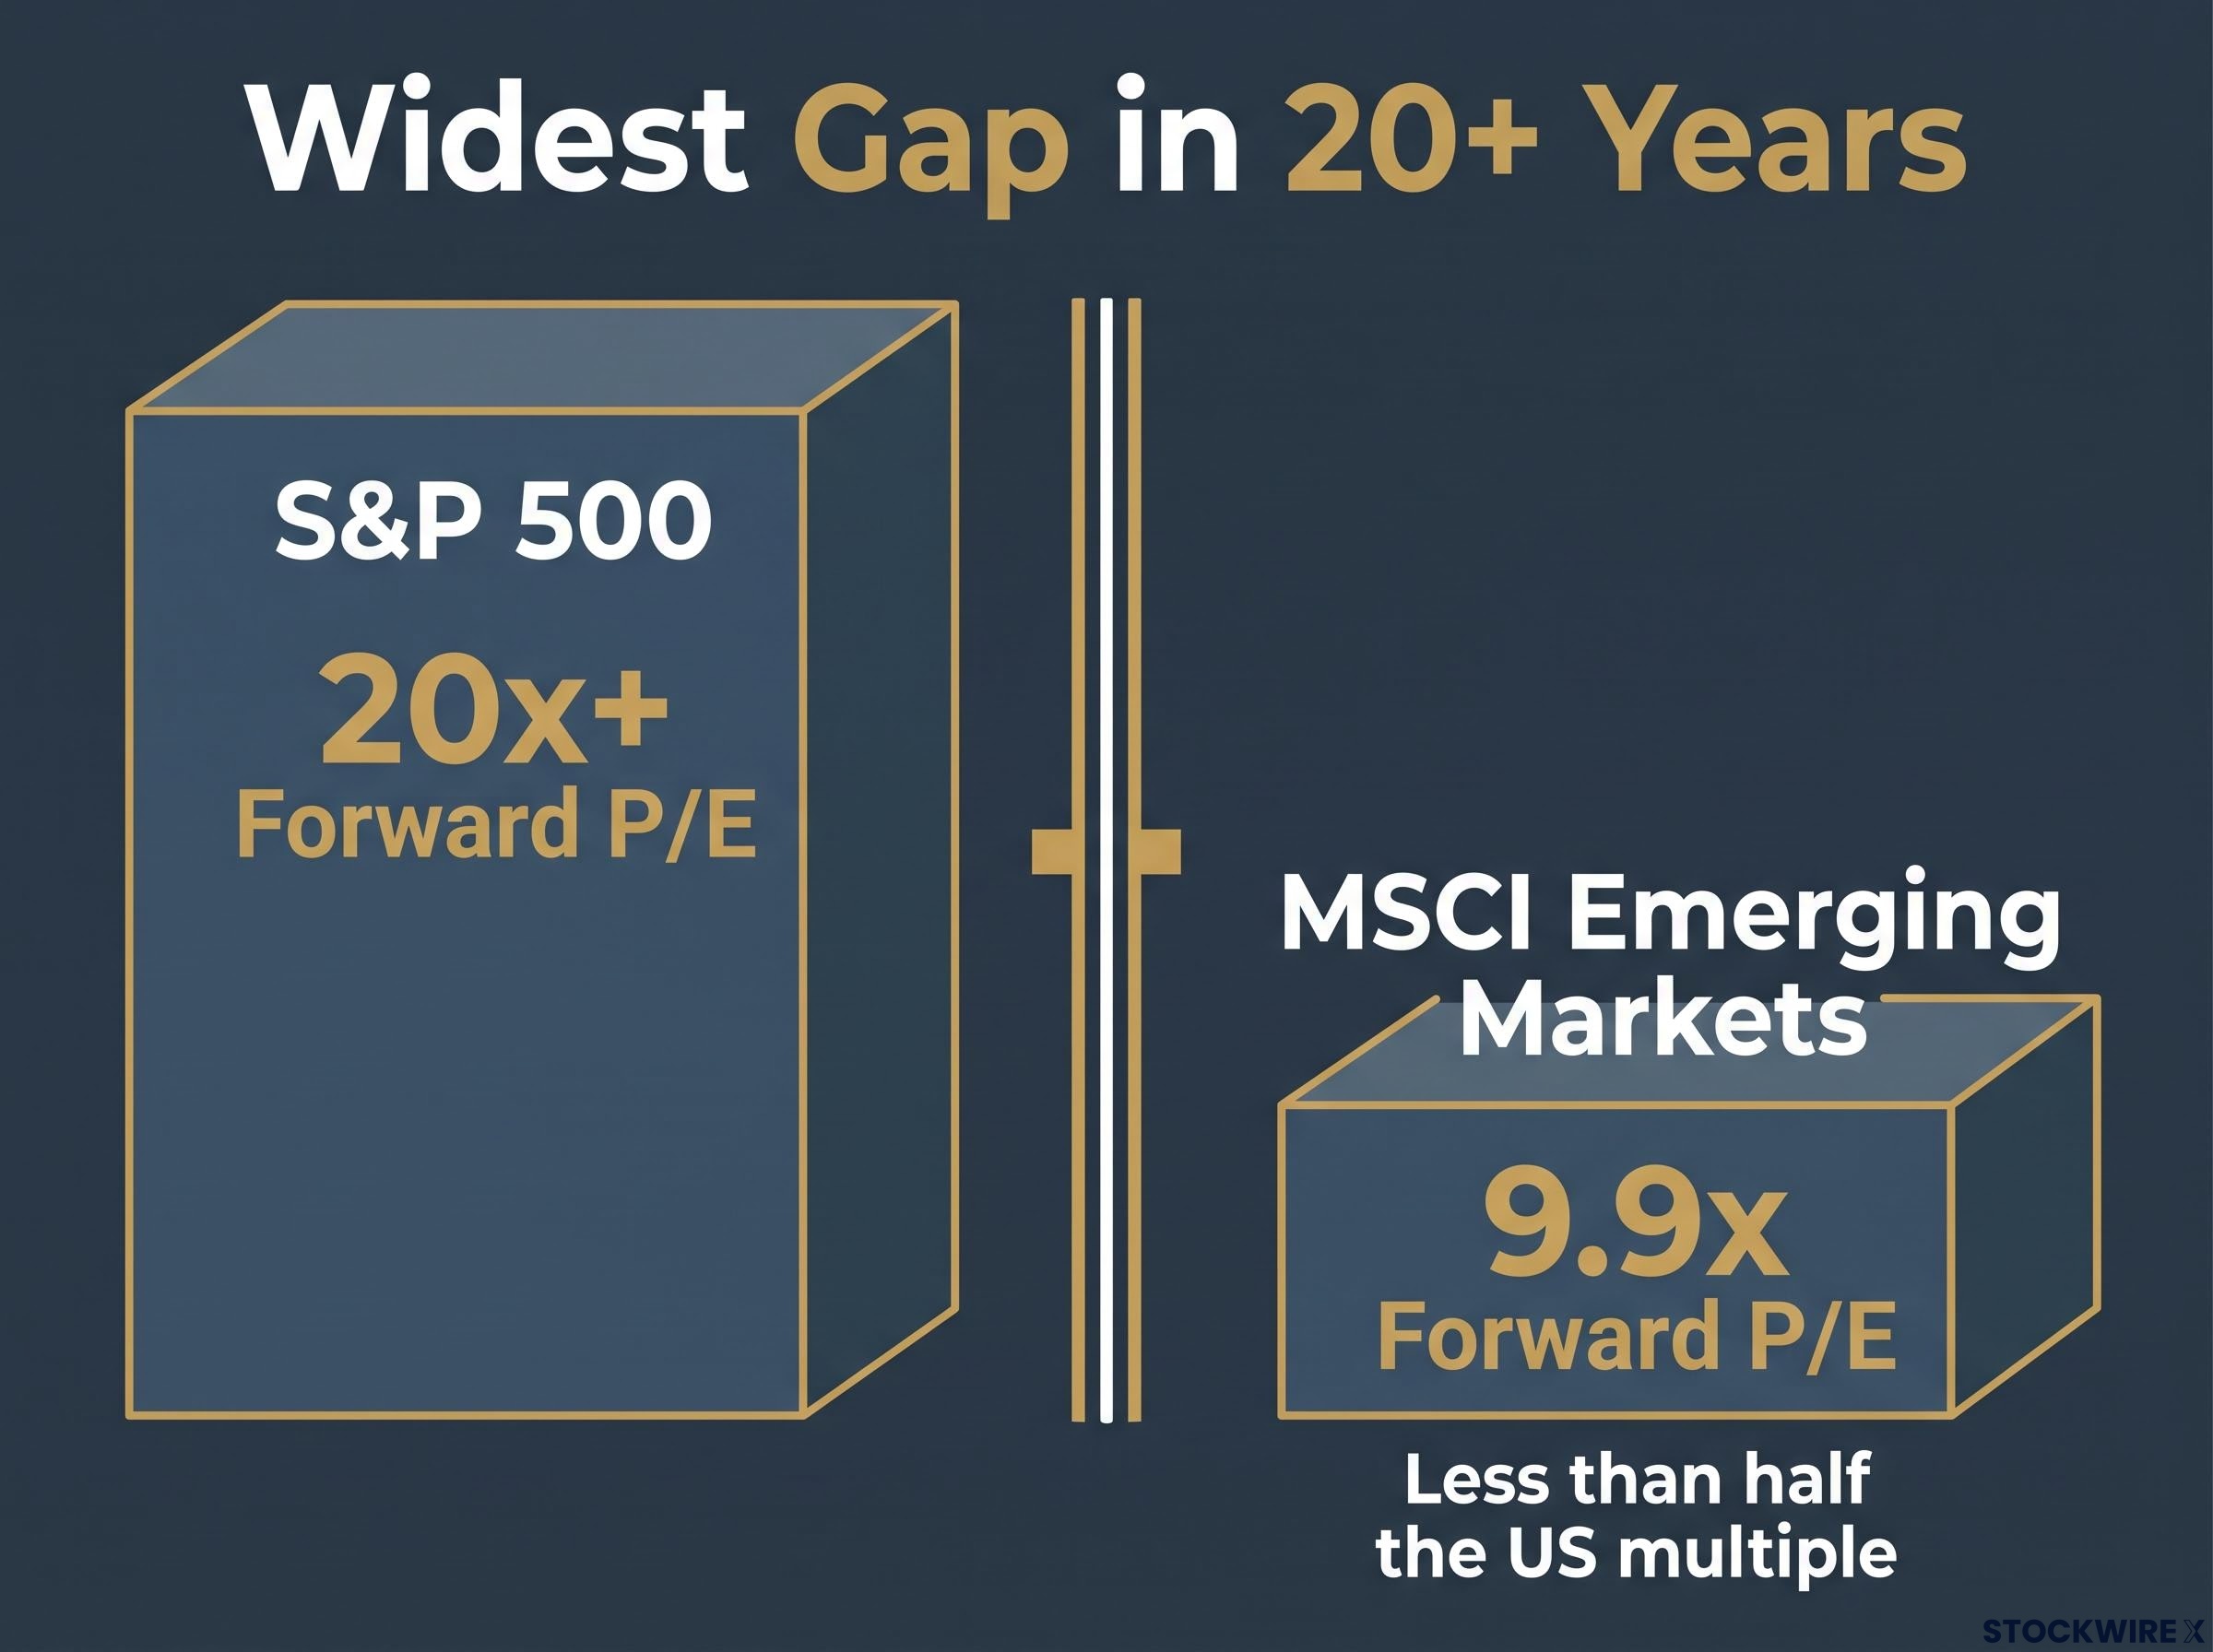
The MSCI Emerging Markets index carries a forward earnings multiple of 9.9x. The S&P 500 sits at more than 20x forward earnings. With emerging markets priced at below half the US multiple, the spread between the two has reached its widest point in at least twenty years.
The valuation gap the article identifies is backed by a return story that has already begun: emerging market outperformance of 38% in the 12 months to end May 2026 against 16% for the S&P 500 reflects four structural forces Morningstar attributes to identifiable macro shifts rather than momentum, including the first confirmed dollar downcycle since the early 2000s.
| Index | Forward P/E | Historical Context |
|---|---|---|
| S&P 500 | 20x+ | Near the upper end of its historical range |
| MSCI Emerging Markets | 9.9x | Less than half the US multiple; widest gap in 20+ years |
The MSCI Emerging Markets forward multiple has dropped to below half that of the S&P 500, a valuation discount without precedent in the past two decades.
This is a structural signal, not a trading call. Gaps of this magnitude have historically preceded stronger long-term returns from cheaper markets over 5-10 year horizons. That does not tell you when emerging markets will outperform, only that historical patterns suggest better risk-adjusted returns from cheaper entry points at extremes like this.
The risks of emerging market exposure are genuine: currency volatility, governance concerns, and geopolitical uncertainty. But owning US equities at more than twice the forward multiple of global emerging markets is a deliberate, concentrated bet on US exceptionalism continuing indefinitely. If you have arrived at that position by default rather than by conscious choice, Tuesday’s data is a useful prompt to make it an intentional one.
Five questions Tuesday’s session is asking every investor right now
A session that looks boring at the headline level but contains this many distinct signals is telling you the market is shifting. The easy phase, where everything rises together, is showing signs of fatigue. The next leg of returns is likely to depend on where you are invested, not just whether you are invested.
These five questions, each tied to a specific signal from Tuesday, form a practical audit framework:
- How rate-sensitive is your portfolio? The 10-year yield closed at 4.70%, within reach of a 20-month high, and is actively repricing long-duration holdings. Know which positions carry the most yield headwind.
- How concentrated are your sector bets? Energy outperformed the broad market by nearly 5 percentage points in a single session. If your allocation carries zero exposure to the sectors that benefit from sticky inflation, that gap compounds.
- What are your largest tech holdings doing with debt? The investment-grade bond market just recorded its busiest single day for issuers since January, with mega-cap tech firms prominent among them. The equity investor’s job is to track whether the return on that capital justifies the leverage over a multi-year horizon.
- Are you hedged at all? Demand for downside protection has collapsed to its weakest reading since April 2025. The VIX at 15.46 means protection is still affordable. It will not stay that way once a correction begins.
- Is your geographic allocation intentional? With the MSCI EM forward multiple at 9.9x and the S&P 500 commanding more than 20x, the valuation chasm between the two is the widest it has been in a generation. Owning that concentration should be a deliberate decision, not a default.
Six distinct investable signals in a single flat session. The market is not asleep. It is rotating, repricing, and asking whether your portfolio is positioned for what comes next.
This article is for informational purposes only and should not be considered financial advice. Investors should conduct their own research and consult with financial professionals before making investment decisions. Past performance does not guarantee future results. Financial projections are subject to market conditions and various risk factors.