The Federal Reserve did exactly what everyone expected today. Futures markets had priced in the quarter-point hike at 92.5% odds, meaning the decision surprised almost no one. And yet the Dow Jones Industrial Average is down roughly 450 points, sitting near 52,000.
If a rate hike was already baked into every price on the board, why is the market still bleeding?
The answer is not the Fed. It is the 10-year Treasury yield, which breached 5% on 15 September 2026 for the first time since October 2023. Most readers conflate this yield with the Fed’s rate decision, treating them as the same lever. They are not. They are two separate instruments responding to two separate sets of forces, and the gap between them explains almost every confusing market headline you are about to read.
Here is what matters. After this, you will be able to separate the Fed’s rate signal from the pressure coming off the long end of the yield curve, and you will understand why that distinction is the single most important thing shaping the 28 non-bank companies inside the Dow right now.
The Fed raised rates, so why is the Dow falling anyway?
The instinct is understandable. The Fed raises rates, borrowing gets more expensive, stocks fall. It is the mental model most people carry into every rate decision.
The problem is that this hike was never a surprise.
Futures markets assigned a 92.5% probability to the quarter-point increase before the Fed acted. When a decision is that widely expected, it is already reflected in prices well before it happens.
A fully priced-in event produces no fresh selling pressure. The market had already adjusted. So when the Dow shed 450 points to trade near 52,000, the hike itself cannot be the culprit. Something else moved.
That something is the difference between two rates the reader tends to blur together. The federal funds rate is the overnight lending rate the Fed directly controls. The 10-year Treasury yield is set by the open market, by millions of buyers and sellers deciding what they will accept to lend the US government money for a decade. The Fed does not set it. The market does.
Market-driven tightening, where rising long yields effectively substitute for Fed hikes by compressing borrowing capacity across the economy, is precisely what Fed Chair Kevin Warsh acknowledged at Jackson Hole on 28 August 2026, confirming that the bond market had already tightened conditions without a single FOMC vote.
On 15 September 2026, that market-set yield pushed through 5.01%, its highest reading since October 2023. That is the number driving the Dow lower, not the Fed’s announcement.
Technical momentum confirms the selling has room to run. The daily Stochastic RSI, a momentum gauge that flags whether a move is overextended, was reading near 36 and trending down, which points to continued pressure rather than a bottom.
For the Dow, the near-term battle lines look like this:
- Resistance: 52,400 (session high), 52,700 (the 50-day moving average), and 53,000 (last traded on 8 September)
- Support: 51,900 (session low), 51,500 (the late-July base), and 51,000 (the next round number below)
The takeaway reframes how you should read every headline that pairs “Fed hikes” with “stocks fall.” The Fed hike was a non-event. The real story sits entirely at the long end of the curve, and that is the variable to track.
When big ASX news breaks, our subscribers know first
How the 10-year yield works, and why 5% is a threshold that changes behaviour
Start with what the 10-year yield actually is. It is the market’s own verdict on the cost of long-term borrowing, set by the supply of government bonds and the demand to hold them. When more investors want Treasuries, prices rise and yields fall. When they demand more compensation to hold that debt, yields climb. None of this waits on a Fed meeting.
The price-yield relationship at the heart of bond yield mechanics is purely mathematical: because coupon payments are fixed at issuance, any rise in what investors demand to hold that debt compresses the bond’s price and lifts its yield, no central bank vote required.
Why does that yield matter so much to companies that have nothing to do with the bond market? Three transmission channels connect the two.
| Transmission channel | Mechanism | Effect on Dow component |
|---|---|---|
| Discount rate compression | Higher yields raise the rate used to value future earnings in cash-flow models, shrinking their present value | Share valuations fall even if the business itself is unchanged |
| Cost of capital | Interest expense rises on existing and new debt | Lower net income and scaled-back investment plans |
| Portfolio rotation | Bond yields near 5% become competitive with equity returns | Investors sell stocks to buy safer government debt |
So why is 5% the number that triggers this rather than 4% or 6%? Because the behaviour shifts are documented, not imagined. A 100-basis-point rise in real Treasury yields is associated with roughly a 7% decline in the S&P 500’s forward price-to-earnings multiple, the standard measure of how much investors will pay for a dollar of expected earnings. And market surveys show about 30% of respondents expect 10-year yields in the 5% to 5.25% range to trigger a 10% drop in stocks from their peak.
That is what makes 5% a genuine trigger rather than a round number. It is the level where investor calculus flips from “equities beat bonds” to “bonds are competitive enough to rotate into.” The selling that follows is structural, driven by cold return maths, not by panic.
The speed of the move matters as much as the level
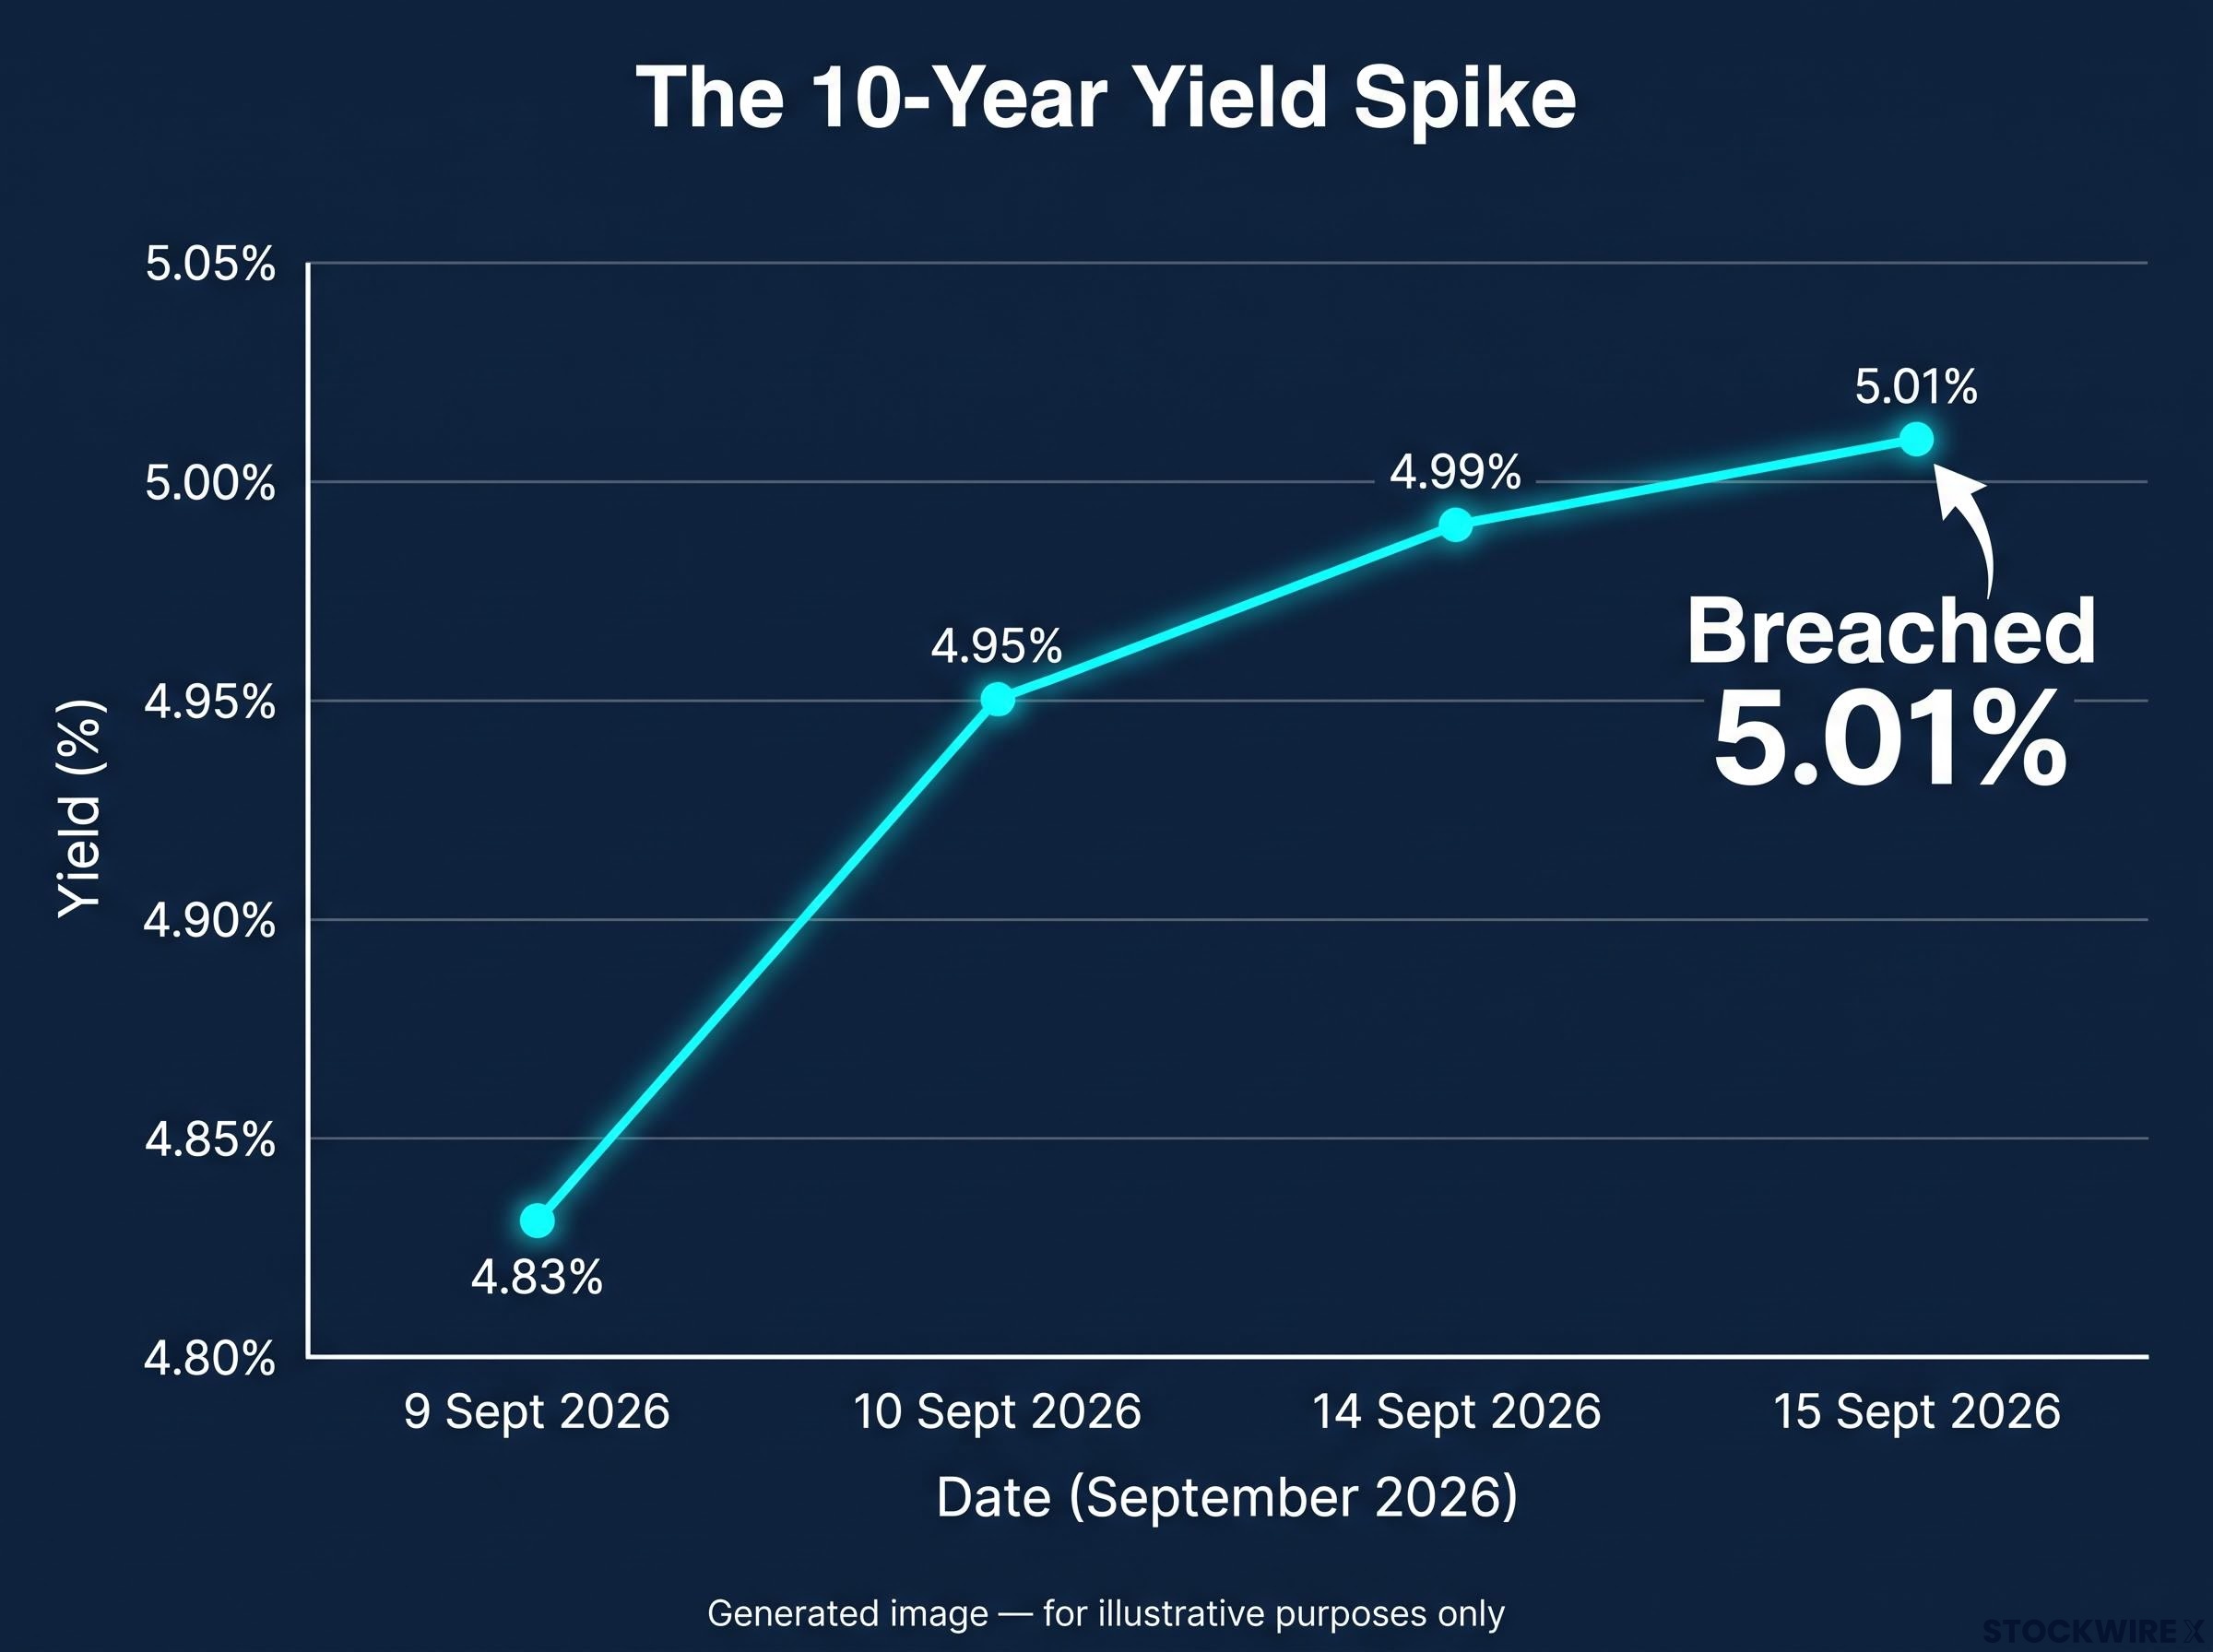
The yield did not drift toward 5%. It climbed for five straight sessions, gaining nearly a third of a percentage point over four weeks.
- 9 September 2026: 4.83%
- 10 September 2026: 4.95%
- 14 September 2026: 4.99%
- 15 September 2026: breached 5.01%
That pace gives portfolios little time to adjust, which sharpens the rotation pressure. Understanding this mechanism gives you a durable framework: any future yield spike compresses valuations the same way, and now you know exactly which channel is doing the damage.
Why the Dow’s own structure makes it more exposed than other indexes
The external yield pressure is only half the story. The other half is the Dow’s own architecture, and it creates a vulnerability most readers never think about.
The Dow is price-weighted. That means a stock’s influence on the index comes from its share price, not the size of the company. A $400 stock moves the Dow more than a $100 stock even if the smaller-priced company is worth ten times as much. This is unique to the Dow. The S&P 500 and Nasdaq weight by market capitalisation, the total value of a company, which is a very different thing.
The Dow’s price-weighting structure means a single high-priced component like Caterpillar can move the entire index by more than a broad economic shift affecting every other name, a quirk that makes the Dow a very different risk instrument than the cap-weighted S&P 500 or Nasdaq.
That structure produces a split inside the index based on which rate each component actually cares about.
| Component category | Yield sensitivity profile |
|---|---|
| Bank stocks (JPMorgan, Goldman Sachs), approx. one-sixth of weight | Sensitive to short-term overnight rates; may benefit from a steeper yield curve |
| Industrial and consumer components (28 companies) | Sensitive to long-term yields through customer mortgage, financing and credit costs |
| Caterpillar, approx. one-tenth of weight | Long-term yield plus manufacturing demand sensitivity combined |
| Chevron | Energy producer; benefits from elevated oil prices rather than absorbing them |
Roughly one-sixth of the Dow’s weight sits in banks like JPMorgan and Goldman Sachs, whose fortunes turn on short-term overnight rates and who can actually gain from a steeper curve. The other 28 components feel the long end, because the 10-year yield sets what their customers pay for mortgages, factory financing and credit cards.
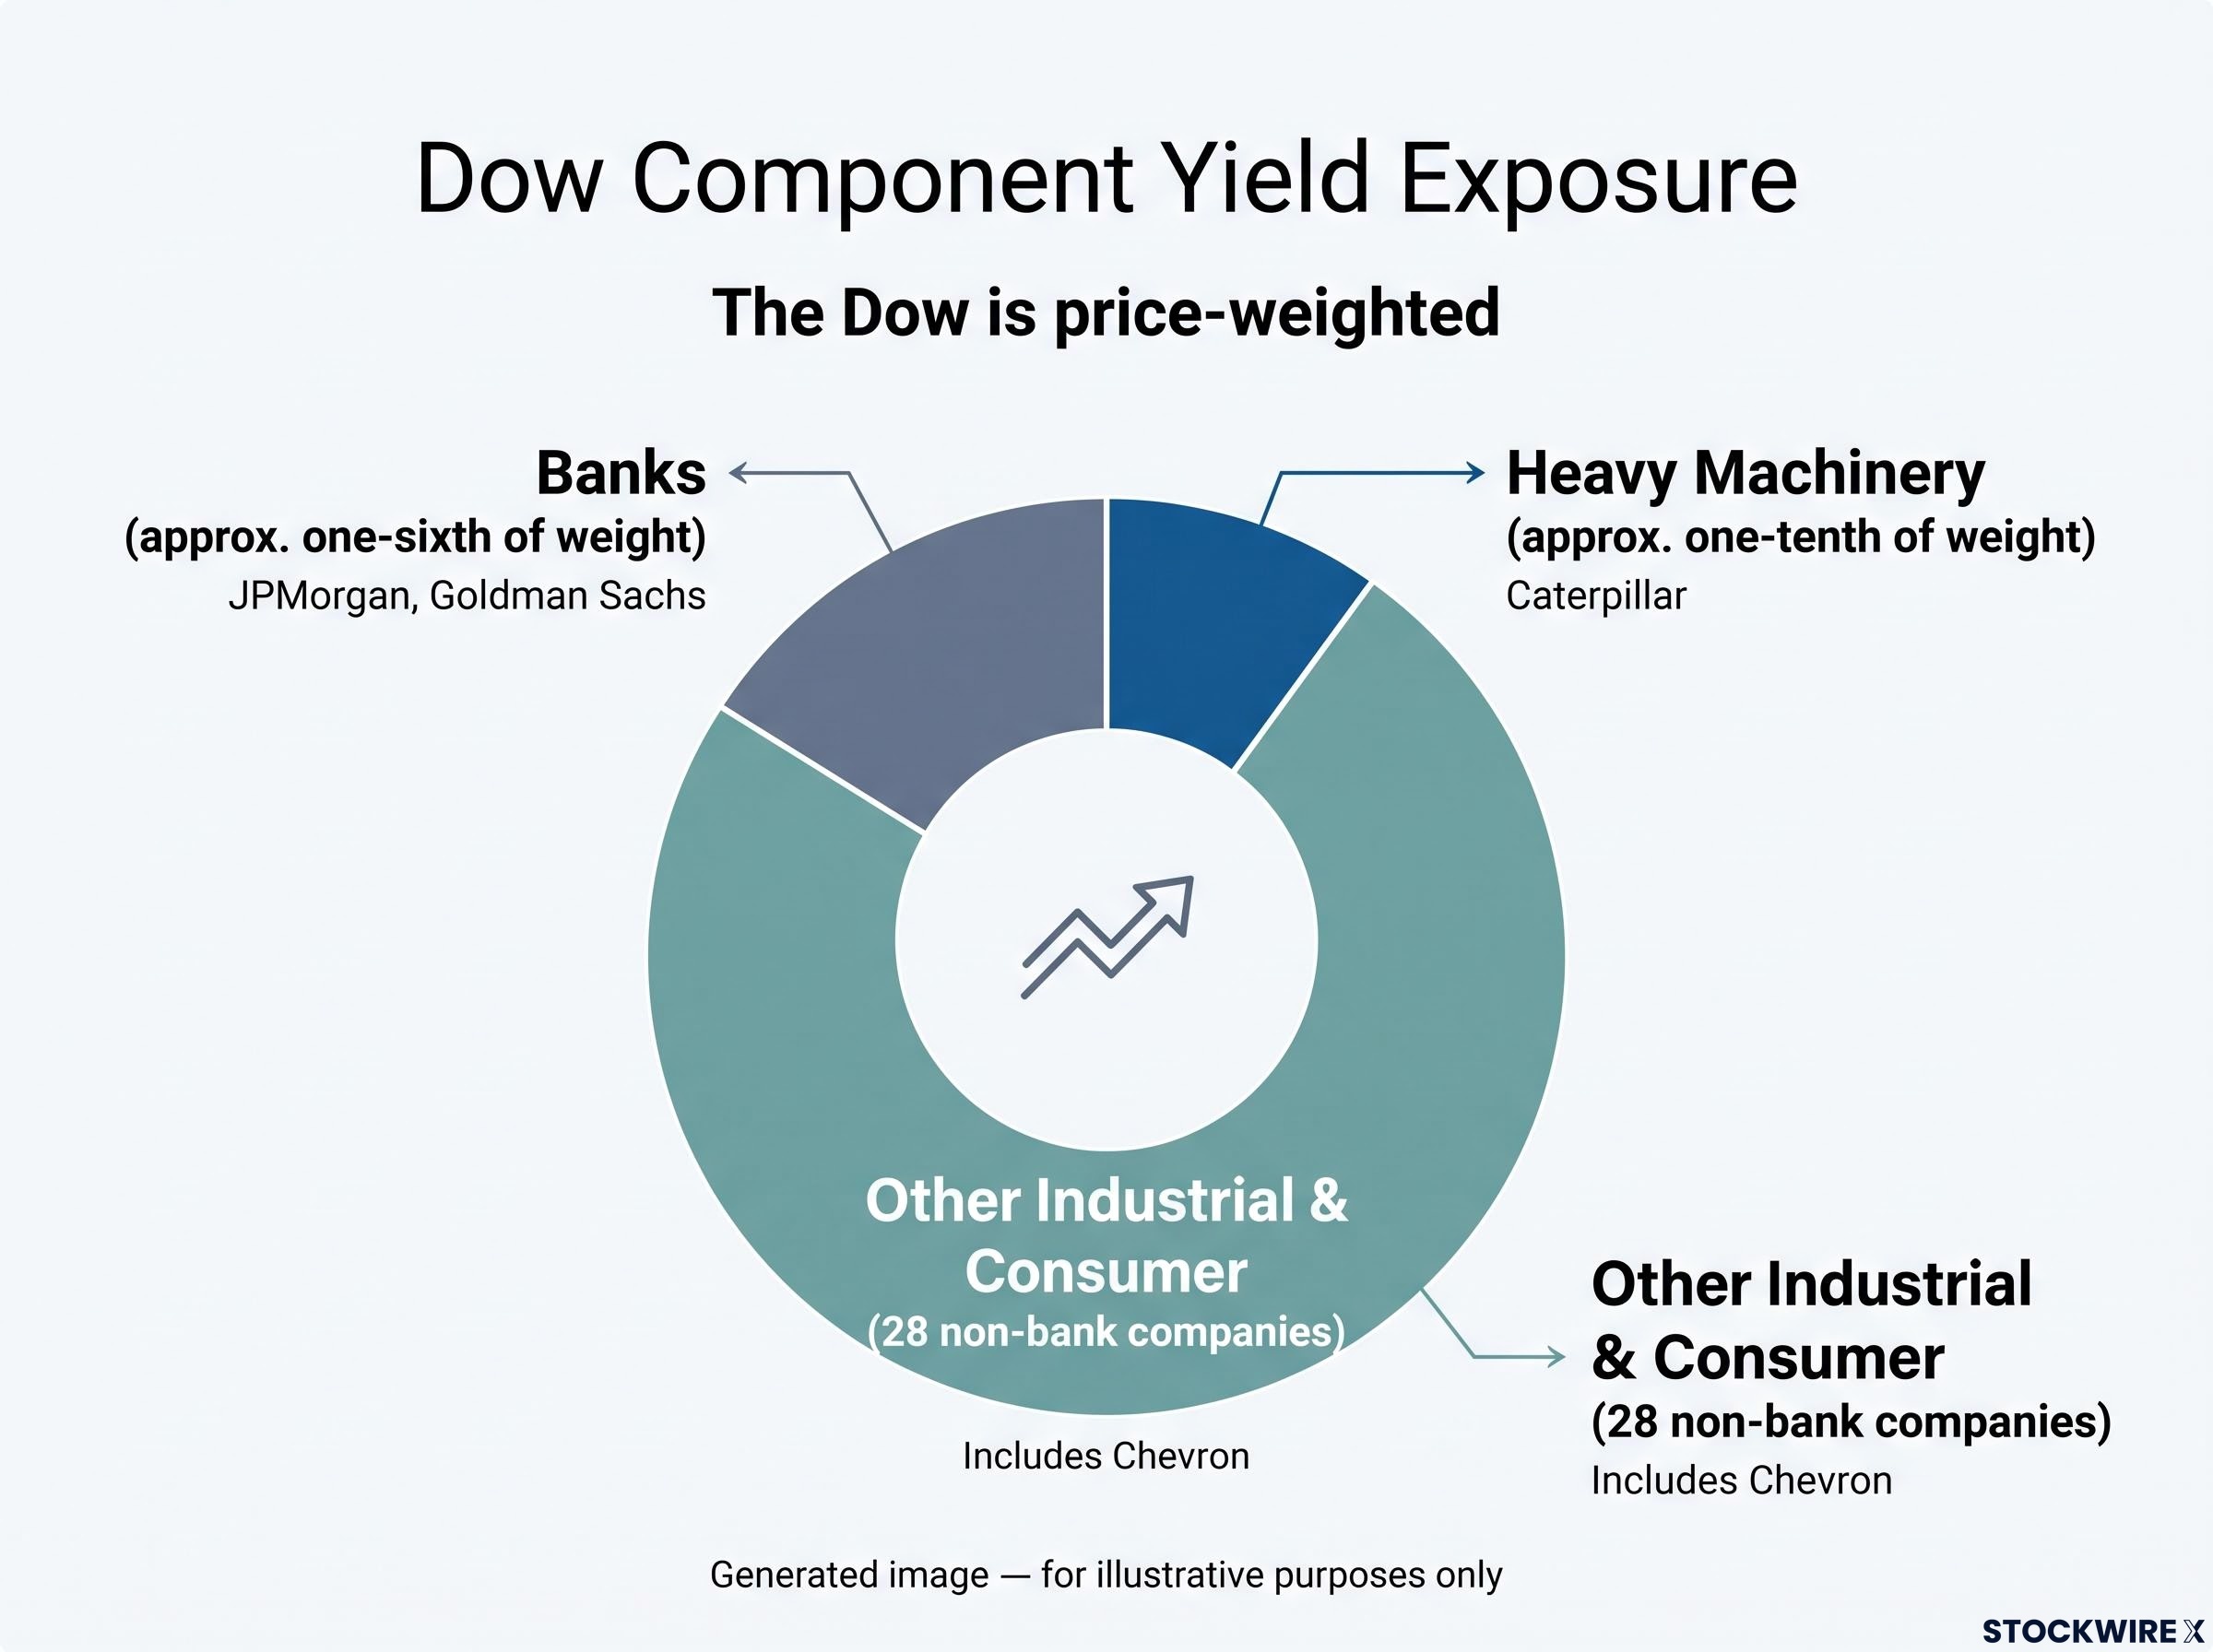
Caterpillar alone carries roughly one-tenth of the Dow’s price weight. When the maker of capital-intensive machinery moves, the entire index feels it.
That concentration matters because Caterpillar sells into the exact manufacturing and financing environment that higher yields squeeze hardest. Its customers borrow to buy heavy equipment, and those borrowing costs are climbing.
Chevron stands almost alone as a beneficiary. With WTI crude near $104.00 and Brent near $108.00, elevated oil is a revenue tailwind for the sole energy producer in the index. For nearly every other component, that same oil price is a cost burden.
The implication is direct. On a per-component basis, the Dow is more exposed to long-yield stress than the S&P 500 or the Nasdaq. If you track “the market” through the Dow, you are tracking an instrument that amplifies exactly the pressure now in play.
Three compounding forces that explain why the yield spike is happening now
A single cause would be easy to wait out. What makes this yield surge stubborn is that three separate forces are pushing in the same direction at once.
- The buyback backfire. The Treasury tried to pull yields down and appears to have done the opposite.
- A structural supply and ownership shift. Who holds US debt has changed, and the new holders demand more.
- Weakening factories and rising energy costs. The industrial backdrop is softening while inflation inputs climb.
The buyback backfire
The US Treasury launched buyback operations to reduce the supply of long-dated bonds, support their prices and drag yields lower. On 19 August 2026 it announced it would at least double the maximum size of these operations from $2 billion to $4 billion. Treasury Secretary Scott Bessent framed the goal as easing pressure at the long end.
The Treasury buyback expansion announcement confirmed the decision to at least double maximum operation sizes for longer-dated nominal coupon securities, framing the programme as a liquidity support measure, though the market’s subsequent reaction suggested investors read the escalation as a sign of difficulty rather than control.
The market read it differently. On 9 September 2026, when a scheduled operation was raised to a $6 billion maximum, the 10-year yield climbed to 4.85% and the Dow shed roughly 400 points.
On 10 September 2026, the Treasury accepted just $5.19 billion of the $10.49 billion in bonds tendered, declining to match the prices holders offered.
Investors interpreted that partial acceptance as a sign of dysfunction rather than support. A programme meant to reassure the market instead signalled how difficult the long end has become to control.
Supply, issuance, and who now holds the debt
The second force is slower moving and harder to reverse. Heavy Treasury issuance, driven by government deficits, keeps adding duration supply to the market. At the same time, ownership has shifted.
According to the July 2026 Monetary Policy Report and recent FOMC minutes, Treasury holdings have moved away from price-insensitive official-sector buyers toward more price-sensitive private investors. Those private holders demand higher compensation, which the research attributes to a structural rise of 20 to 60 basis points in yields since the spring.
This matters because it is independent of any single Fed decision. Even a Fed pause would not undo it.
Manufacturing surveys and energy costs
The third force hits the Dow’s industrial core directly. The New York Fed Empire State Manufacturing Survey fell to 7.6, well short of the 14.75 consensus. The Philadelphia Fed survey is projected to drop from 47.4 to 30.5, a sharp reversal in factory sentiment that pressures components like Caterpillar and 3M.
Energy compounds it. WTI near $104.00 and Brent near $108.00, driven partly by a Saudi pipeline disruption expected to take more than a month to repair, act as a cost headwind for nearly every Dow component except Chevron. Those fuel costs helped push CPI to 3.4% year-over-year in August.
Read together, these forces tell you the Treasury itself has limited power to engineer yield relief in this supply environment. The path to lower long yields runs through deficit reduction or a convincing inflation downtrend, and neither is imminent.
What stabilises this, and what the October 2023 parallel suggests
None of this means the pressure lasts forever. It has a recognisable shape, and the most useful reference point is recent.
In October and November 2023, the 10-year yield made the same approach toward 5%, equities came under similar strain, and the episode resolved. Notably, it resolved not through a Fed rate cut but through easing term premiums, the extra yield investors demand for holding long-dated debt. That precedent gives the current situation a template, even if the timing is anyone’s guess.
What would need to move for the pressure to ease? The research points to a handful of specific variables.
| Stabilisation variable | What to watch for |
|---|---|
| Inflation trend | CPI heading down from 3.4% toward the Fed’s 2% target |
| Fiscal deficit | A reduction in net Treasury issuance |
| Investor base | A return of price-insensitive official-sector buyers |
| Fed stance | A shift toward cautious hold language that lets term premiums normalise |
There is also a resilience case worth holding in mind:
- Despite an approximately 80-basis-point yield rise earlier in 2026, the S&P 500 remained up more than 11% year-to-date, showing earnings and economic strength can partly offset valuation compression at the index level.
- The 2023 episode confirms markets have absorbed a run at 5% before, provided the right catalyst arrives.
A word of caution first. In a July 2026 episode, long-term rates jumped on the very day the Fed left short-term rates unchanged, with the 30-year yield reaching 5.22%. That is a clean illustration of how far yield and Fed policy can diverge.
The lesson from 2023 is that this is resolvable, but the trigger was term premium normalisation, not a rate cut. That recalibrates what you should watch for as the signal that pressure is lifting.
Reading the Dow in a long-yield environment
Everything above collapses into one distinction worth carrying forward. The Fed rate and the 10-year Treasury yield are two separate instruments, and for 28 of the Dow’s 30 components, the long yield is the dominant force shaping real business conditions through what their customers pay to borrow.
That reframes how you read a falling Dow. When the index drops against a rising 10-year yield, currently sitting at 5.01%, that is a structurally coherent outcome, not a market overreaction. Telling the difference between a yield-driven selloff and a growth-driven one changes the quality of every decision you make from here.
So track the right variables rather than the loudest headlines:
- The daily 10-year yield print, your primary reference point
- The next regional manufacturing surveys from New York and Philadelphia
- The outcome of the 16 September 2026 TIPS buyback operation, and whether the Treasury accepts or declines the bonds offered
Follow those three, and you will have a materially more accurate picture of what is moving the market than a reader watching only the Fed.
For readers wanting to understand which specific instruments absorb the most damage when the 10-year yield sits at 5%, our dedicated guide to rate-sensitive assets at 5% yields covers TLT, IEF, LQD, and XLU performance alongside the institutional barbell strategy used to navigate the structural-versus-cyclical debate.
This article is for informational purposes only and should not be considered financial advice. Investors should conduct their own research and consult with financial professionals before making investment decisions.
Past performance does not guarantee future results. Financial projections are subject to market conditions and various risk factors, and forward-looking scenarios described here are speculative and subject to change.