
How Dual-Class Shares Put $24 Billion in Gulf Capital at Arm’s Length
22 hrs ago

VXUS holds more than 8,000 securities spanning dozens of countries, yet its three largest positions are all semiconductor companies. That single fact tells almost everything an investor needs to know about what the global equity market outside the United States actually looks like in April 2026.
With U.S. equity valuations near dot-com-era highs and the U.S. dollar weakening against major currencies, the question of international diversification has moved from theoretical to urgent for many U.S. investors. VXUS, the Vanguard Total International Stock ETF, is the single most commonly used instrument for that purpose, with $142.8 billion in assets under management. This article explains exactly what VXUS holds, how it is structured by geography and sector, how it has performed, how its costs compare to its closest peers, how currency movements affect returns, and what risks an investor accepts by owning it.
U.S. equity valuations near dot-com-era highs are not a loose characterisation; the S&P 500 currently sits at the 90.5th percentile of modern-era valuation history, with three independent asset managers projecting annualised returns of just 0-5% for U.S. large-caps over the next decade compared to 4-8% real returns for international developed and emerging markets.
VXUS tracks the FTSE Global All Cap ex US Index, providing equity exposure across both developed and emerging markets outside the United States in a single vehicle. Launched on 26 January 2011, the fund has grown into one of the largest international equity ETFs available, and its cost structure is a significant part of why.
The expense ratio stands at 0.05% as of 27 February 2026. On a $100,000 position, that translates to $50 per year in management fees. The fund pays dividends quarterly, with the most recent distribution of $0.0795 per share (ex-date 20 March 2026) and a trailing 12-month yield of approximately 2.77%.
One structural feature deserves attention early: VXUS is unhedged. It retains full foreign currency exposure, meaning U.S. investors receive the raw international equity return plus or minus currency movement against the dollar. That design choice has material consequences, explored in detail below.
Key structural features at a glance:
A fund designed to capture the entire non-U.S. equity market might be expected to lead with banks, energy producers, or consumer conglomerates. Instead, the top three positions are Taiwan Semiconductor Manufacturing Co. (TSMC) at 3.45%, Samsung Electronics at 1.35%, and ASML Holding at 1.27%.
The reason is straightforward: VXUS is market-cap weighted. The largest companies by market capitalisation outside the United States determine the top of the fund, and the global AI infrastructure investment cycle has pushed semiconductor manufacturers to the front of that queue. A fourth chipmaker, SK Hynix at 0.75%, also sits inside the top 10, reinforcing the pattern.
| Rank | Company | Country/Region | Weight (%) |
|---|---|---|---|
| 1 | TSMC | Taiwan | 3.45% |
| 2 | Samsung Electronics | South Korea | 1.35% |
| 3 | ASML Holding | Netherlands | 1.27% |
| 4 | Tencent Holdings | China | 0.96% |
| 5 | SK Hynix | South Korea | 0.75% |
| 6 | Novartis | Switzerland | 0.72% |
| 7 | AstraZeneca | United Kingdom | 0.72% |
| 8 | HSBC Holdings | United Kingdom | 0.69% |
| 9 | Roche Holding | Switzerland | 0.69% |
| 10 | Alibaba Group | China | 0.69% |
TSMC is the world’s leading contract chip manufacturer, fabricating advanced processors for the majority of global AI hardware customers. The company expanded AI chip production capacity significantly through 2025 and into 2026, though it also faces persistent geopolitical risk tied to Taiwan’s position in U.S.-China tensions.
Samsung Electronics is both a memory and logic semiconductor producer, competing directly with SK Hynix in high-bandwidth memory (HBM), the specialised chips powering AI accelerators. Samsung’s HBM ramp through 2025-2026 positions it at the centre of the AI supply chain, though exposure to Chinese customers introduces U.S. chip export restriction risk.
ASML occupies a unique position as the sole manufacturer of extreme ultraviolet (EUV) lithography machines, the equipment required to produce the most advanced chips in the world. ASML raised its 2026 revenue forecast to €36-40 billion citing surging EUV demand, and its stock rose approximately 40% year-to-date as of April 2026.
The semiconductor names at the top of the fund create a technology-heavy first impression. The full picture looks quite different.
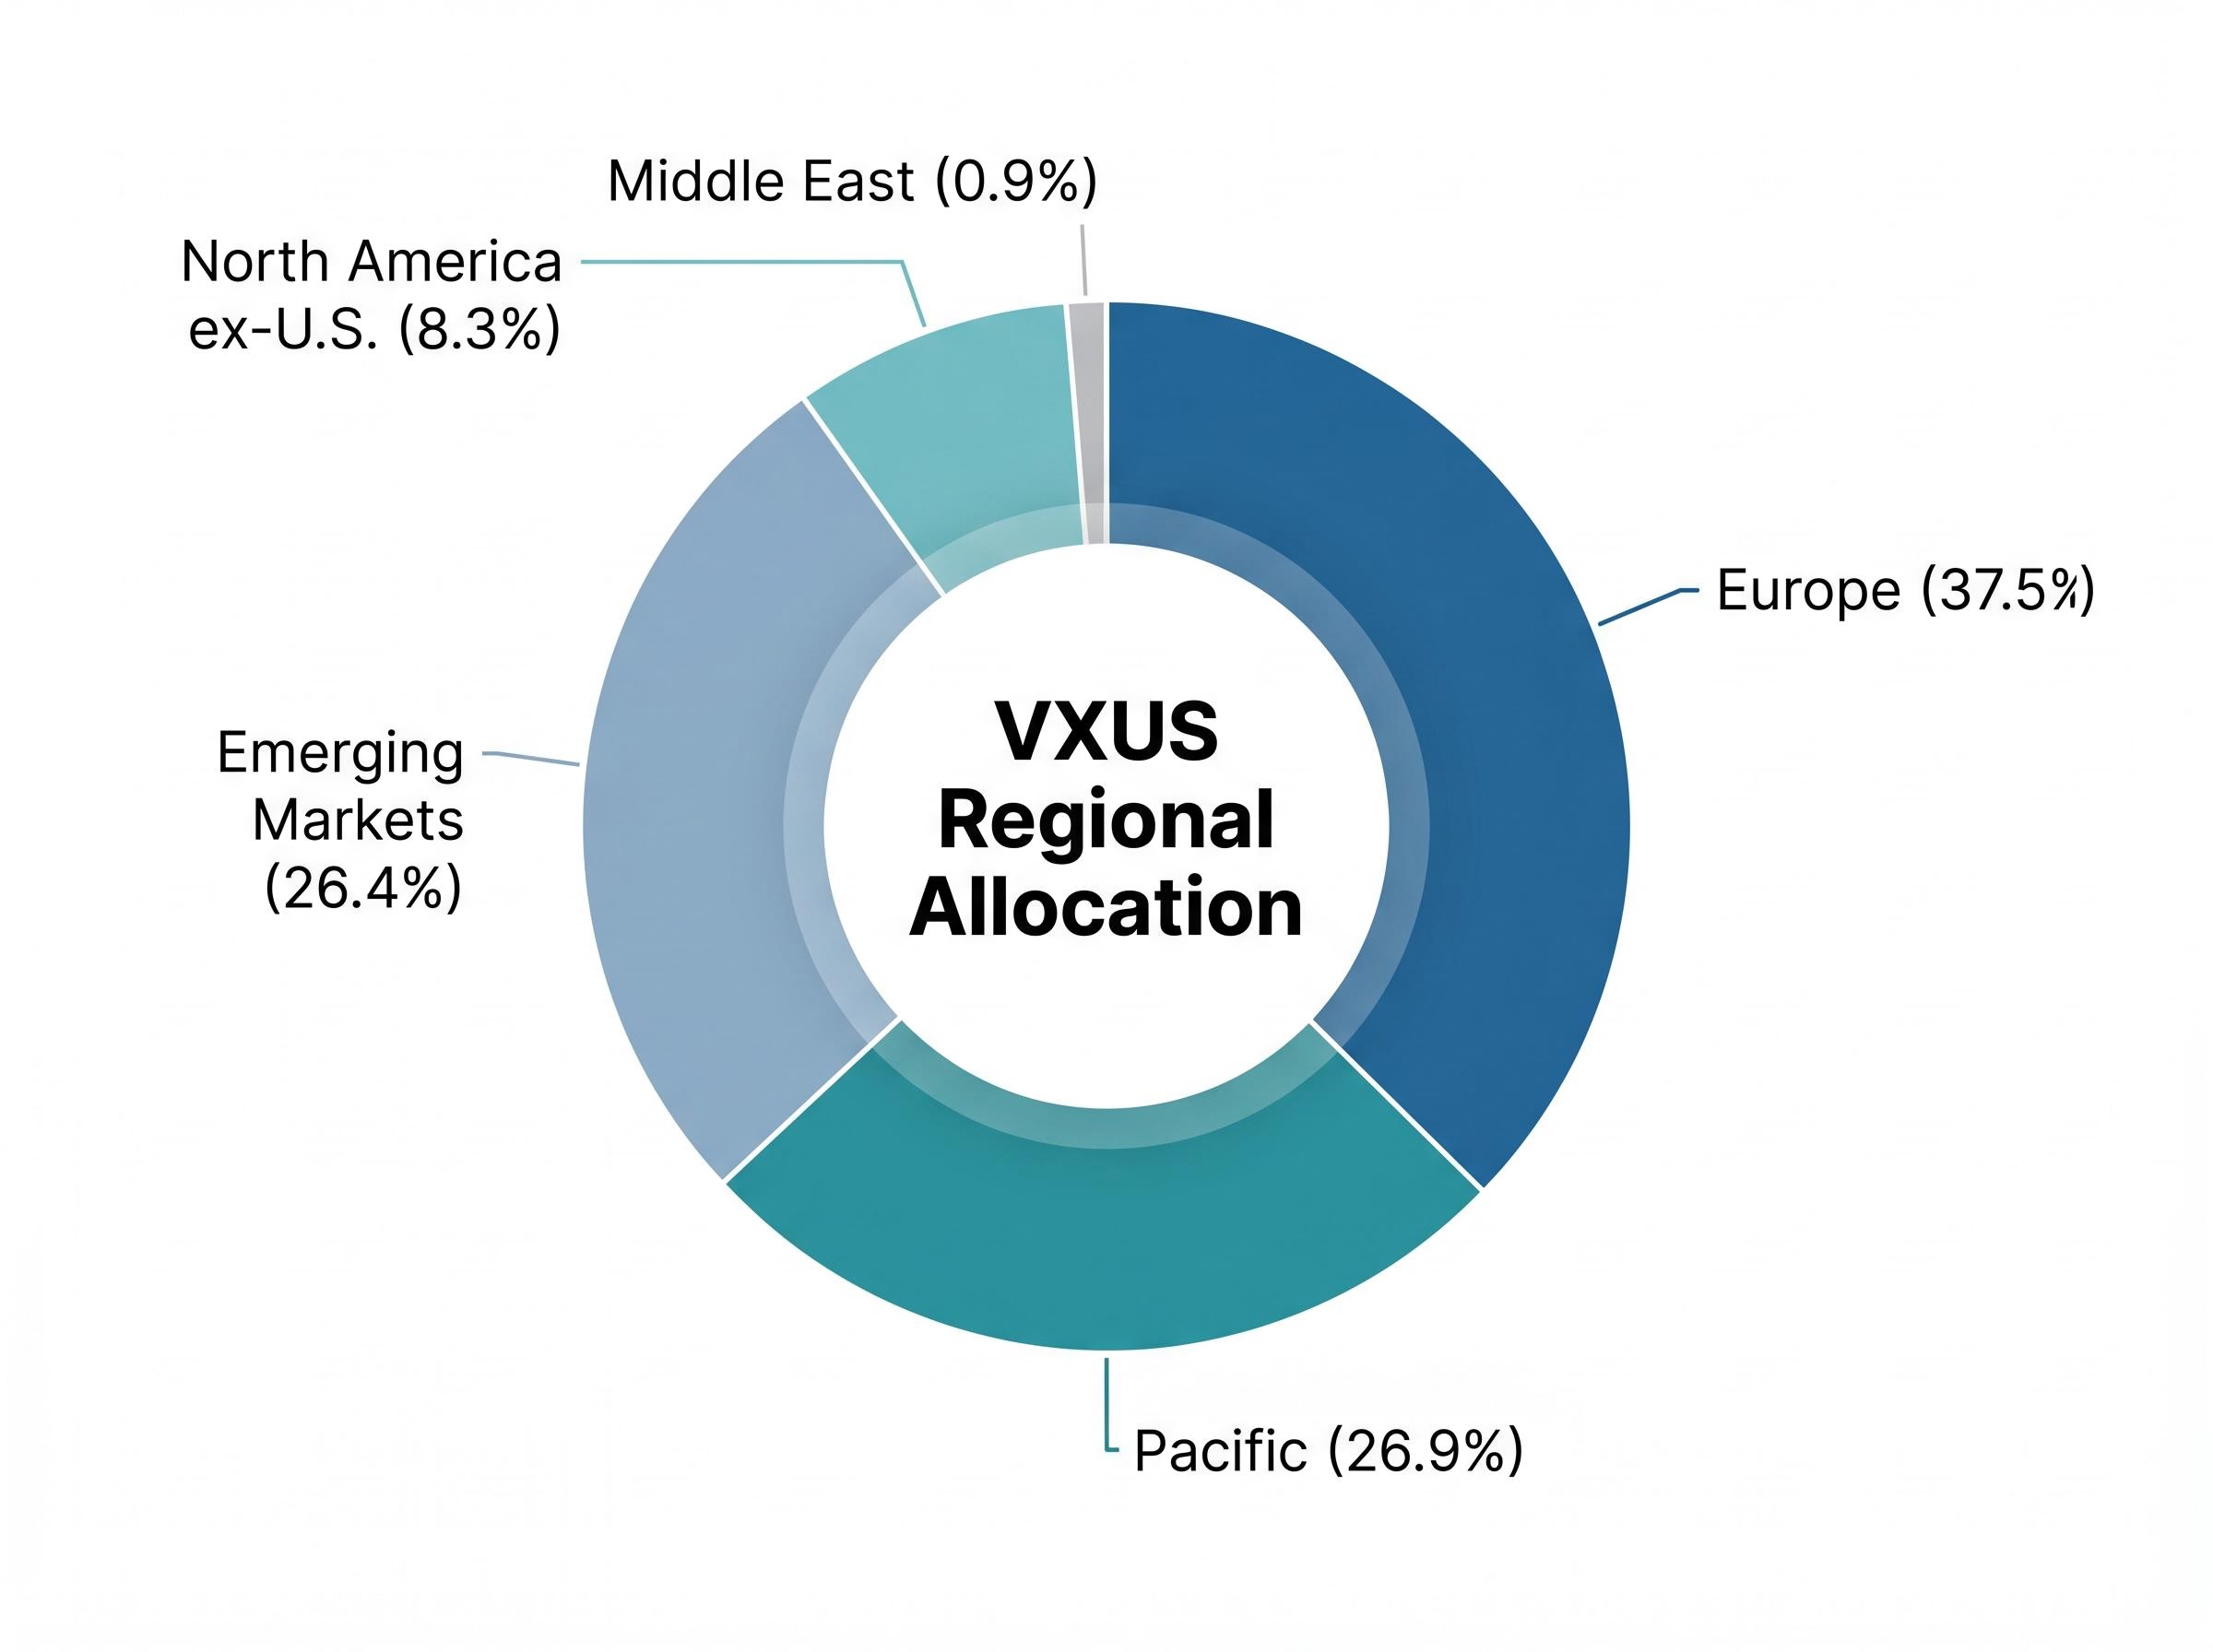
| Region | Allocation (%) |
|---|---|
| Europe | 37.5% |
| Pacific | 26.9% |
| Emerging Markets | 26.4% |
| North America (ex-U.S.) | 8.3% |
| Middle East | 0.9% |
Europe is the largest regional allocation at 37.5%, despite the top three holdings being Asian semiconductor companies. That gap between top-of-fund visibility and actual geographic weight illustrates the breadth of diversification beneath the headline names.
At the sector level, the fund’s centre of gravity sits further from technology than many investors assume:
The 26.4% emerging markets allocation (primarily Asian economies, plus Latin America) introduces exposure to higher-growth but higher-volatility regions, with Tencent and Alibaba representing the most visible Chinese holdings.
The fund’s since-inception annualised return of 6.03% spans a full 15-year period that included multiple global downturns. That figure is the baseline. The more recent numbers tell a story of acceleration.
| Period | Return (%) |
|---|---|
| YTD (to 25 April 2026) | 9.45% |
| 1-Year (to 25 April 2026) | 34.43% |
| 3-Year Annualised (to 31 March 2026) | 15.50% |
| 5-Year Annualised | 7.62% |
| 10-Year Annualised | 8.80% |
| Since Inception (from 26 January 2011) | 6.03% |
The 34.43% one-year return to 25 April 2026 reflects the combined effect of USD weakness, the AI-driven semiconductor rally at the top of the fund, and a broader rotation toward non-U.S. equities. Data sourced from Vanguard and ETFDB.
The international equity rotation driving VXUS’s recent performance is backed by significant institutional capital flows: $75 billion rotated out of U.S. equity funds over the six months through February 2026, and Vanguard projects 5-7% annual returns for international stocks over the next decade versus just 4-5% for U.S. equities.
The benchmark FTSE Global All Cap ex US Index returned approximately 26.57% over the same one-year period, with VXUS’s market price performance running slightly ahead due to low costs and timing differences.
For buy-and-hold investors, the 10-year annualised return of 8.80% may be the most relevant signal. It captures a full cycle of dollar strength and weakness, emerging markets volatility, and multiple sector rotations.
Three instruments dominate the international equity ETF and mutual fund conversation. The differences between them are smaller than many investors assume, but the cost gap compounds meaningfully over time.
| Metric | VXUS | VTIAX | ACWX |
|---|---|---|---|
| Structure | ETF | Mutual Fund | ETF |
| AUM | $142.8B | ~$582B | ~$9.37B |
| Expense Ratio | 0.05% | 0.09% | 0.32% |
| YTD Return | 9.45% | ~8.54% | 9.21% |
| 1-Year Return | 34.43% | ~27.46% | 33.82% |
| Dividend Yield | ~2.77% | ~2.74% | ~2.78% |
| Index Tracked | FTSE Global All Cap ex US | FTSE Global All Cap ex US | MSCI ACWI ex US |
VXUS and VTIAX track the same index, but VXUS carries the lower expense ratio (0.05% vs. 0.09%) and offers intraday tradability as an ETF. For cost-conscious investors who do not require the mutual fund wrapper, VXUS holds a structural edge.
The gap widens with ACWX. At 0.32%, ACWX charges more than six times what VXUS charges for broadly similar international exposure using a different index (MSCI ACWI ex US). On a $100,000 position, that difference translates to $320 per year versus $50. Compounded over a decade, the fee drag becomes substantial.
Dividend yields across all three fall within a narrow band of 2.74-2.78%, confirming that income is not a differentiating factor in this comparison.
Investors weighing VXUS against a broader field of ex-U.S. ETFs will find that how VXUS compares to VEU, IXUS, and SPDW reveals a structural distinction: VXUS is the only major ex-U.S. ETF that combines all-cap coverage with both developed and emerging market exposure in a single vehicle, a feature that peers like SPDW (developed markets only) do not replicate.
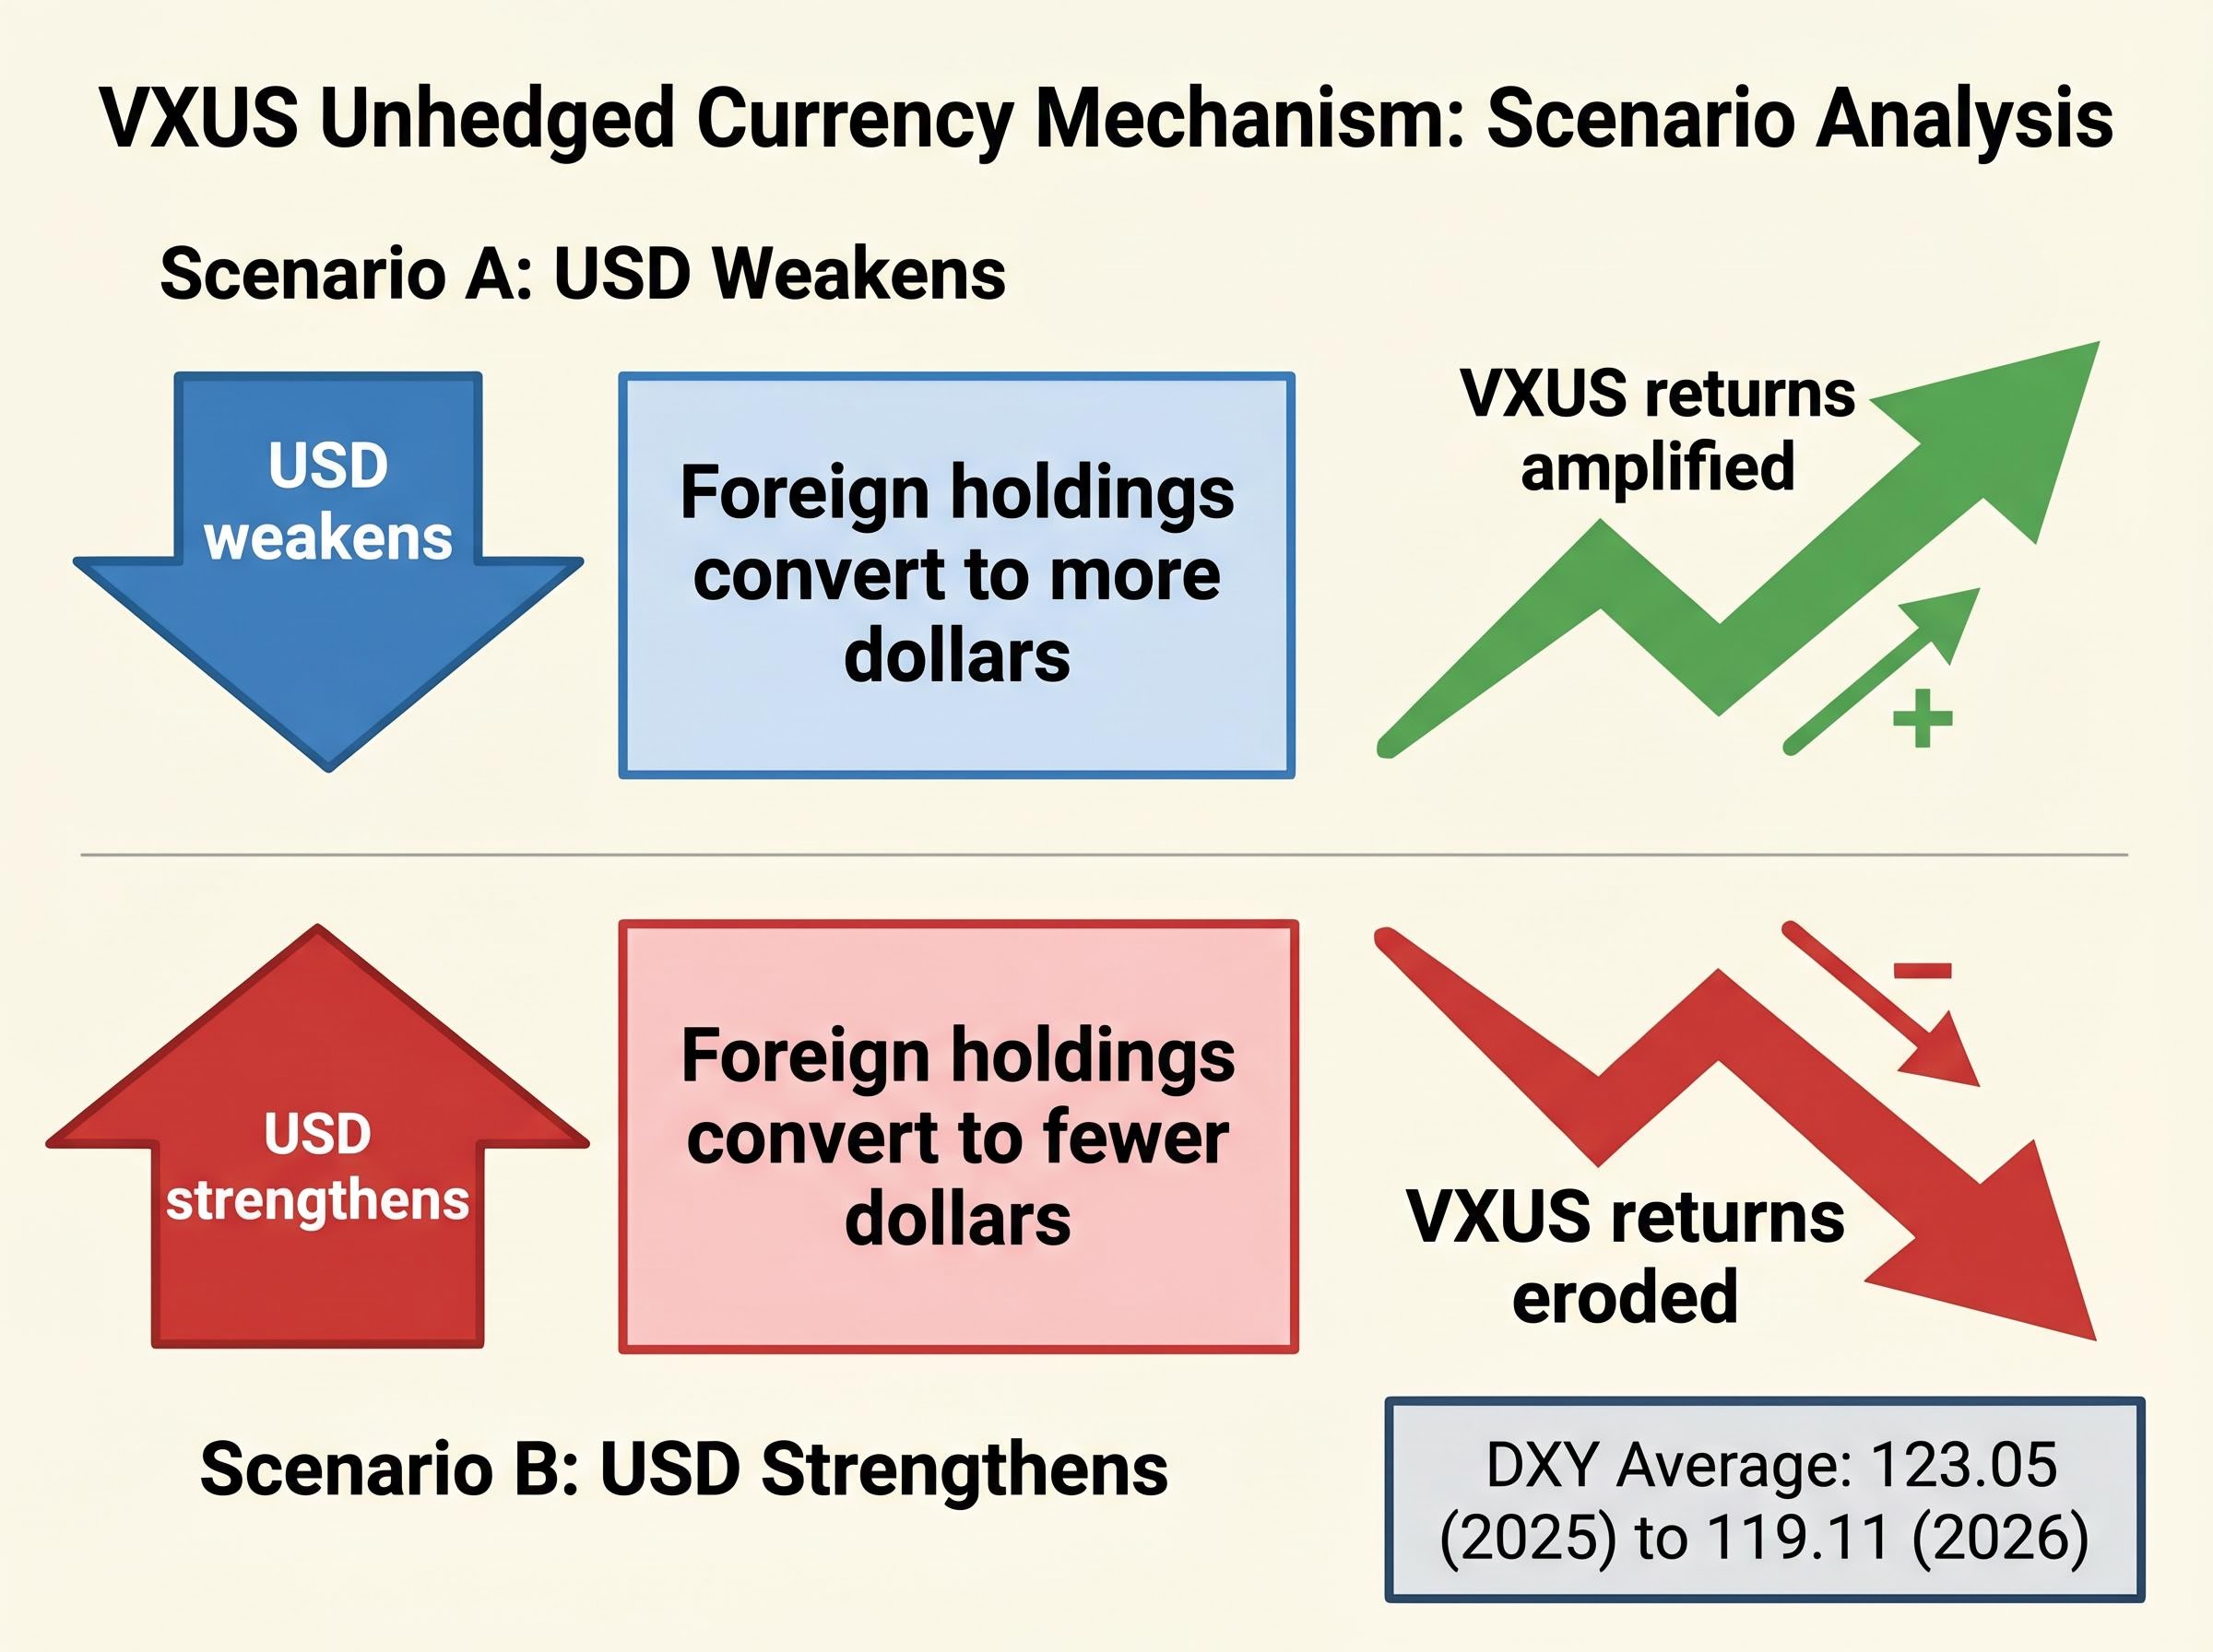
Because VXUS is unhedged, every dollar invested carries direct exposure to foreign currency fluctuations. When the USD weakens, foreign-currency-denominated assets are worth more when converted back to dollars, boosting returns. When the USD strengthens, the reverse applies.
In 2025-2026, this mechanism has worked decisively in VXUS holders’ favour. The DXY (a measure of dollar strength against a basket of major currencies) declined from an annual average of 123.05 in 2025 to 119.11 in 2026, with a further decline of approximately 2.24% in the month to 27 April 2026. VXUS rose more than 20% in 2025, driven in significant part by USD depreciation of 6-10% against major currencies.
Morningstar notes that while currency effects can drag performance in strong-USD environments, they tend to wash out over the long term, and the fund’s diversification advantage shines through short-term dislocations.
This is not a footnote. In any given year, currency movement can represent a larger share of VXUS’s return than the underlying equity performance itself. Investors who owned the fund through the strong-dollar period of 2021-2023 experienced this dynamic in reverse.
The 34.43% one-year return reflects a period where nearly every tailwind blew in the fund’s favour: USD weakness, AI semiconductor demand, and a rotation away from U.S. equity concentration. Not all of those conditions will persist.
The primary risks to consider:
The most common portfolio application for VXUS is as the international complement to VTI (Vanguard Total Stock Market ETF) in a two-fund or three-fund portfolio. Typical allocation splits range from 80% VTI / 20% VXUS for investors with moderate international conviction to 60% VTI / 40% VXUS for those seeking greater geographic balance.
The complementary risk of pairing VXUS with VTI is that VTI concentration in Magnificent Seven mega-caps is larger than many investors realise: despite holding approximately 3,500 stocks, VTI’s top 10 positions account for 31.60% of the portfolio, with Nvidia, Apple, and Microsoft alone representing 16.7% of the fund.
Even a modest allocation captures meaningful diversification at minimal cost. Source analysis references 5% as a minimum threshold where geographic diversification begins to have a measurable effect on portfolio-level risk characteristics. At 0.05% per year, the cost of maintaining that allocation is negligible.
The right allocation ultimately depends on the investor’s view on USD direction, tolerance for emerging markets volatility, and desire to reduce U.S. equity concentration risk. There is no single correct answer; the decision is a function of each investor’s circumstances and convictions.
VXUS is one of the most cost-efficient instruments available for gaining broad non-U.S. equity exposure, and its top holdings tell a coherent story about where global technology and economic power is concentrated outside America. The fund’s structure, covering thousands of securities across developed and emerging markets for 0.05% per year, represents institutional-grade index methodology at retail-accessible cost.
The honest tension is that the fund’s recent strong performance has been materially aided by USD weakness and the AI semiconductor cycle. Neither tailwind is guaranteed to persist, and investors should calibrate expectations accordingly. Past performance does not guarantee future results, and financial projections remain subject to market conditions and various risk factors.
For U.S. investors who hold concentrated domestic equity positions, VXUS offers a low-friction way to add geographic diversification backed by a 15-year track record. The decision comes down to each investor’s view on U.S. versus non-U.S. equity prospects and their tolerance for currency and geopolitical risk.
This article is for informational purposes only and should not be considered financial advice. Investors should conduct their own research and consult with financial professionals before making investment decisions.
VXUS is the Vanguard Total International Stock ETF, tracking the FTSE Global All Cap ex US Index and providing exposure to more than 8,000 securities across both developed and emerging markets outside the United States in a single fund.
VXUS charges an expense ratio of 0.05% as of February 2026, which translates to just $50 per year on a $100,000 position, making it one of the lowest-cost international equity ETFs available.
VXUS returned 34.43% over the one-year period to 25 April 2026, driven by USD weakness, the AI-driven semiconductor rally in its top holdings, and a broad institutional rotation toward non-U.S. equities.
Because VXUS is unhedged, a weakening U.S. dollar boosts returns by making foreign-currency assets worth more when converted back to dollars, while a strengthening dollar erodes returns; in 2025-2026 this mechanism has significantly amplified VXUS gains.
VXUS and VTIAX track the same index but VXUS has a lower expense ratio (0.05% versus 0.09%) and trades intraday as an ETF, while ACWX uses a different index and charges 0.32%, more than six times the cost of VXUS for broadly similar international exposure.


