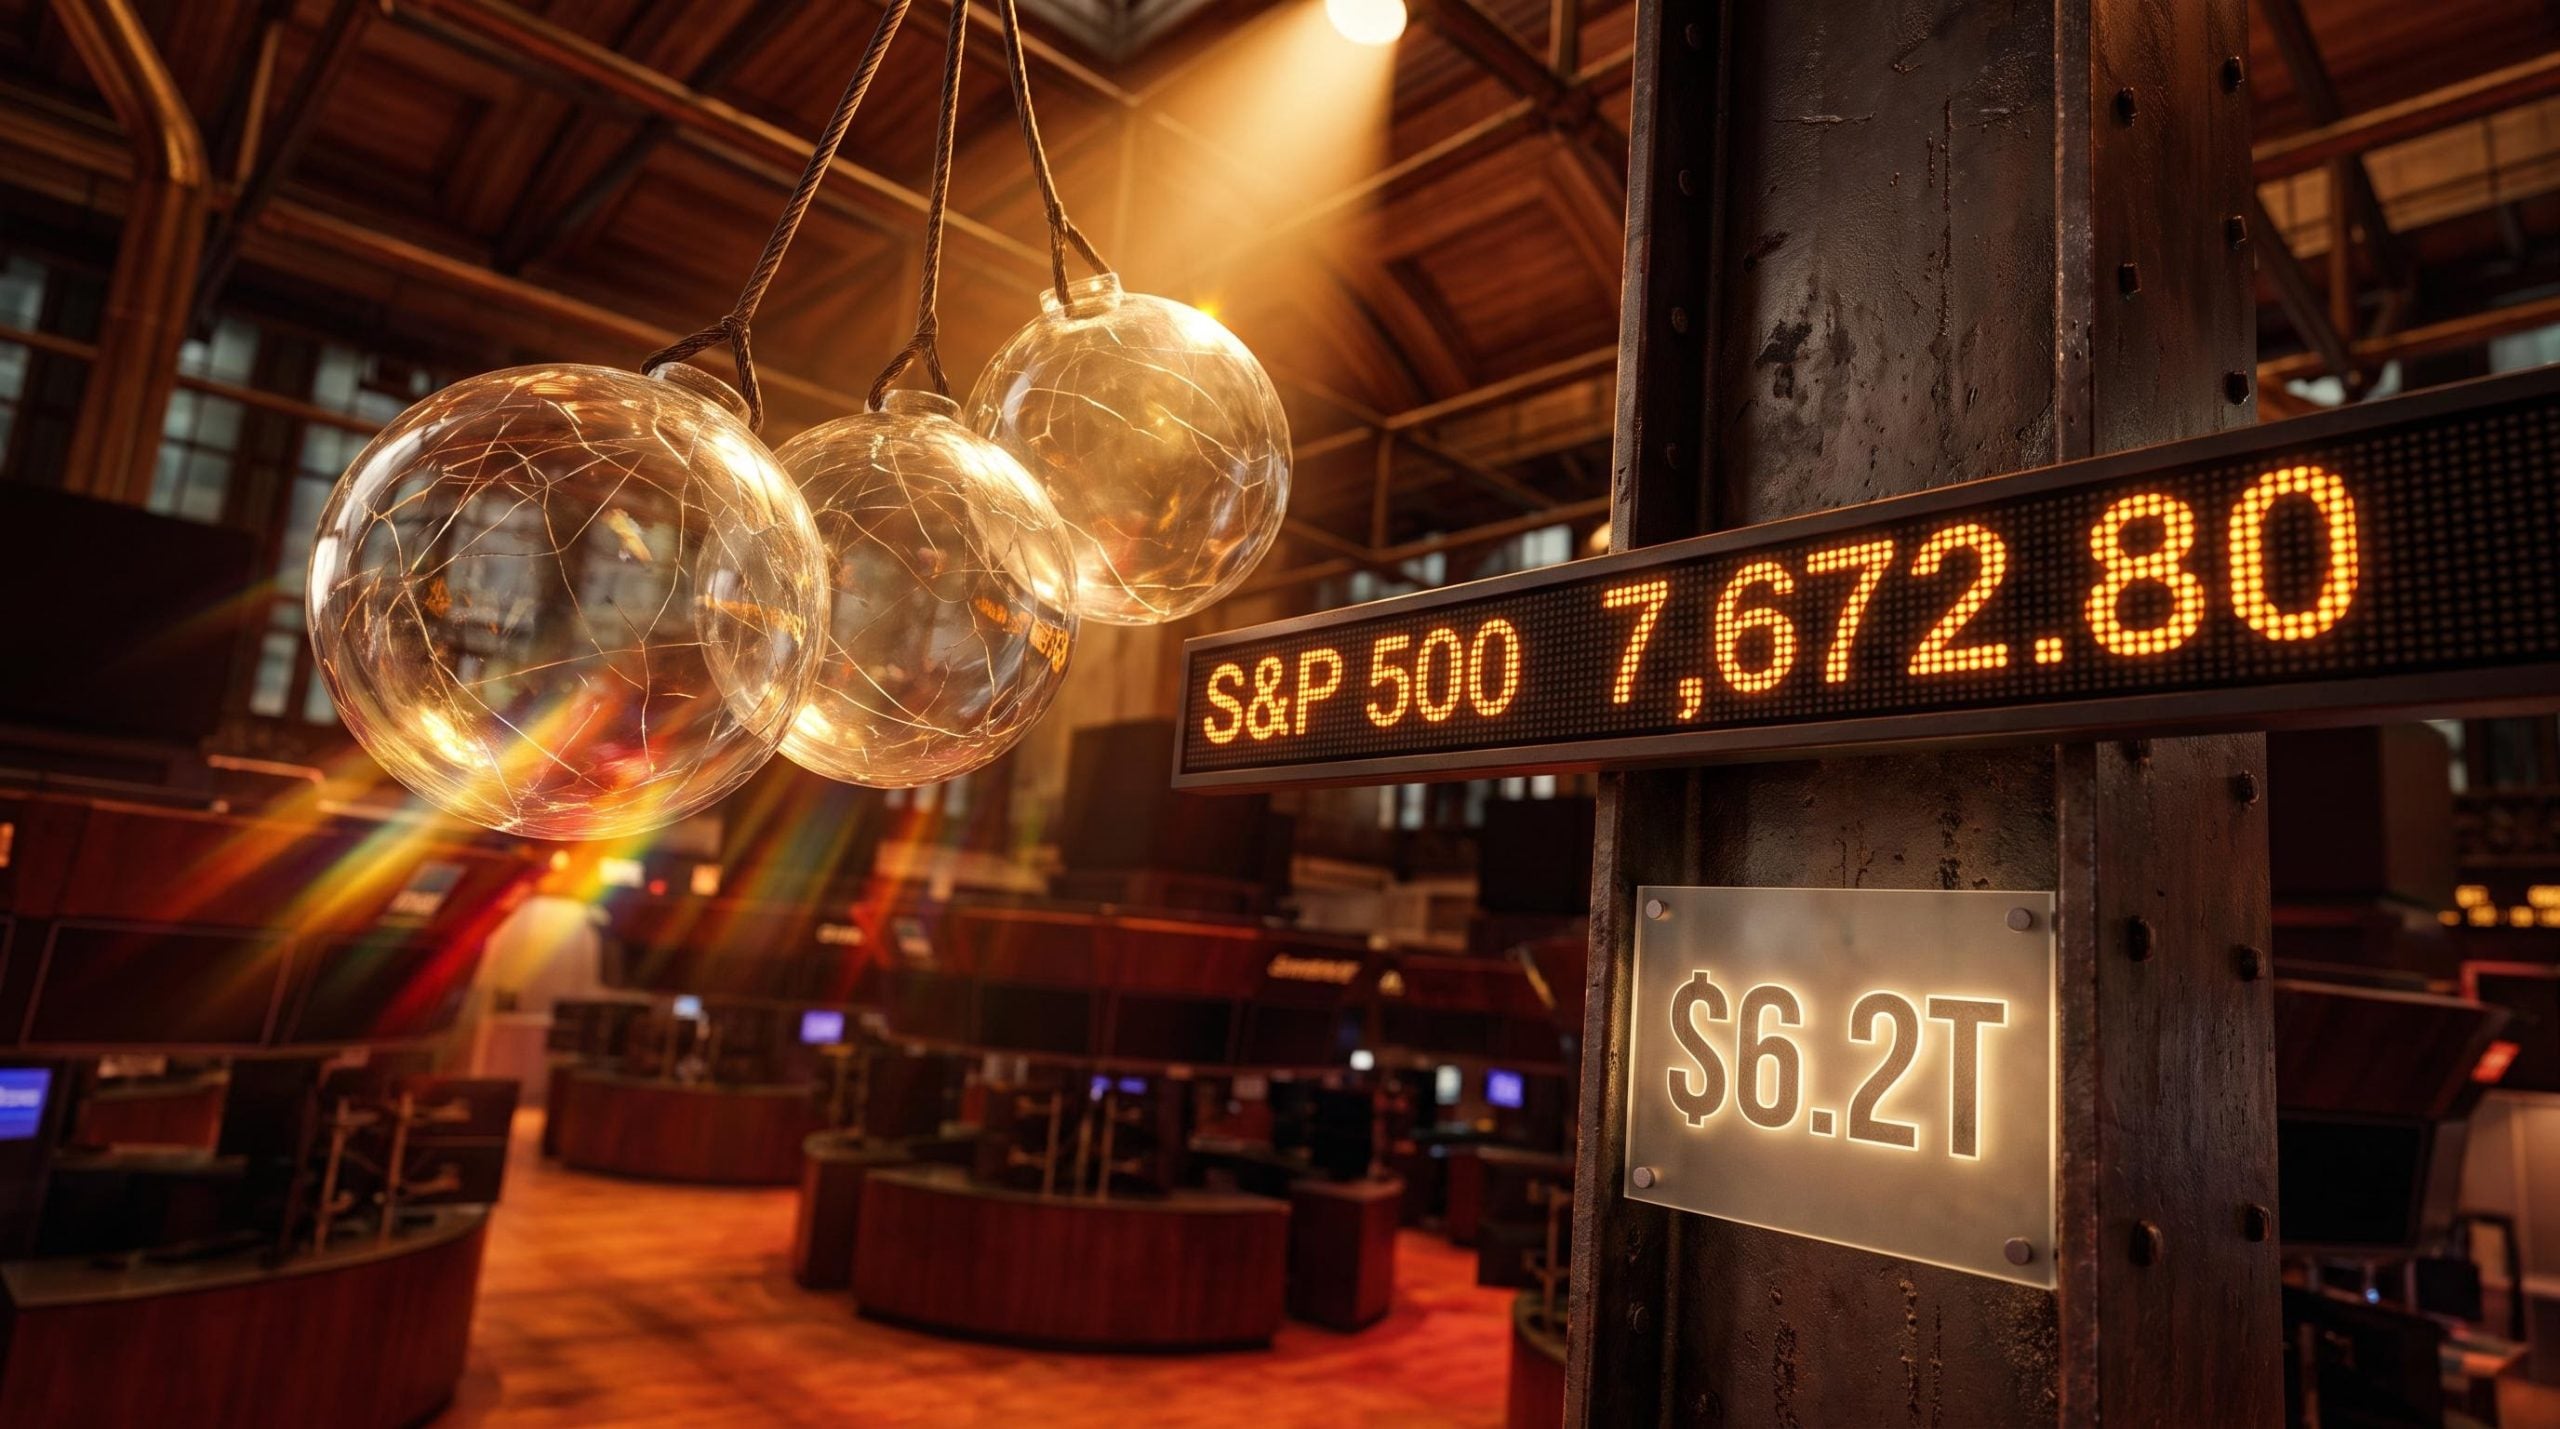
Tomorrow, roughly US$6.2 trillion in options exposure expires in a single trading session. That is not a typo, and it is not a normal Friday.
September triple witching events have historically produced some of the year’s most turbulent conditions, yet most self-directed investors have never heard the term. This particular expiry arrives with an FOMC decision landing two days before it, dealer positioning already sitting in a negative-gamma regime, and a notional figure edging toward record territory.
There is nothing academic about understanding what drives these conditions. The week after triple witching has closed lower 27 of the last 35 times since 1990. Here is how the mechanics work, why this specific event carries unusual structural risk, what the historical data actually shows, and what all of that means for how you approach the next five trading days.
What is triple witching, and why does tomorrow’s event stand apart?
Triple witching is the quarterly moment when three types of derivatives contracts all expire at the same time. Each one behaves differently, but the simultaneous expiry forces a wave of settlement activity into a single session.
The three components are:
- Stock-index futures: contracts to buy or sell an index (such as the S&P 500) at a set price on a future date.
- Stock-index options: contracts giving the right, not the obligation, to buy or sell an index at a set price.
- Single-stock options: the same kind of right-to-buy or right-to-sell contract, but tied to individual company shares.
It is worth separating triple witching from quad witching, which adds a fourth component: single-stock futures. The distinction matters mostly for terminology, but you will see both terms used around expiry weeks.
How September 2026 compares to prior witching events
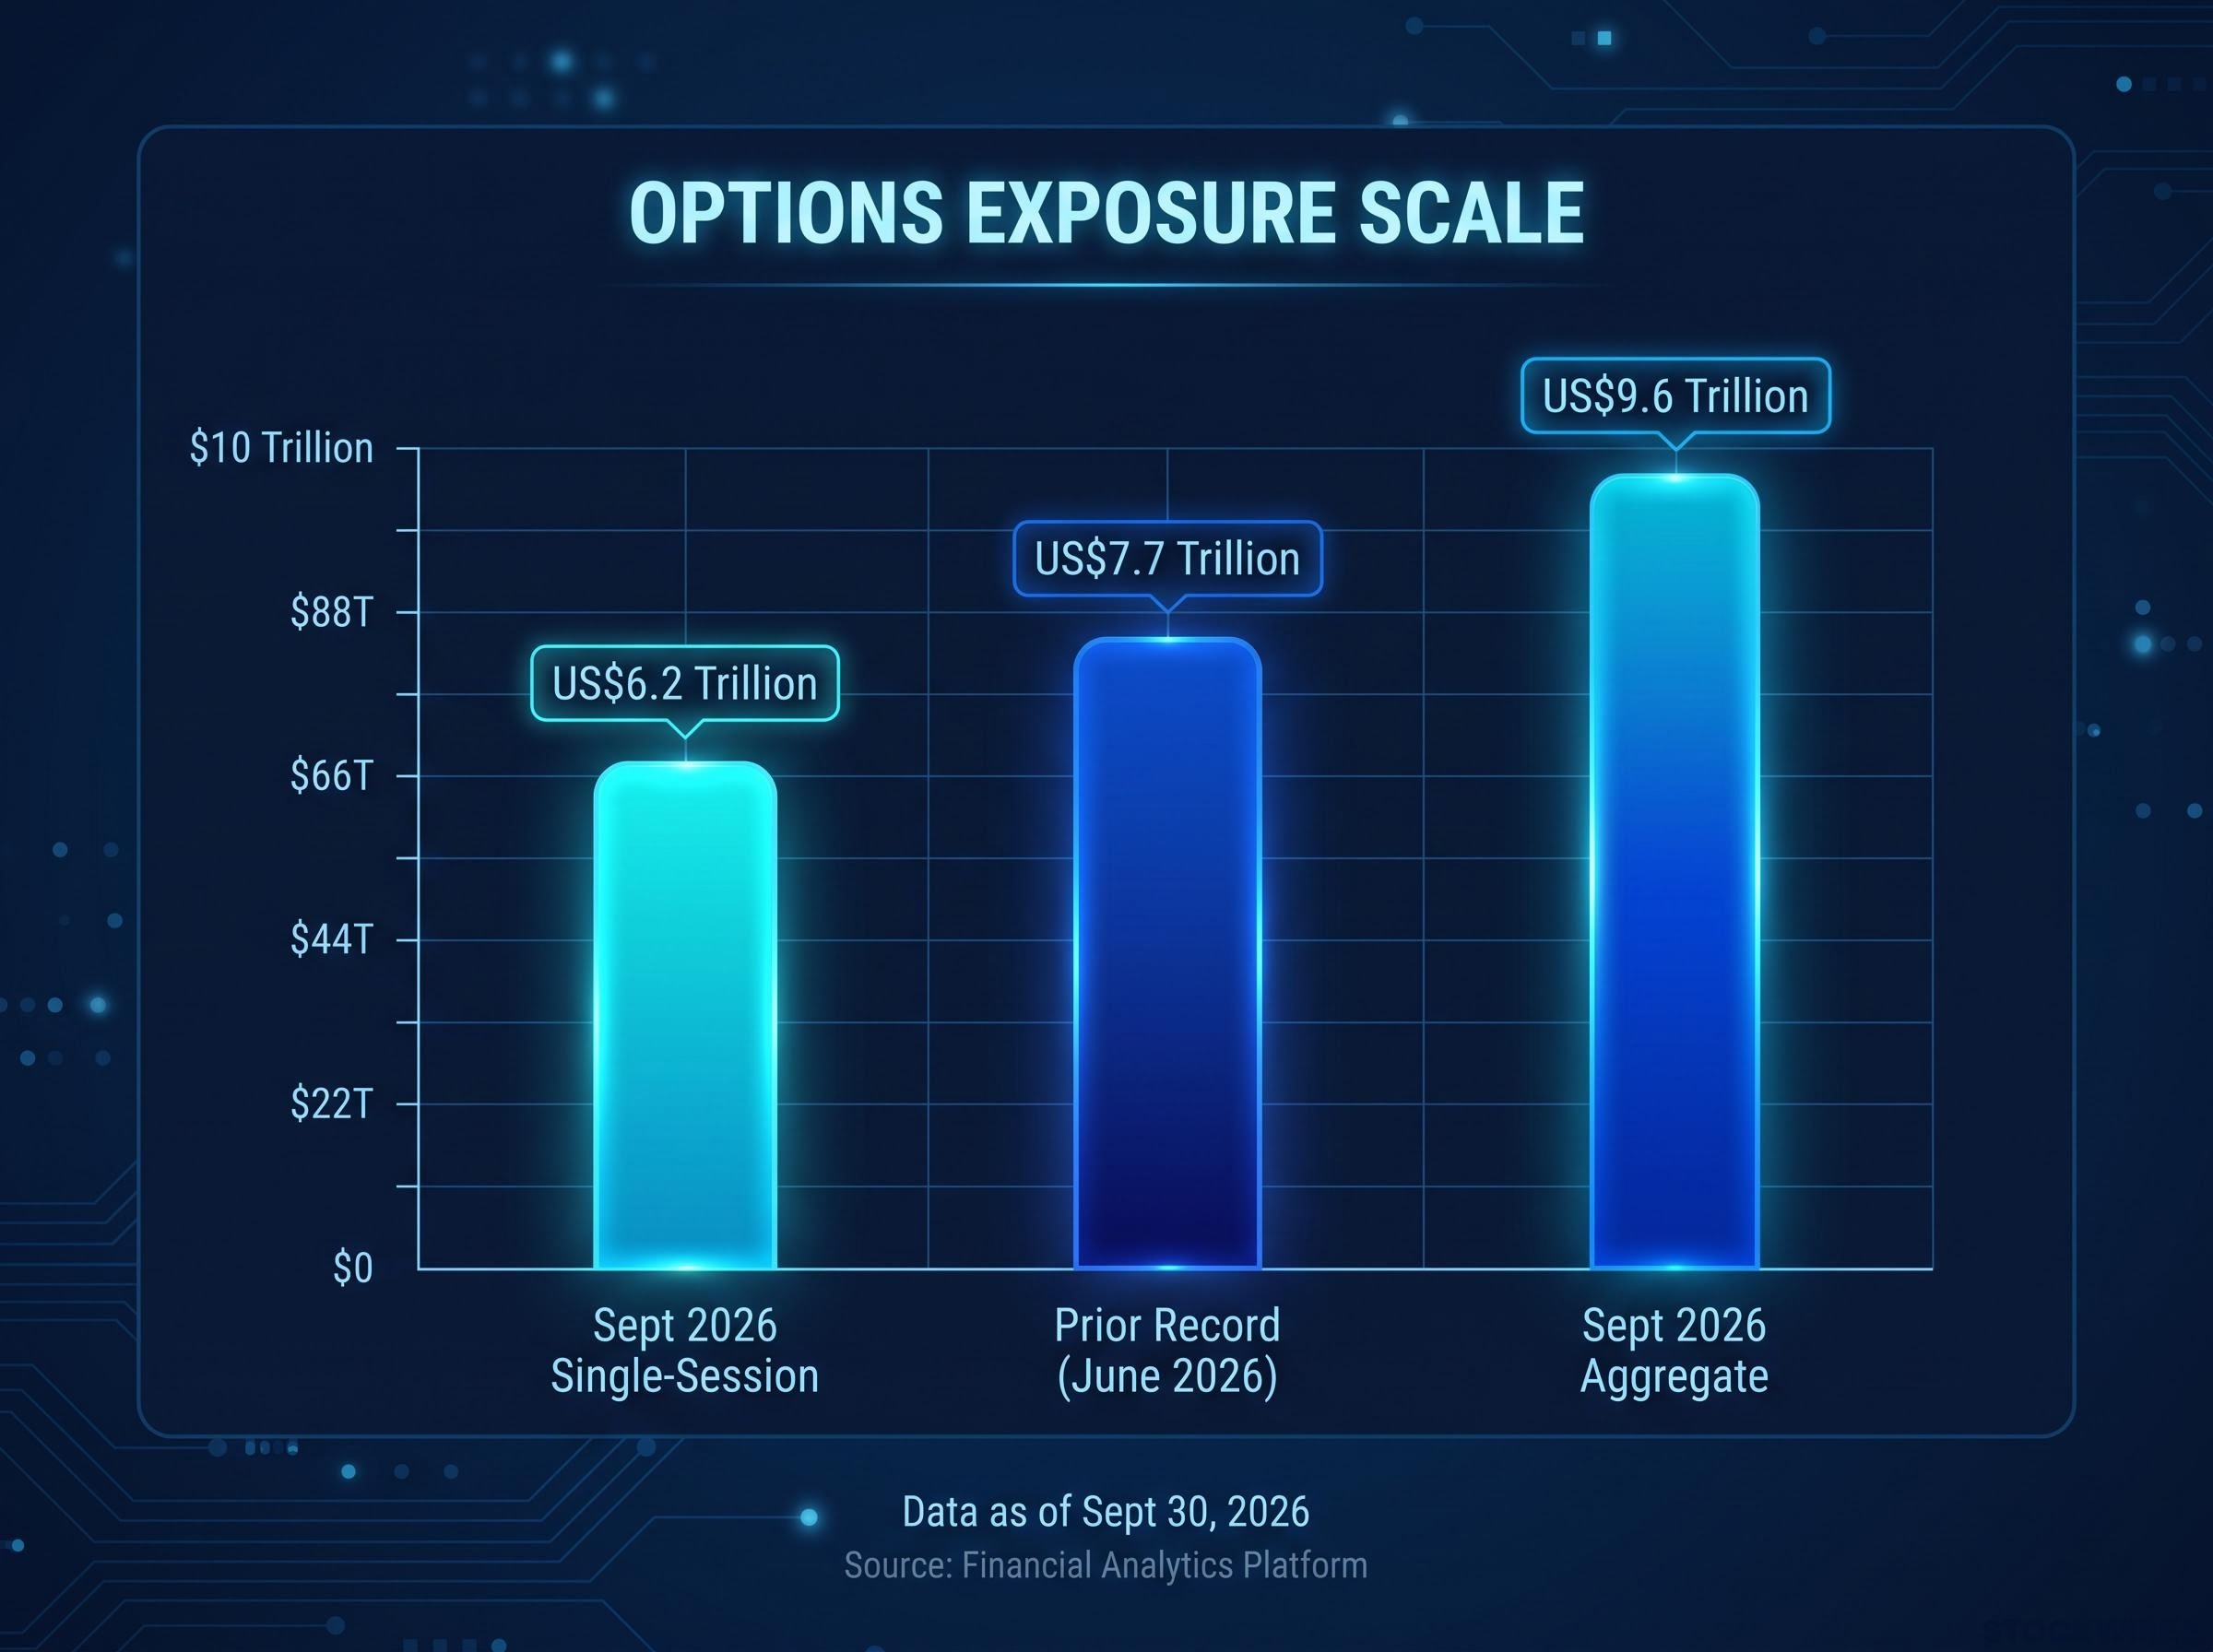
What sets this session apart is scale. According to Citadel Securities’ “September Setup” analysis, built on Bloomberg options open-interest data as of 27 August 2026, roughly US$6.2 trillion in notional exposure is scheduled to expire on 18 September 2026 alone.
FOMC structure and rate tools shape market sensitivity in ways that go beyond the headline decision: when a dot plot revision rather than an actual rate change moved markets sharply in June 2026, it illustrated how the Fed’s forward guidance mechanism, operating through statement language and press conference signalling, can inject macro volatility into an options market already positioned around a structural expiry.
The headline figure Approximately US$6.2 trillion in single-session options notional is set to expire tomorrow, per Citadel Securities’ analysis of Bloomberg open-interest data. This figure is provisional, based on the 27 August data cut, and is expected to have grown as nearer-dated contracts rolled into the expiry.
Zoom out to the broader period and the number climbs to roughly US$9.6 trillion in aggregate options exposure, around 35% of all US options exposure. That aggregate figure challenges the prior record of approximately US$7.7 trillion set in the June 2026 period.
The order flow tells the same story. Nasdaq data shows that open auctions on triple-witching dates run roughly 10x larger than normal (around US$28 billion), and closing auctions around 5x larger (around US$80 billion).
Larger notional does not mean larger risk in a straight line. What it does mean is that the hedging flows described next operate at a magnitude that can visibly push index prices around, rather than working quietly in the background.
When big ASX news breaks, our subscribers know first
The gamma mechanics beneath the surface: why big expiries amplify market moves
Watch the S&P 500 tomorrow and you may notice prices clustering near round numbers through the day, then snapping sharply once the session closes. That is not coincidence. It is the visible fingerprint of dealer hedging.
To understand why, you need one concept: dealer gamma, often labelled GEX (gamma exposure). It measures the combined option positioning of the market makers who sit on the other side of options trades, and it tells you which way their hedging pushes prices.
When dealers hold positive gamma, they buy dips and sell rallies. That stabilises the market, cushioning moves in both directions. When they hold negative gamma, the reverse happens: they sell into falling prices and buy into rising ones, which amplifies whatever move is already underway.
| Attribute | Positive gamma | Negative gamma |
|---|---|---|
| Dealer action on a dip | Buy (support prices) | Sell (extend the fall) |
| Dealer action on a rally | Sell (cap the rise) | Buy (extend the rise) |
| Market effect | Dampens volatility, moves revert | Amplifies volatility, moves accelerate |
| Typical conditions | Calm, range-bound sessions | Post-expiry, thin-liquidity windows |
The clustering you see is called the pinning effect. Where large open interest sits at a particular strike price, dealers hedging that exposure sell above it and buy below it, compressing the intraday range. Once expiry clears those contracts, the constraint vanishes, and price is free to break sharply. That release is why pin risk matters so much on witching days.
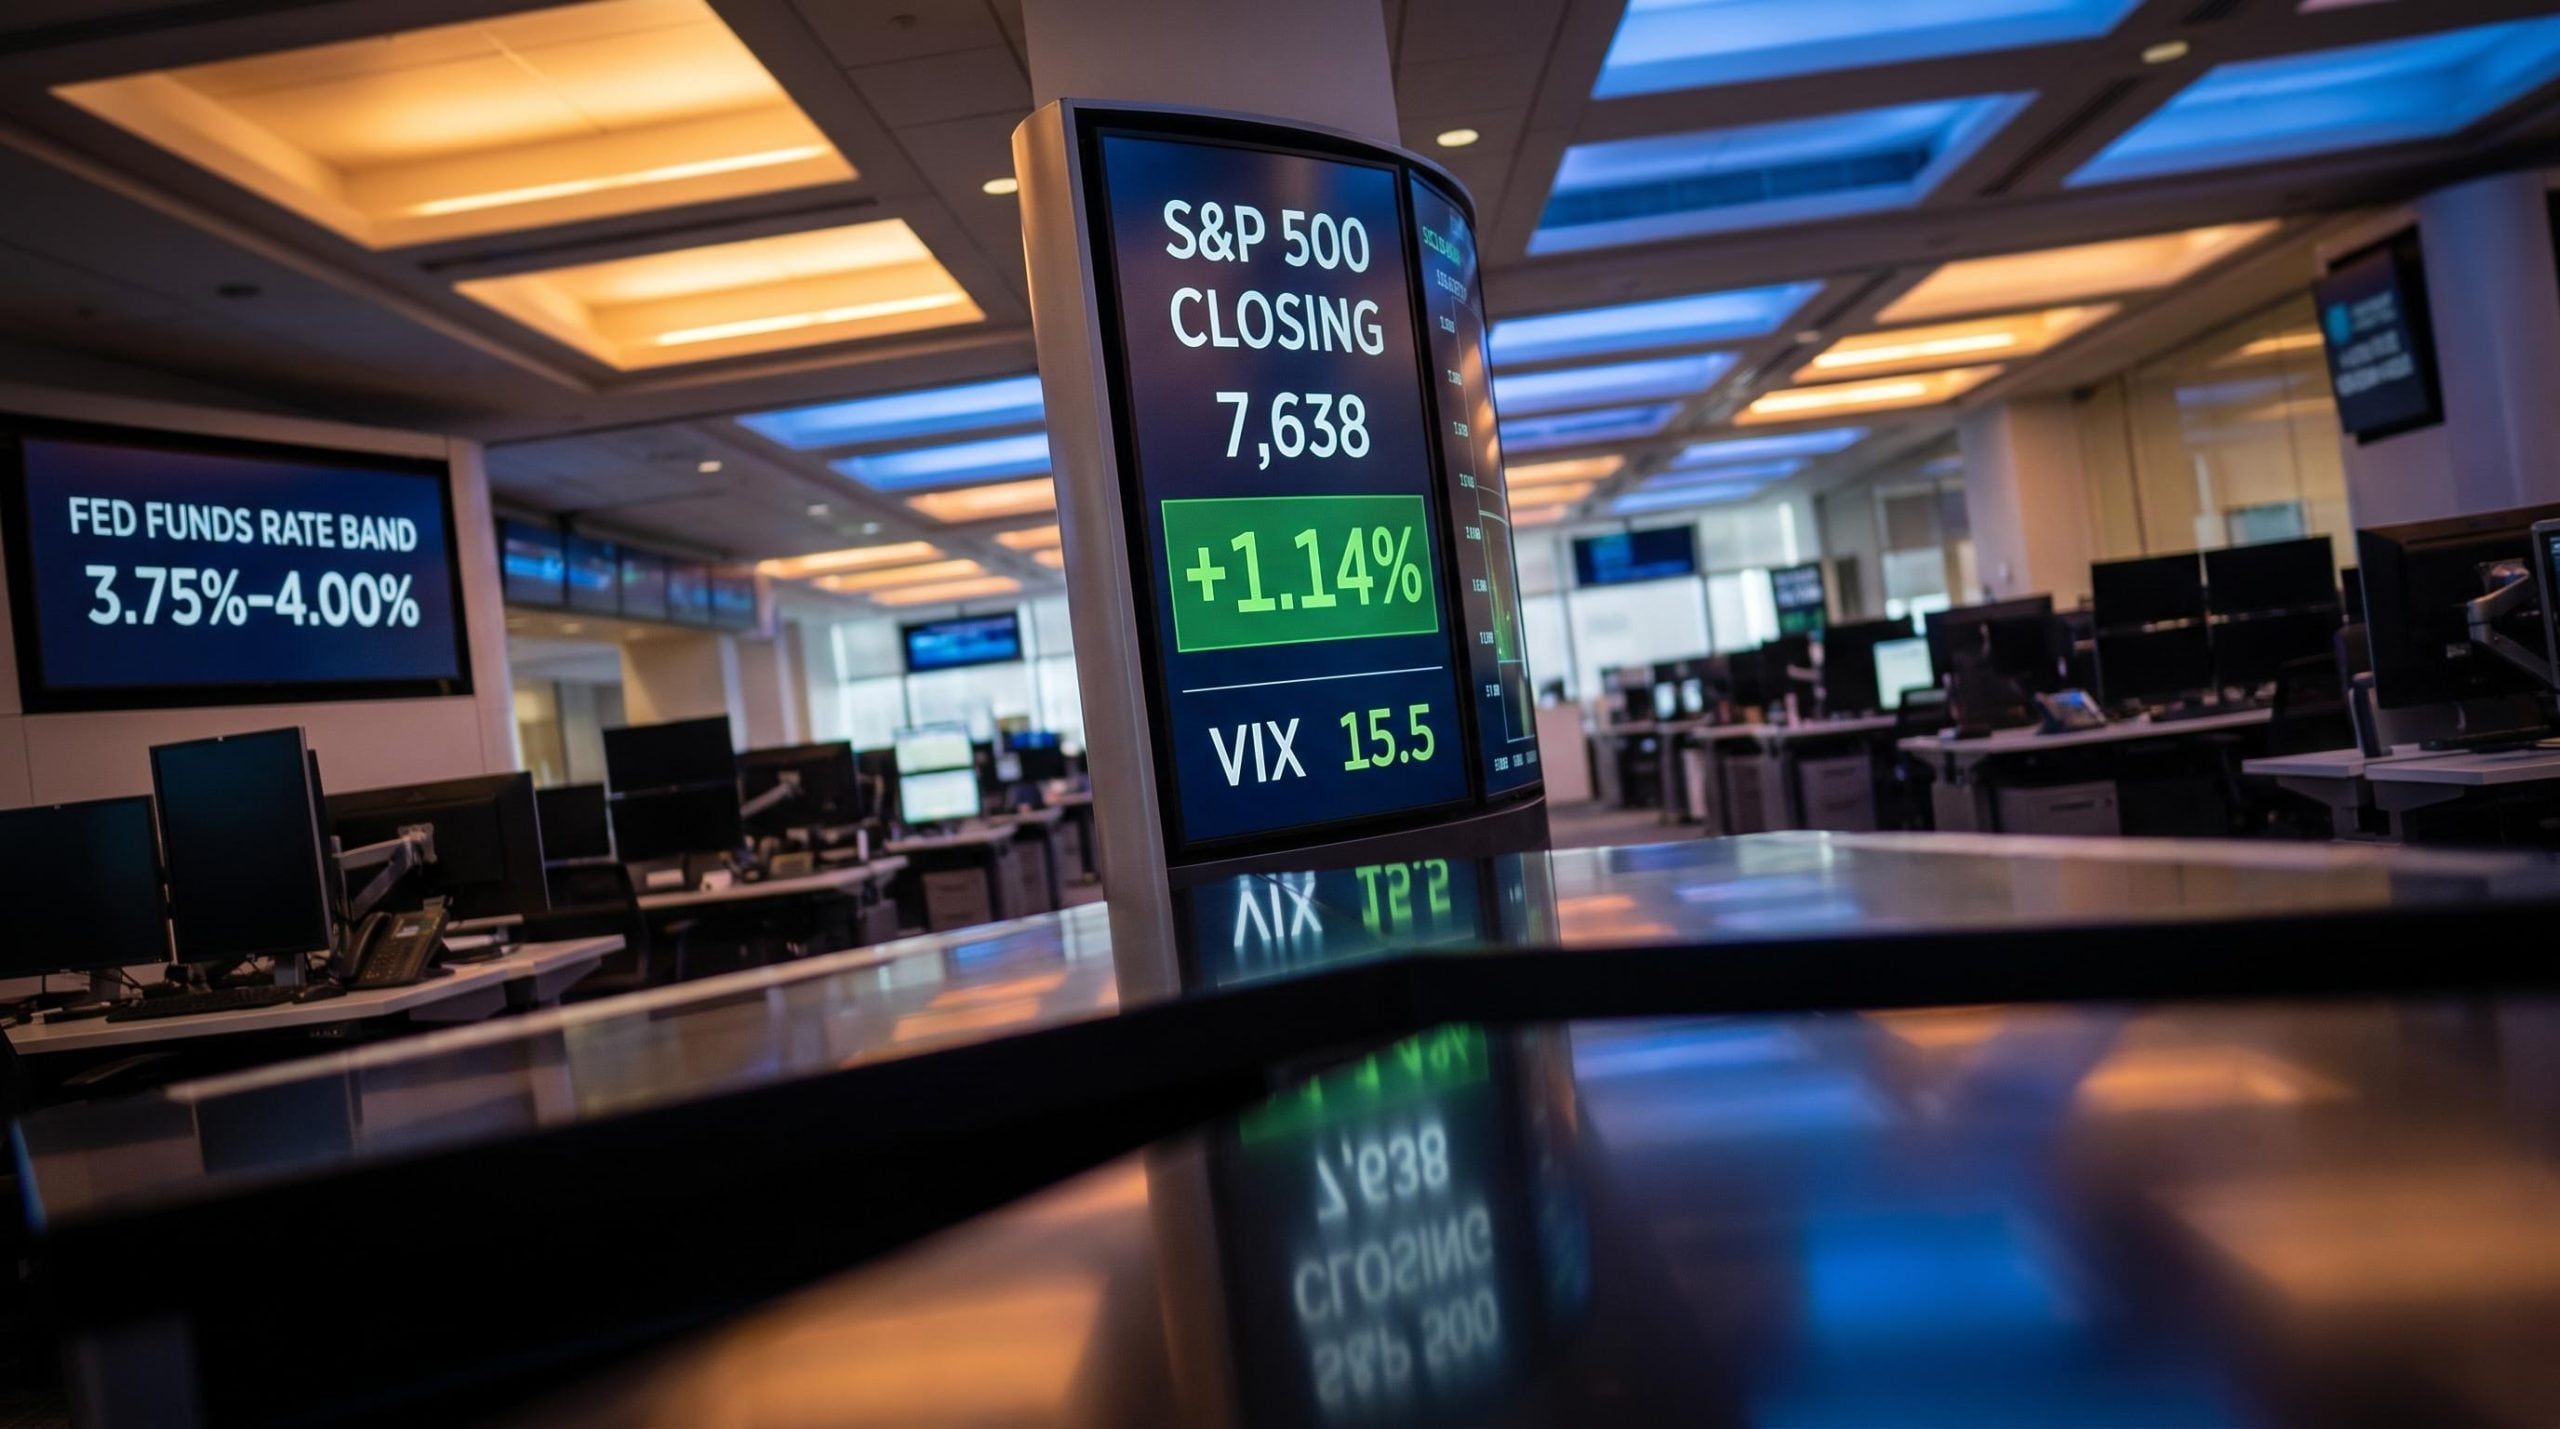
Where the S&P 500 stands heading into September 18
The setup this time leans structurally fragile. Cboe open-interest data settled on 15 September 2026 shows net dealer gamma of approximately negative US$50.18 billion, a firmly negative reading.
The Moomoo weekly-levels report from 13 September 2026 places the zero-gamma pivot, the level where dealer positioning flips between regimes, at roughly 7,672.80. A 14 September 2026 Moomoo note adds that the positive gamma currently supporting the index near 7,600 expires with tomorrow’s contracts, after which the market flips to negative gamma below around 7,550.
SpotGamma’s “September OPEX Options Positioning: 7,600” analysis from 12 September 2026 takes it further.
The negative-gamma corridor Below 7,600, SpotGamma’s five-day projection runs negative gamma the whole way down, with no trough until roughly 7,350. HokaNews has similarly warned that supportive long-gamma positioning could fade as options expire, removing existing shock absorption.
The read for you is direct. If the S&P 500 is trading below the zero-gamma pivot on Friday morning, dealer flows will tend to extend a move rather than cushion it. A 0.5% dip carries more structural momentum than it would on an ordinary Tuesday, and the FOMC decision two days earlier only adds macro fuel to that dynamic.
What history actually shows about triple witching performance
Start with the day itself. According to Gate.com, the S&P 500 has averaged roughly negative 0.52% on triple-witching days. Robinhood data puts the median at negative 0.36%, with only 25% of these sessions closing positive against a 55% win rate on regular days.
The streak data reinforces the tilt. The Stock Traders Almanac notes the S&P 500 has finished lower on triple-witching Friday in 12 of the last 13 years, while Bluekurtic Market Insights records declines on 12 of 14 days since 2012.
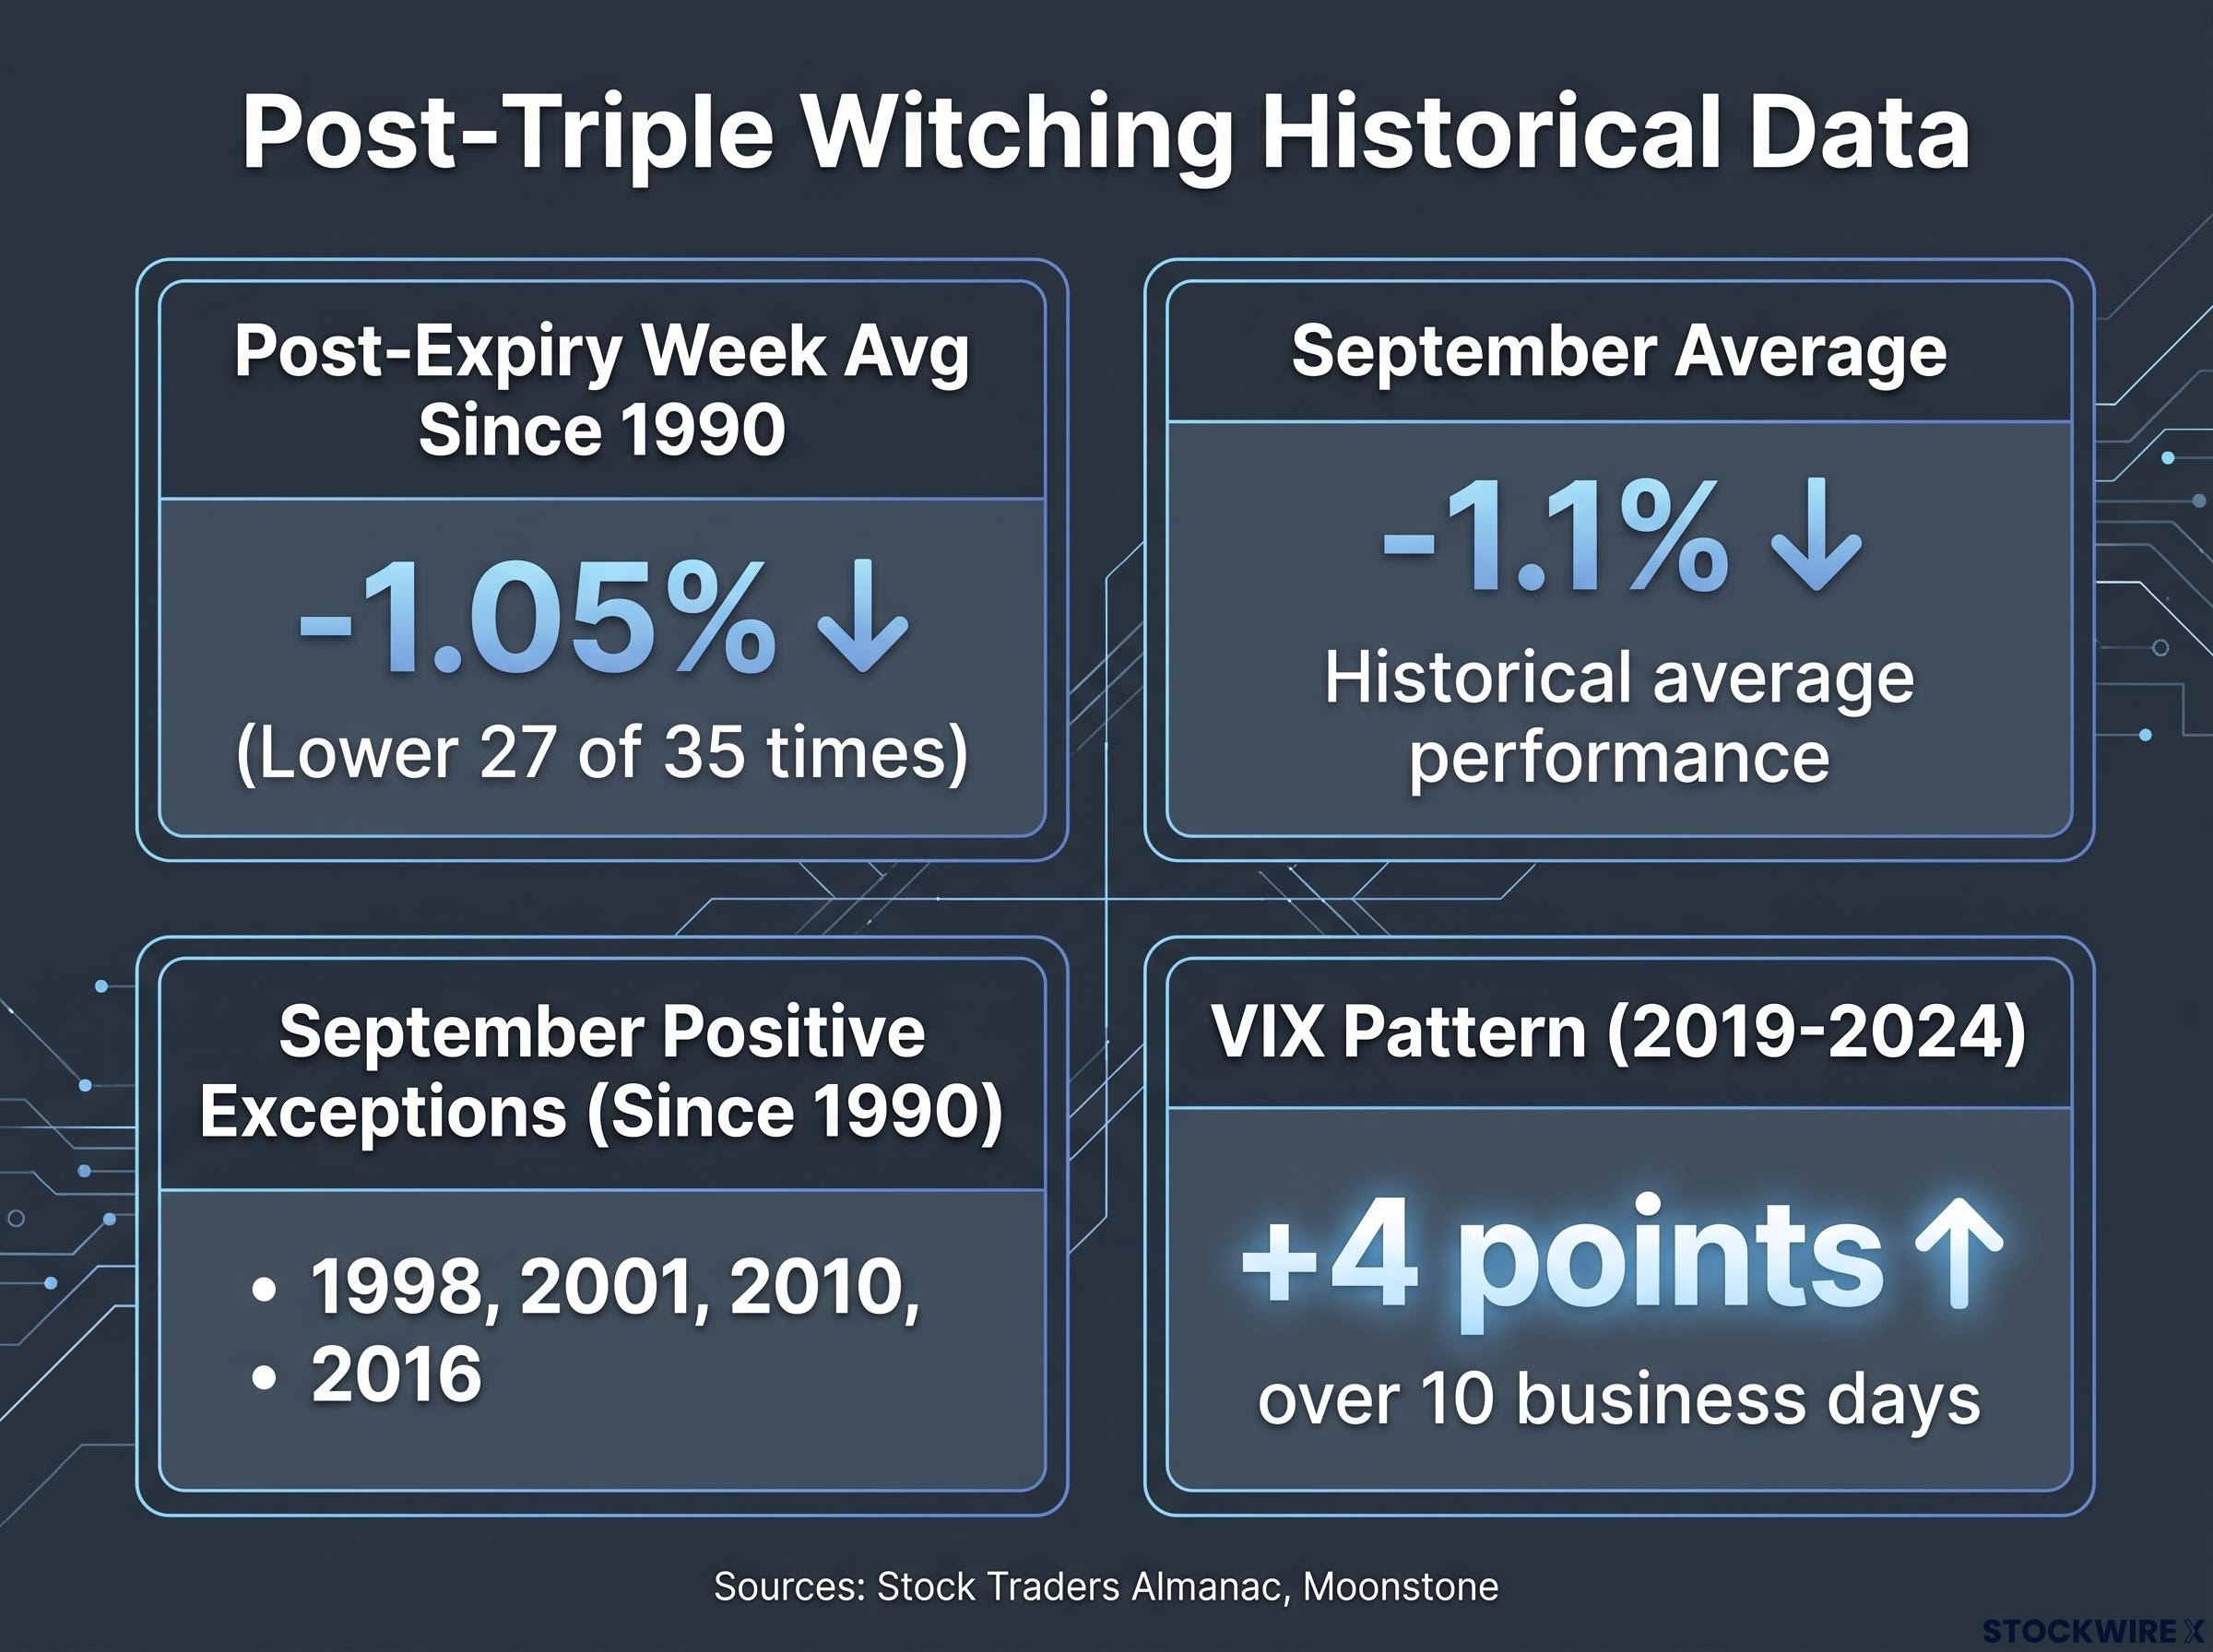
The more consequential window sits after expiry. Since 1990, the S&P 500 has fallen in the post-expiry week 27 of 35 times, averaging a loss of roughly negative 1.05%, per the Stock Traders Almanac. Narrow it to September and the average is around negative 1.1%, with only four positive exceptions since 1990: 1998, 2001, 2010 and 2016.
| Metric | Figure | Source |
|---|---|---|
| Day-of average return | ~ negative 0.52% | Gate.com |
| Day-of win rate | 25% positive (vs 55% on regular days) | Robinhood |
| Five-day post-expiry average | ~ negative 1.0% | Bluekurtic Market Insights |
| Five-day post-expiry win rate | 26.9% positive since 2000 | Bluekurtic Market Insights |
| Post-expiry week average (since 1990) | ~ negative 1.05%, 27 of 35 lower | Stock Traders Almanac |
Volatility follows a similar rhythm. A Moonstone study of September triple witching from 2019 to 2024 found the pattern held every time.
The VIX pattern Across all six September triple-witching years examined by Moonstone (2019-2024), the VIX rose after the expiry, by approximately 4 points on average, with the move from bottom to top lasting roughly 10 business days.
The counterpoint deserves a fair hearing. A ThinkIndicators study spanning 20 years found triple-witching Fridays almost always close within 1% of the open, and that the dramatic exceptions of 2001 and 2008 were driven by external shocks, the 9/11 aftermath and the Lehman collapse, not by expiry mechanics. Alpha Strategic Growth argues along the same lines: the day itself carries no meaningful directional bias, and the volume is settlement flow rather than sentiment.
None of this guarantees a down week. What it establishes is a base rate. When structural and seasonal forces produce negative post-expiry outcomes nearly three-quarters of the time since 2000, the sensible move is to carry that probability into your thinking, particularly if you hold leveraged positions or short-dated options through next week.
Practical risk considerations for retail investors around tomorrow’s session
The most immediate hazard tomorrow is execution. With open auctions running around 10x larger than normal (roughly US$28 billion) and closing auctions about 5x larger (roughly US$80 billion), price discovery near the open and close becomes distorted, and market orders can fill at prices you would not have chosen.
The second trap is directional. The volume and volatility you see are products of options settlement mechanics, not conviction. As TD Ameritrade strategist JJ Kinahan has cautioned, movement at the open and close comes from unwinding baskets of stocks and futures, not directional opinion.
Traders should maintain a heightened sense that movement at the open and close is driven by unwinding baskets of stocks and futures, not directional opinion, says TD Ameritrade strategist JJ Kinahan.
If you hold options, the operational risks are real. Per FINRA, holders generally have until 5:30 p.m. ET on the day of expiration to decide whether to exercise, though your brokerage may set an earlier internal deadline. Out-of-the-money options expire worthless, while in-the-money short positions can be assigned, leaving you with shares or a margin call you did not plan for.
Four concrete adjustments are worth considering before the open:
- Use limit orders over market orders during the opening and closing windows, where auction sizes distort fills.
- Do not treat high volume as a bullish or bearish signal. It is settlement flow, not sentiment.
- Review any short options positions for assignment exposure before the 5:30 p.m. ET exercise deadline.
- Size positions conservatively. Moomoo’s options strategy guidance suggests keeping each options trade to 0.5-1% of account value, favouring defined-risk spreads over naked options, and using stops near key pin-strike bands.
Defined-risk spreads become especially relevant in this environment because zero-DTE contracts now account for roughly 65% of all SPX options volume, and structures such as butterfly spreads and call calendars allow traders to express a directional view or volatility thesis while capping maximum loss at the net debit paid, regardless of how aggressively gamma flows move the index.
Bookmap’s triple-witching guidance echoes the sizing point, recommending smaller positions to absorb slippage and gap risk.
The takeaway is not to sit out entirely. It is to recognise that tomorrow’s session rewards discipline around order type and position size in ways a quiet midweek session simply does not.
What the next five trading days will tell you that tomorrow cannot
Tomorrow is the loud part. The five trading days that follow are the informative part.
The day-of session is dominated by mechanical flow, settlement, and pinning. Once those structural hedges roll off, the market reprices risk on its own terms, and that is where the genuine signal about direction emerges.
Three variables are worth watching closely next week:
- Whether the S&P 500 holds above the zero-gamma pivot at roughly 7,672.80 on Monday’s open. Below it, dealer flows tend to extend moves rather than cushion them.
- The VIX trajectory over the following 10 business days, given Moonstone’s finding of an average 4-point rise across the 2019-2024 September expiries.
- Updated dealer gamma data for any shift back toward positive territory, which would signal returning shock absorption.
VIX futures structure adds a further layer to this trajectory: the futures curve sits in contango roughly 80% of the time, meaning any long-volatility position via ETPs continuously absorbs negative roll yield as it rolls expiring contracts into more expensive ones, a drag that can erode returns even when the directional volatility call proves correct.
None of this is a forecast. The historical base rate, negative post-expiry returns more than 73% of the time since 2000, is a risk input, not a prediction. The FOMC follow-through and the broader earnings backdrop will do the real work of setting next week’s direction.
The point is that triple witching is not a one-day event in its consequences. Its structural effects typically play out over the following two weeks, which gives you a longer and more useful decision window than most market commentary suggests. Track these variables, and you will be reacting to signal rather than noise.
This article is for informational purposes only and should not be considered financial advice. Investors should conduct their own research and consult with financial professionals before making investment decisions. Past performance does not guarantee future results. Financial projections are subject to market conditions and various risk factors.