
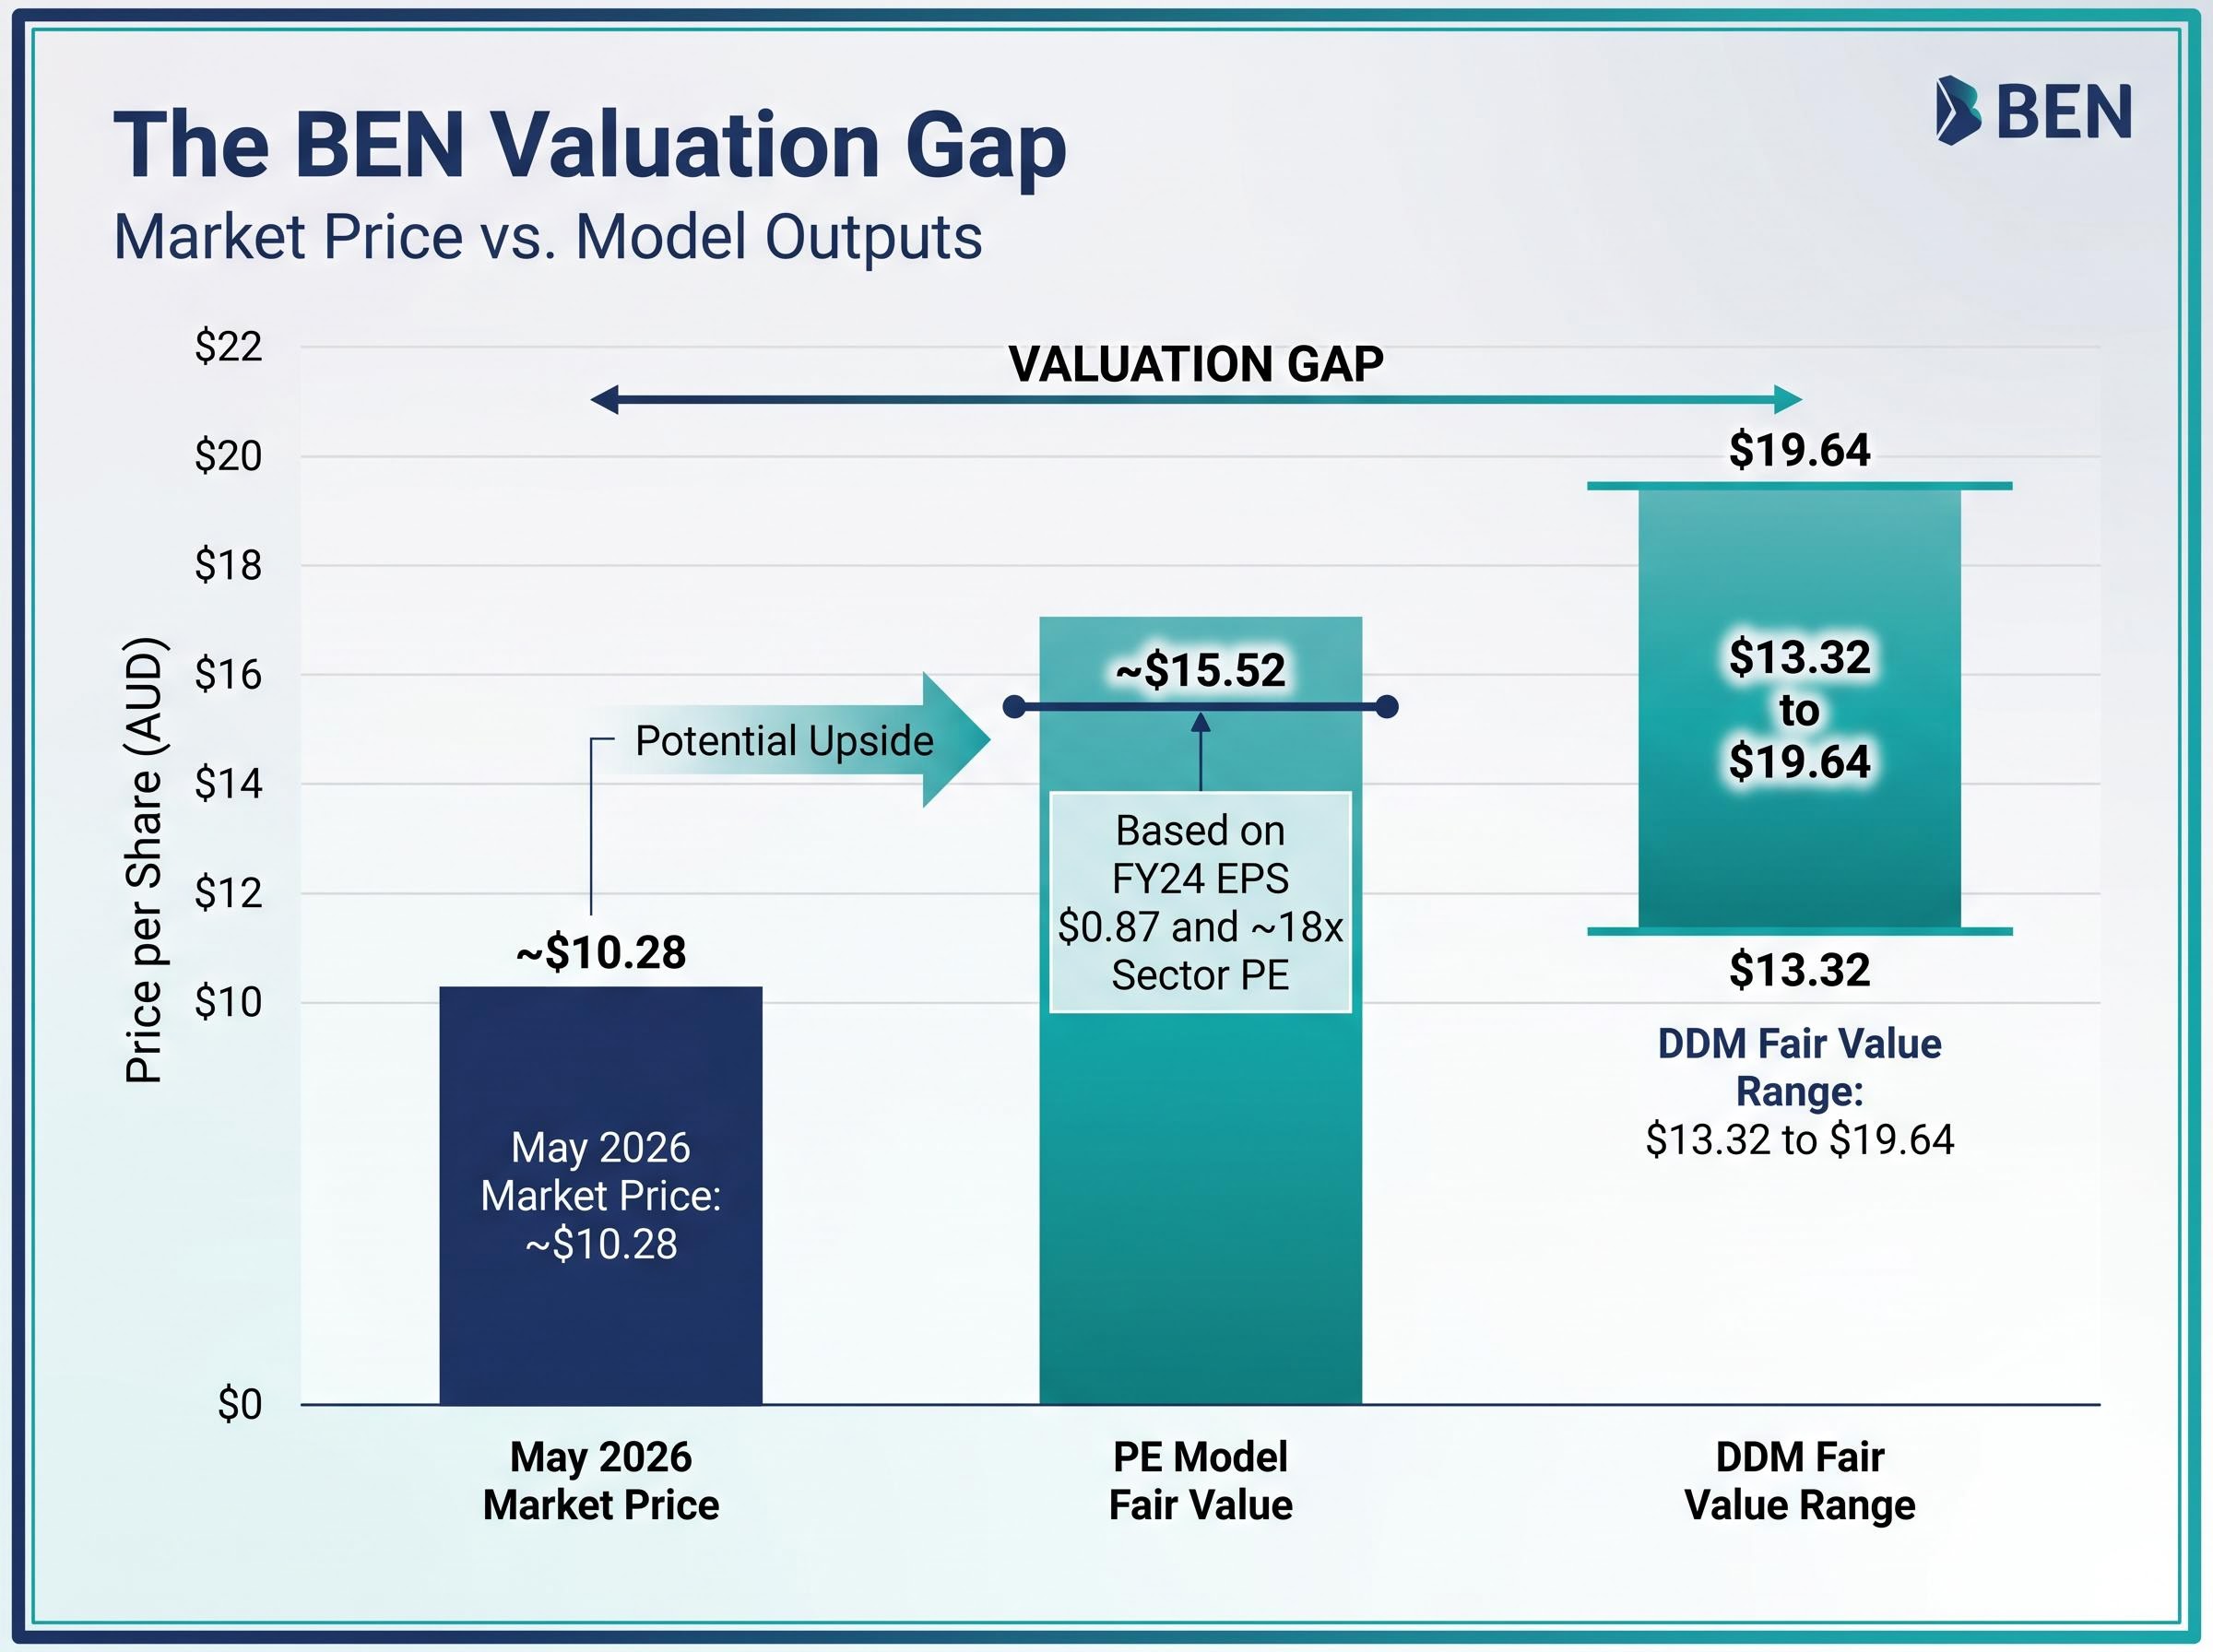
Standard valuation tools can make a compelling case for buying Bendigo and Adelaide Bank (BEN) shares. A price-to-earnings model, using FY24 earnings per share of $0.87 and the sector average PE of roughly 18x, implies a fair value of approximately $15.52. A dividend discount model produces a range of $13.32 to $19.64, depending on assumptions. Yet the market price in May 2026 sits at approximately $10.28. Both models point in the same direction, and the market disagrees with both of them.
For Australian retail investors, bank shares are familiar territory: reliable dividends, franking credits, and a handful of ASX names held for years. That familiarity, though, can make investors slow to interrogate the qualitative factors that determine whether a bank’s earnings and dividends are genuinely sustainable. With APRA and the RBA both flagging gradual increases in arrears and ongoing scrutiny of lending standards, this is a timely moment to look beyond the models.
This article explains the qualitative layer of bank analysis: what loan growth trends, credit loss provisions, and funding composition actually reveal, why PE ratios and dividend discount models cannot capture these risks on their own, and how to read the signals that appear in results presentations before they show up in a share price.
Why valuation models alone leave Australian bank investors exposed
The BEN valuation gap is not an anomaly. It is a demonstration of what happens when investors trust model inputs without questioning them.
PE and dividend discount models take reported earnings and dividends as their starting inputs. That means they inherit whatever credit assumptions, provisioning decisions, and funding cost pressures are embedded in those figures. If a bank’s reported profit is flattering its underlying position, the model faithfully amplifies the flattery into a higher fair value.
The PE valuation framework applied to BEN produces a sector-adjusted implied value of approximately $15.46 against a current price near $10.40, a 49% gap that raises the same question this article is designed to answer: whether the inputs driving that implied value can be trusted.
A bank’s reported profit is highly sensitive to three factors, each of which requires qualitative interrogation before it can be trusted as a model input:
- Earnings quality: Reported earnings reflect management’s provisioning choices. Conservative provisioning lowers reported profit today but signals a more realistic view of future losses. Aggressive provisioning releases inflate today’s profit at the expense of future resilience.
- Dividend sustainability: A dividend is only as durable as the earnings and capital buffer that support it. If capital management is aggressive relative to the credit cycle, current payouts may not be repeatable.
- Funding cost stability: A bank’s net interest margin depends on the cost of its funding. If that funding relies heavily on volatile wholesale markets, NIM can compress rapidly without any change in the loan book itself.
A valuation model tells you what a bank is worth if its inputs are correct. Qualitative analysis tells you whether the inputs can be trusted.
The qualitative checklist that follows is not a replacement for PE and DDM. It is the stress-test layer that makes model outputs meaningful. The BEN figures above are illustrative; the same framework applies to CBA, NAB, Westpac, ANZ, and BOQ.
When big ASX news breaks, our subscribers know first
What loan growth tells you about a bank’s risk appetite
Loan growth is the primary engine of bank revenue. A larger loan book generates more interest income. Faster growth, on the surface, looks like a good thing. It is not always.
Above-system loan growth almost always involves a trade-off. A bank growing its mortgage book noticeably faster than the industry benchmark is likely doing one or more of the following: pricing more aggressively, loosening underwriting standards, or shifting into higher-risk segments such as interest-only investor mortgages, SME lending, or commercial property. According to Morningstar analysis published in March 2024, overly rapid loan growth relative to peers is a red flag, particularly when concentrated in these higher-risk categories. AFR reporting by Tony Boyd in May 2024 cited episodes where banks that pursued above-system growth later suffered higher impairments.
Below-system growth carries its own signal. It can indicate a deliberate conservative stance, which is often a positive. But it can also reflect competitive disadvantage. BEN’s below-system loan growth in FY24, as reported by AFR Chanticleer columnist James Thomson in August 2024, illustrated this tension: a bank maintaining discipline in a competitive mortgage market, but constrained in its ability to grow earnings as a result.
“System growth” in the Australian context refers to the pace at which total credit is expanding across the banking sector, measured through APRA data and RBA credit aggregates. Investors can use these as benchmarks to assess where any individual bank sits.
Three loan-growth signals and what each means:
- Above-system growth: Potential risk appetite concern. Worth investigating which segments are driving the growth and whether pricing or underwriting standards have loosened.
- Below-system growth: Conservative stance or competitive disadvantage. The distinction depends on whether management is choosing discipline or losing market share.
- Rapid growth in specific high-risk segments: The most concerning combination. Fast growth in investor, interest-only, or commercial property lending, particularly alongside system-level caution, warrants close scrutiny.
Which loan segments carry higher risk
Not all loans carry equal risk. Prime owner-occupier mortgages, which make up the majority of the major banks’ books, represent the lowest-risk segment. Higher-risk categories include investor loans, interest-only loans, SME loans, and commercial property exposures.
APRA’s June 2024 Insight article on credit risk in a higher-rate environment flagged pockets of concern in high debt-to-income (DTI) lending (above 6x), high loan-to-value ratio (LVR) lending, and interest-only loans, particularly in investor segments. The RBA Financial Stability Review of October 2024 warned specifically about office and retail commercial property, noting that structural pressures from remote work and e-commerce were concentrated in some regional banks.
Reading credit loss provisions as a signal, not just a cost
Most investors glance at provisions for credit losses and move on. That is a missed opportunity. Provisions, also called loan impairment expenses, represent a management estimate of expected future losses on the loan book, recorded before those losses are realised. They are, in effect, a management commentary on the bank’s own view of what is coming.
Two qualitative reads matter here. The first is aggressive reserve releases during uncertain macroeconomic conditions. When a bank releases provisions to boost reported profit while arrears are still rising, it signals a management team prioritising short-term earnings optics over prudent risk management. The second is the opposite: maintaining or adding to expected credit loss overlays during uncertain conditions, a positive signal that management is being conservative.
Across the major banks in FY24, the pattern was consistent normalisation from unusually low post-COVID levels:
| Bank | FY23 Impairment | FY24 Impairment | Management Framing |
|---|---|---|---|
| CBA | $883M | $1.09B | Normalisation from very low levels |
| NAB | $737M | $880M | Return towards long-run averages |
| Westpac | $823M | $1.02B | Within historical ranges |
| ANZ | $564M | $765M | Portfolio quality “resilient” |
| BOQ | $73M | $118M | Legacy portfolio pressure |
The distinction in that final column matters. The RBA Financial Stability Review of March 2024 found that loan impairment expenses had risen from unusually low levels but remained well below long-run averages system-wide. For the four majors, the framing was normalisation, not stress. For BOQ, the language was different: legacy portfolio pressure in its retail and SME books, a more pronounced deterioration that reflected specific portfolio quality issues rather than broad cyclical adjustment.
Rising provisions that management frames as normalisation from historically low levels are a very different signal from rising provisions accompanied by language about specific portfolio deterioration.
Investors can locate these figures in the income statement (the impairment expense line) and in the accounting notes (criteria for classifying non-performing loans and the movement in provision balances). Analyst commentary, including from Morningstar and RBA/APRA publications, consistently favours banks maintaining prudent overlays during uncertain conditions rather than releasing reserves to flatter short-term profits.
How a bank funds itself, and why it matters to shareholders
Funding composition sounds like a back-office topic. It is not. The cost of a bank’s funding flows directly into its net interest margin, which flows directly into reported earnings, which flows directly into dividend capacity. Every shareholder is exposed to funding structure whether they know it or not.
Australian banks draw on two main funding sources. Retail customer deposits are the more stable and lower-cost option. Wholesale debt markets, where banks issue bonds to institutional investors, are more volatile and more sensitive to global conditions. According to an RBA Bulletin article published in June 2024, approximately 65% of major bank funding comes from deposits, 25% from wholesale debt, and the remainder from equity and other sources.
The RBA Bulletin analysis of Australian bank funding in 2024 set out the approximate composition across the sector, with deposits accounting for roughly 65% of major bank funding, wholesale debt around 25%, and the remainder from equity and other instruments, providing the system-level benchmark against which individual bank funding profiles should be assessed.
The major banks also access offshore bond markets, issuing in US dollars, euros, and yen. All foreign currency borrowing is hedged back to Australian dollars via cross-currency swaps, which eliminates the direct currency risk. However, the cost of accessing those markets, the credit spread, is volatile and not eliminated by hedging.
Here is how the chain of cause and effect works:
- Global risk sentiment rises.
- Offshore credit spreads widen.
- Wholesale funding costs increase for Australian banks accessing those markets.
- Net interest margin compresses as funding costs rise faster than lending rates.
- Reported earnings decline.
- Dividend capacity is constrained.
AFR reporting by Karen Maley in July 2024 noted that US dollar wholesale spreads were 20-40 basis points wider than in 2021, directly pressuring funding costs as Term Funding Facility liabilities rolled off. The impact was not uniform. Banks with stronger retail deposit franchises were more insulated.
| Bank | Deposit Share of Funding | Offshore Wholesale Reliance |
|---|---|---|
| BEN | ~80% | Low |
| BOQ | ~74% | Moderate |
| CBA | ~73% | Moderate |
| Westpac | ~72% | Moderate |
| NAB | ~70% | Moderate |
| ANZ | ~69% | Moderate-High |
AFR reporting by Vesna Poljak in October 2024 highlighted BOQ as a case study in funding disadvantage: a weaker deposit franchise and higher wholesale spreads contributed to sharper NIM decline than the majors experienced.
What hedging does (and does not) protect against
Cross-currency swaps eliminate the currency risk on offshore borrowings. If a bank borrows in US dollars and swaps back to Australian dollars, movements in AUD/USD do not affect the cost of that debt.
What hedging does not eliminate is the cost risk. If spreads in US dollar credit markets widen, the bank still pays more to borrow at the next rollover, regardless of the currency hedge. Wholesale debt must be refinanced at maturity, and if global credit markets are stressed at that point, costs rise and NIM is squeezed. APRA’s consultation on revisions to APS 210 and APS 220, released in September 2024, reinforced expectations that banks manage both FX and rollover risk with documented scenario analysis.
Wholesale funding cost transmission from offshore credit markets to Australian bank NIMs operates through channels that do not appear in domestic loan quality data, with APRA’s May 2026 System Risk Outlook identifying geopolitical instability and offshore private credit stress as risks that standard domestic stress tests were not designed to fully capture.
The qualitative checklist in practice: management signals, capital buffers, and cost discipline
The preceding sections covered the individual qualitative dimensions. This section consolidates them into a diagnostic posture investors can apply at each reporting season.
CEO and CFO commentary in results presentations is a qualitative data source in its own right. Direct, specific language about credit standards and risk appetite is a positive signal. Analyst guidance, including from Rask’s Australian Finance Podcast in May 2024, recommended treating vague or overly promotional language about growth as a red flag if not backed by detailed risk metrics.
Capital adequacy adds another layer. APRA’s February 2024 Information Paper set out the “unquestionably strong” Common Equity Tier 1 (CET1) expectation, approximately 10.5% in practice, and stress tests showed major banks remaining above minimums under severe scenarios. According to a Morningstar sector update in April 2024, large buybacks or special dividends while credit conditions are tightening can be a negative qualitative signal, suggesting a management team prioritising shareholder returns over cycle preparedness.
Cost discipline rounds out the checklist. High cost-to-income ratios, particularly where elevated costs are described as “one-off” but recur across multiple reporting periods, signal either operational inefficiency or ongoing remediation and compliance spend that constrains dividend growth. BOQ illustrated this pattern across FY24 and FY25, with remediation and technology investment contributing to elevated costs and limited dividend capacity.
APRA and ASIC scrutiny of a bank’s governance and compliance track record is a leading indicator of future remediation costs, not a trailing one.
The six-question diagnostic checklist for each reporting period:
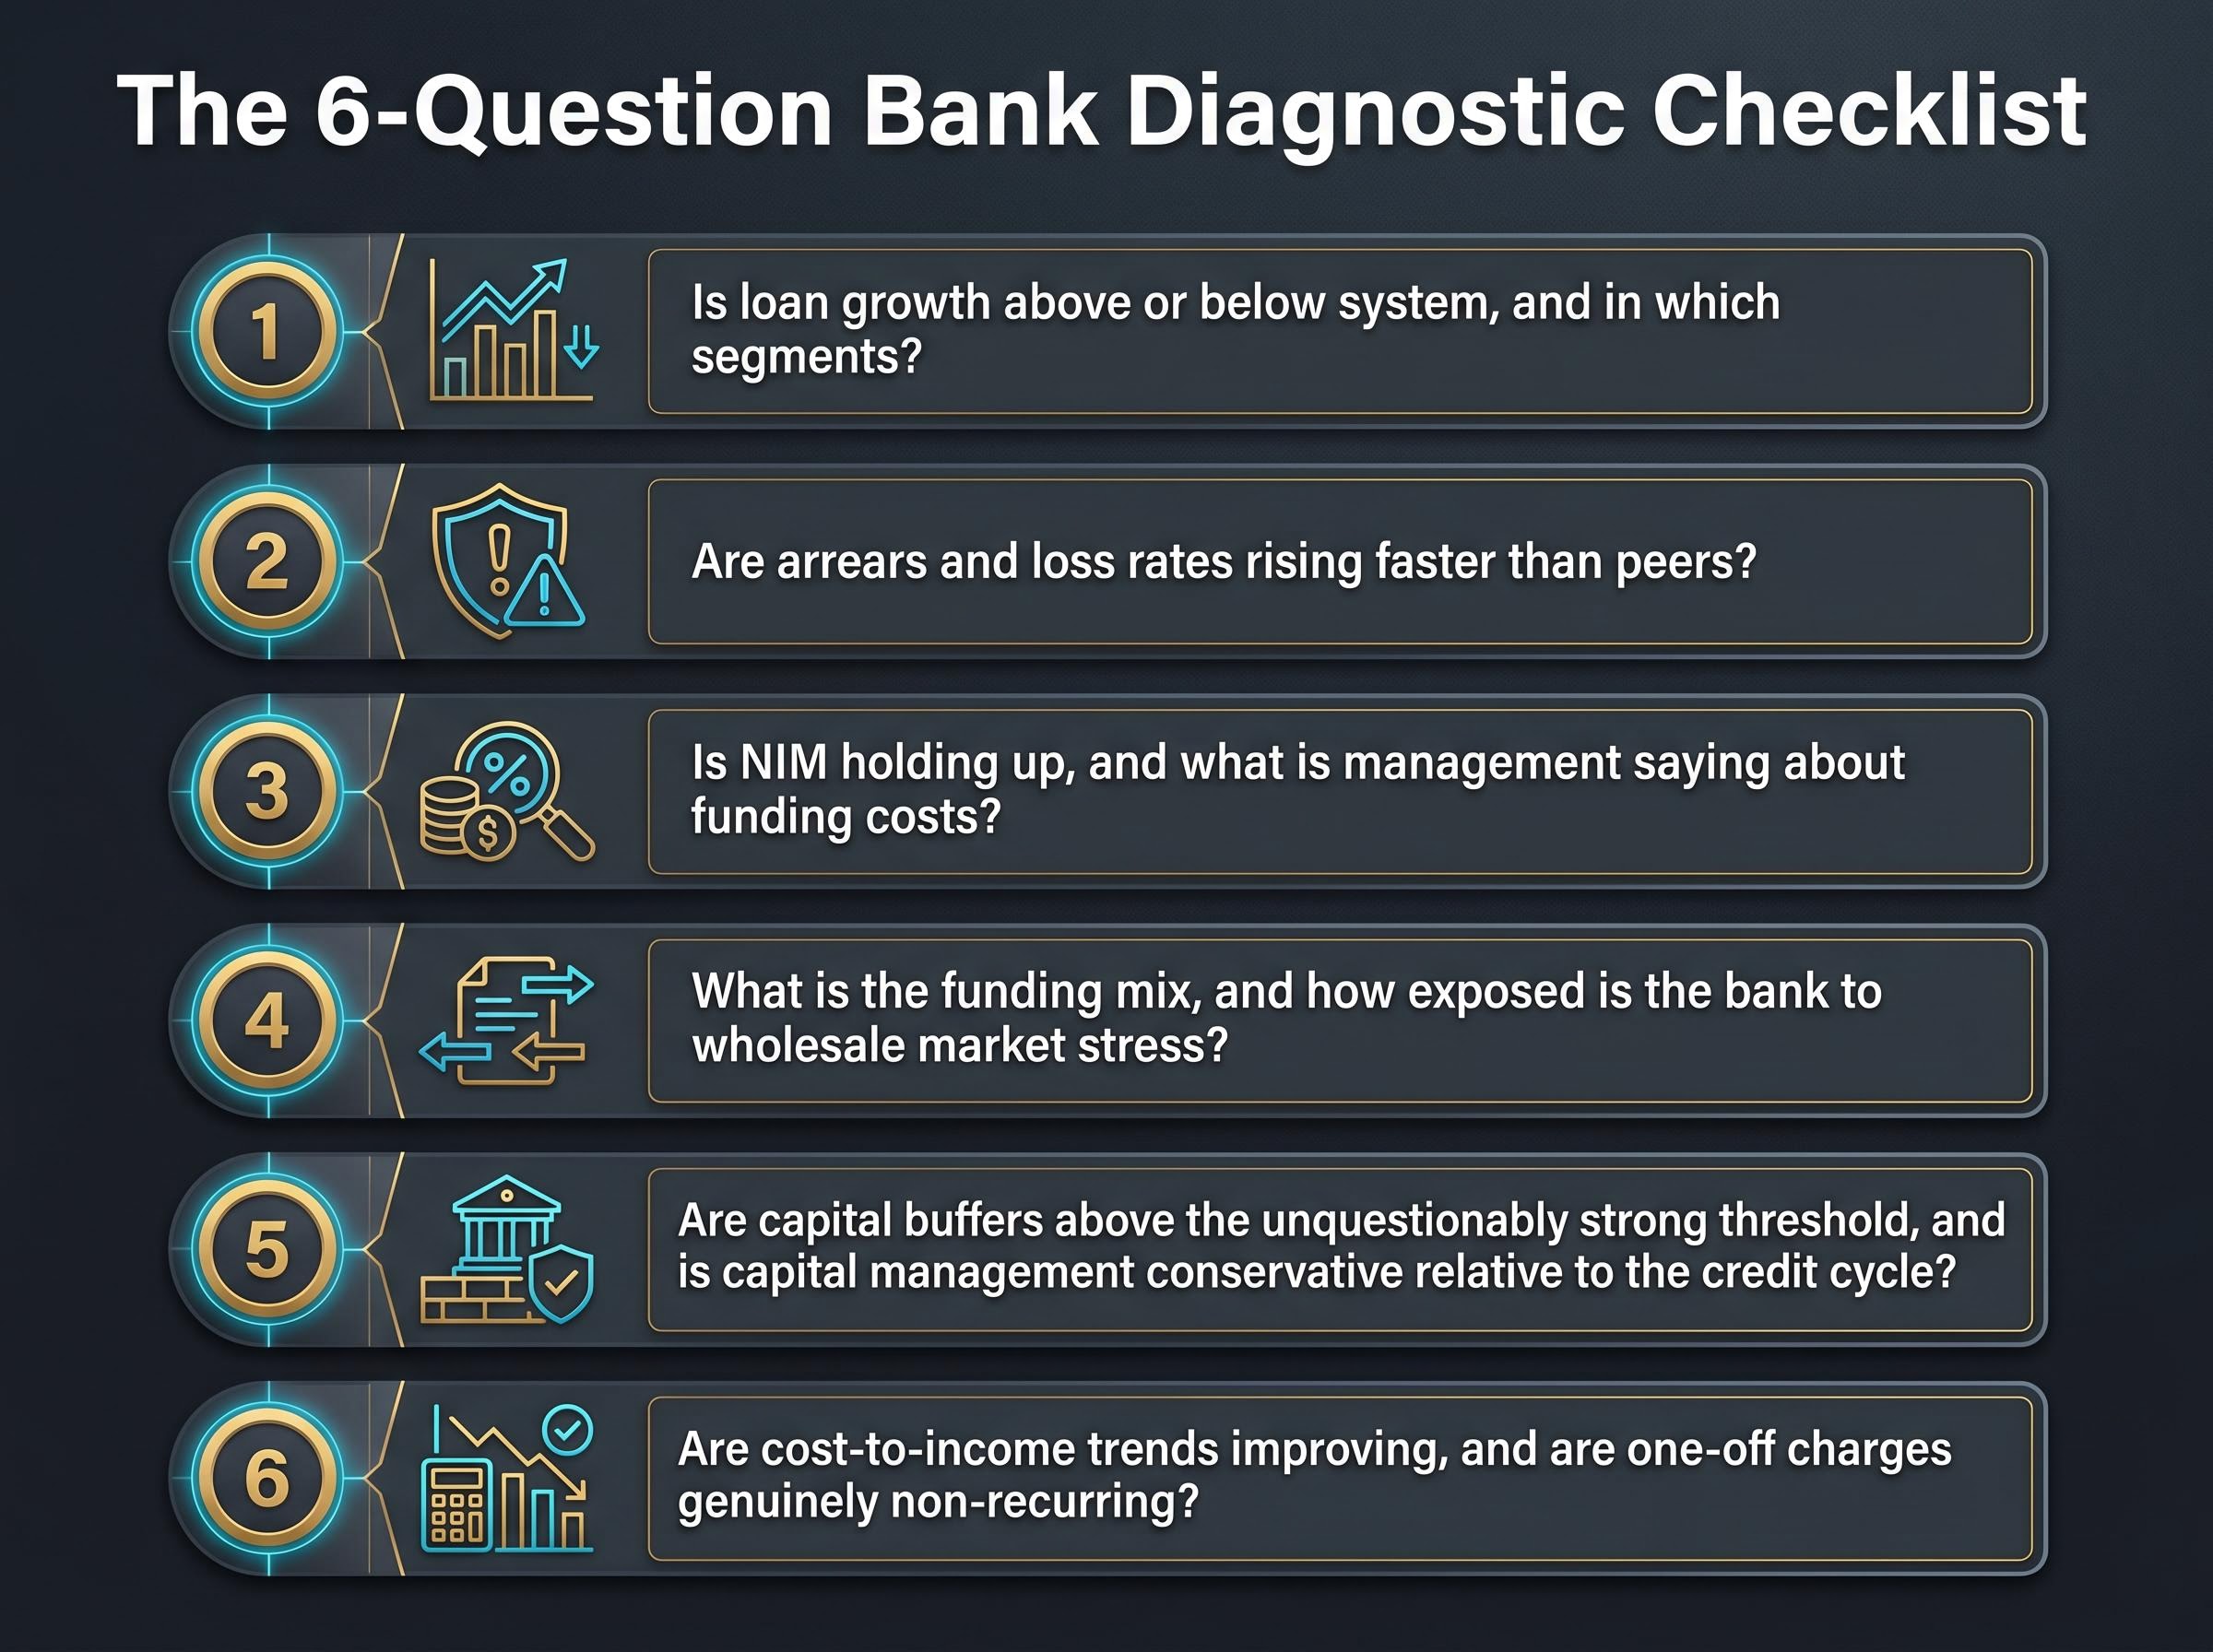
- Is loan growth above or below system, and in which segments?
- Are arrears and loss rates rising faster than peers?
- Is NIM holding up, and what is management saying about funding costs?
- What is the funding mix, and how exposed is the bank to wholesale market stress?
- Are capital buffers above the unquestionably strong threshold, and is capital management conservative relative to the credit cycle?
- Are cost-to-income trends improving, and are “one-off” charges genuinely non-recurring?
The signals that appeared in BOQ and BEN before the market caught up
Frameworks are only as credible as their track record. Two ASX-listed names illustrate how the qualitative checklist maps onto observable outcomes.
What the checklist would have shown for BOQ
BOQ presented the clearest pattern. In FY24, loan impairment expense rose to $118 million from $73 million in FY23. The 90+ day past-due and impaired assets ratio climbed to 1.18% from 1.04%. NIM declined more sharply than at the majors, driven by a weaker deposit franchise and higher wholesale funding costs. The cost-to-income ratio remained elevated from ongoing remediation and technology spend, and AFR reporting by Vesna Poljak in October 2024 detailed the compounding effect of these pressures.
Every one of these signals was visible in publicly available results disclosures. Investors who asked the six diagnostic questions would have identified: above-peer arrears, NIM underperformance, wholesale funding disadvantage, recurring costs described as transitional, and limited capital buffer headroom relative to the majors. Share price underperformance relative to the major banks became entrenched across 2023-2025.
CBA’s Q3 2026 provision top-up of $200 million, added while personal loan arrears spiked 30 basis points in a single quarter, is a live example of the pattern the diagnostic checklist is designed to catch: headline profit holding firm while the asset quality slide tells a different story.
What the checklist would have shown for BEN
BEN told a different but equally readable story. In FY24, loan impairment expense rose to $76.9 million from $52.5 million in FY23. The 90-day past-due and impaired assets ratio moved to 0.66% from 0.59%. Loan growth ran below system. NIM faced pressure from aggressive pricing by the majors in the competitive mortgage market.
The checklist would have shown: below-system loan growth (competitive constraint), NIM pressure, modest but rising arrears, limited offshore exposure (a positive), and conservative LVR positioning (also a positive). There was no acute credit stress, but earnings growth constraints were visible in management commentary. AFR Chanticleer columnist James Thomson framed these as qualitative constraints on profit growth in August 2024, and subsequent reporting confirmed the pattern.
Six qualitative warning signals synthesised from these cases, applicable across the sector:
- Persistent NIM compression driven by weaker deposit franchise or higher wholesale funding reliance
- Above-peer arrears and higher impairment charges, particularly in riskier segments
- High commercial property concentration and exposure to structurally challenged segments
- Elevated cost-to-income ratios from ongoing remediation or compliance spend
- Governance or risk-culture weaknesses flagged by regulatory scrutiny
- Below-system loan growth combined with margin pressure, signalling competitive disadvantage
The RBA Financial Stability Review of October 2024 warned specifically about commercial property concentrations at some regional banks, with office and retail property under structural pressure, reinforcing that regulator commentary is itself a qualitative signal investors should monitor.
Putting qualitative analysis to work before the next reporting season
Knowing what to look for is half the task. Knowing where to look completes it.
The specific documents investors should consult for each qualitative factor are: results presentations and ASX announcements for loan growth, NIM, provisions, and management commentary; APRA and RBA publications (Financial Stability Reviews, APRA Insight articles, Annual Reports) for system-level lending standards and regulatory risk focus.
Within a results presentation, the relevant figures sit in predictable locations: the income statement for impairment expense, the funding slide for deposit and wholesale shares, the capital adequacy slide for CET1 ratios, and the asset quality slide for arrears and impaired assets ratios.
A four-step research sequence for each reporting period:
- Download the most recent results presentation from the ASX announcements page.
- Locate the asset quality, funding, NIM, and capital slides and record the key metrics.
- Compare those metrics to the previous period and to stated peer benchmarks in the presentation.
- Read the CEO and CFO commentary sections specifically for language about risk appetite, credit standards, and funding costs, noting any vague or evasive framing.
The qualitative checklist is a complement to valuation models, not a substitute. Use PE and DDM to establish a price anchor, then use the checklist to decide whether the inputs to those models are trustworthy.
APRA’s current supervisory priorities, from the APRA Annual Report 2025-26, include housing lending standards, commercial property, cyber risk, climate risk, and operational resilience under CPS 230. APRA activated limits on high DTI lending from February 2026. The RBA Financial Stability Review of March 2026 reported that NPLs remained low by historical standards, with credit quality stabilising in 2025.
APRA’s activation of high DTI lending limits from February 2026 represents one of the most direct macroprudential interventions in the Australian mortgage market in years, restricting new lending above 6x income and adding a system-level constraint that qualitative bank analysis must now account for alongside individual lender behaviour.
Arrears are low, but the cycle has moved. The qualitative framework is most valuable precisely in the period when headline NPL numbers look reassuring.
This article is for informational purposes only and should not be considered financial advice. Investors should conduct their own research and consult with financial professionals before making investment decisions.
The qualitative layer is where informed bank investors find their edge
PE ratios and dividend discount models are valid starting points. They are also only as reliable as the underlying business quality that produces the earnings and dividends they discount. Qualitative analysis is the tool for assessing that quality.
The six diagnostic questions do not require professional training to apply. All the relevant data is publicly available in ASX results presentations and free APRA and RBA publications. The BEN case demonstrates the principle clearly: a PE-implied valuation of $15.52 and a DDM range of $13.32 to $19.64 against a market price of $10.28 is not an obvious buy signal once the qualitative layer is applied. It is an invitation to ask whether the inputs to those models reflect a structural disadvantage that the market has already priced in.
At the system level, APRA’s stress tests show the major banks remaining above minimum capital requirements under severe scenarios, and CET1 ratios sit comfortably above the unquestionably strong benchmark. Systemic soundness, however, is not the same as individual bank quality differentiation. The qualitative checklist is what separates the two.
With APRA having activated high DTI limits in February 2026 and the RBA reporting gradual credit quality stabilisation, this is an active period for qualitative bank analysis. Headline valuation multiples will continue to suggest bargains where none exist, and the investors best positioned to tell the difference are those who ask the six questions before they run the model.
Valuation models tell you what a bank is worth if the inputs are right. Qualitative analysis is how you find out whether they are.