
Every headline inflation metric has come in below forecast since the last Federal Open Market Committee (FOMC) meeting. Full-time employment has shed more than a million positions over recent months. Personal and small business bankruptcies are trending sharply upward. Yet the Federal Reserve has left rates unchanged for five consecutive meetings, and most professional forecasters expect no cuts through the end of 2026.
The disconnect between what real-time data is signalling and what the Fed is actually doing is not accidental. It reflects a deliberate institutional posture: the Fed moves on official series, not high-frequency proxies, and it moves slowly. Understanding that gap, and what would need to close it, is where the real analytical work lives right now.
Here is the specific evidence driving the consumer stress narrative, what is confirmed versus what is contested, and the conditions that would actually shift Fed rate cut timing. If you have been watching the headlines without a framework for connecting them, this builds one from the data up.
Every core inflation metric is printing below forecast
Since the most recent FOMC meeting, every core inflation reading that has landed has missed to the downside. The specific misses:
- Import prices excluding automobiles printed below expectations
- Producer Price Index (PPI) came in softer than forecast
- Core CPI undershot consensus
That pattern is not one weak print. It is a directional signal across the full suite of price gauges the market watches most closely.
What real-time data leads, official series confirm slowly
Truflation, which monitors approximately 15 million prices daily using transaction-level data, currently reads core inflation at roughly 1.62%. Its headline range has sat between 1.2% and 1.7% in recent months, both well below the Fed’s 2% target.
Truflation’s core inflation reading of approximately 1.62% sits meaningfully below the Fed’s 2% benchmark, a gap that real-time data has been flagging for months before official series catch up.
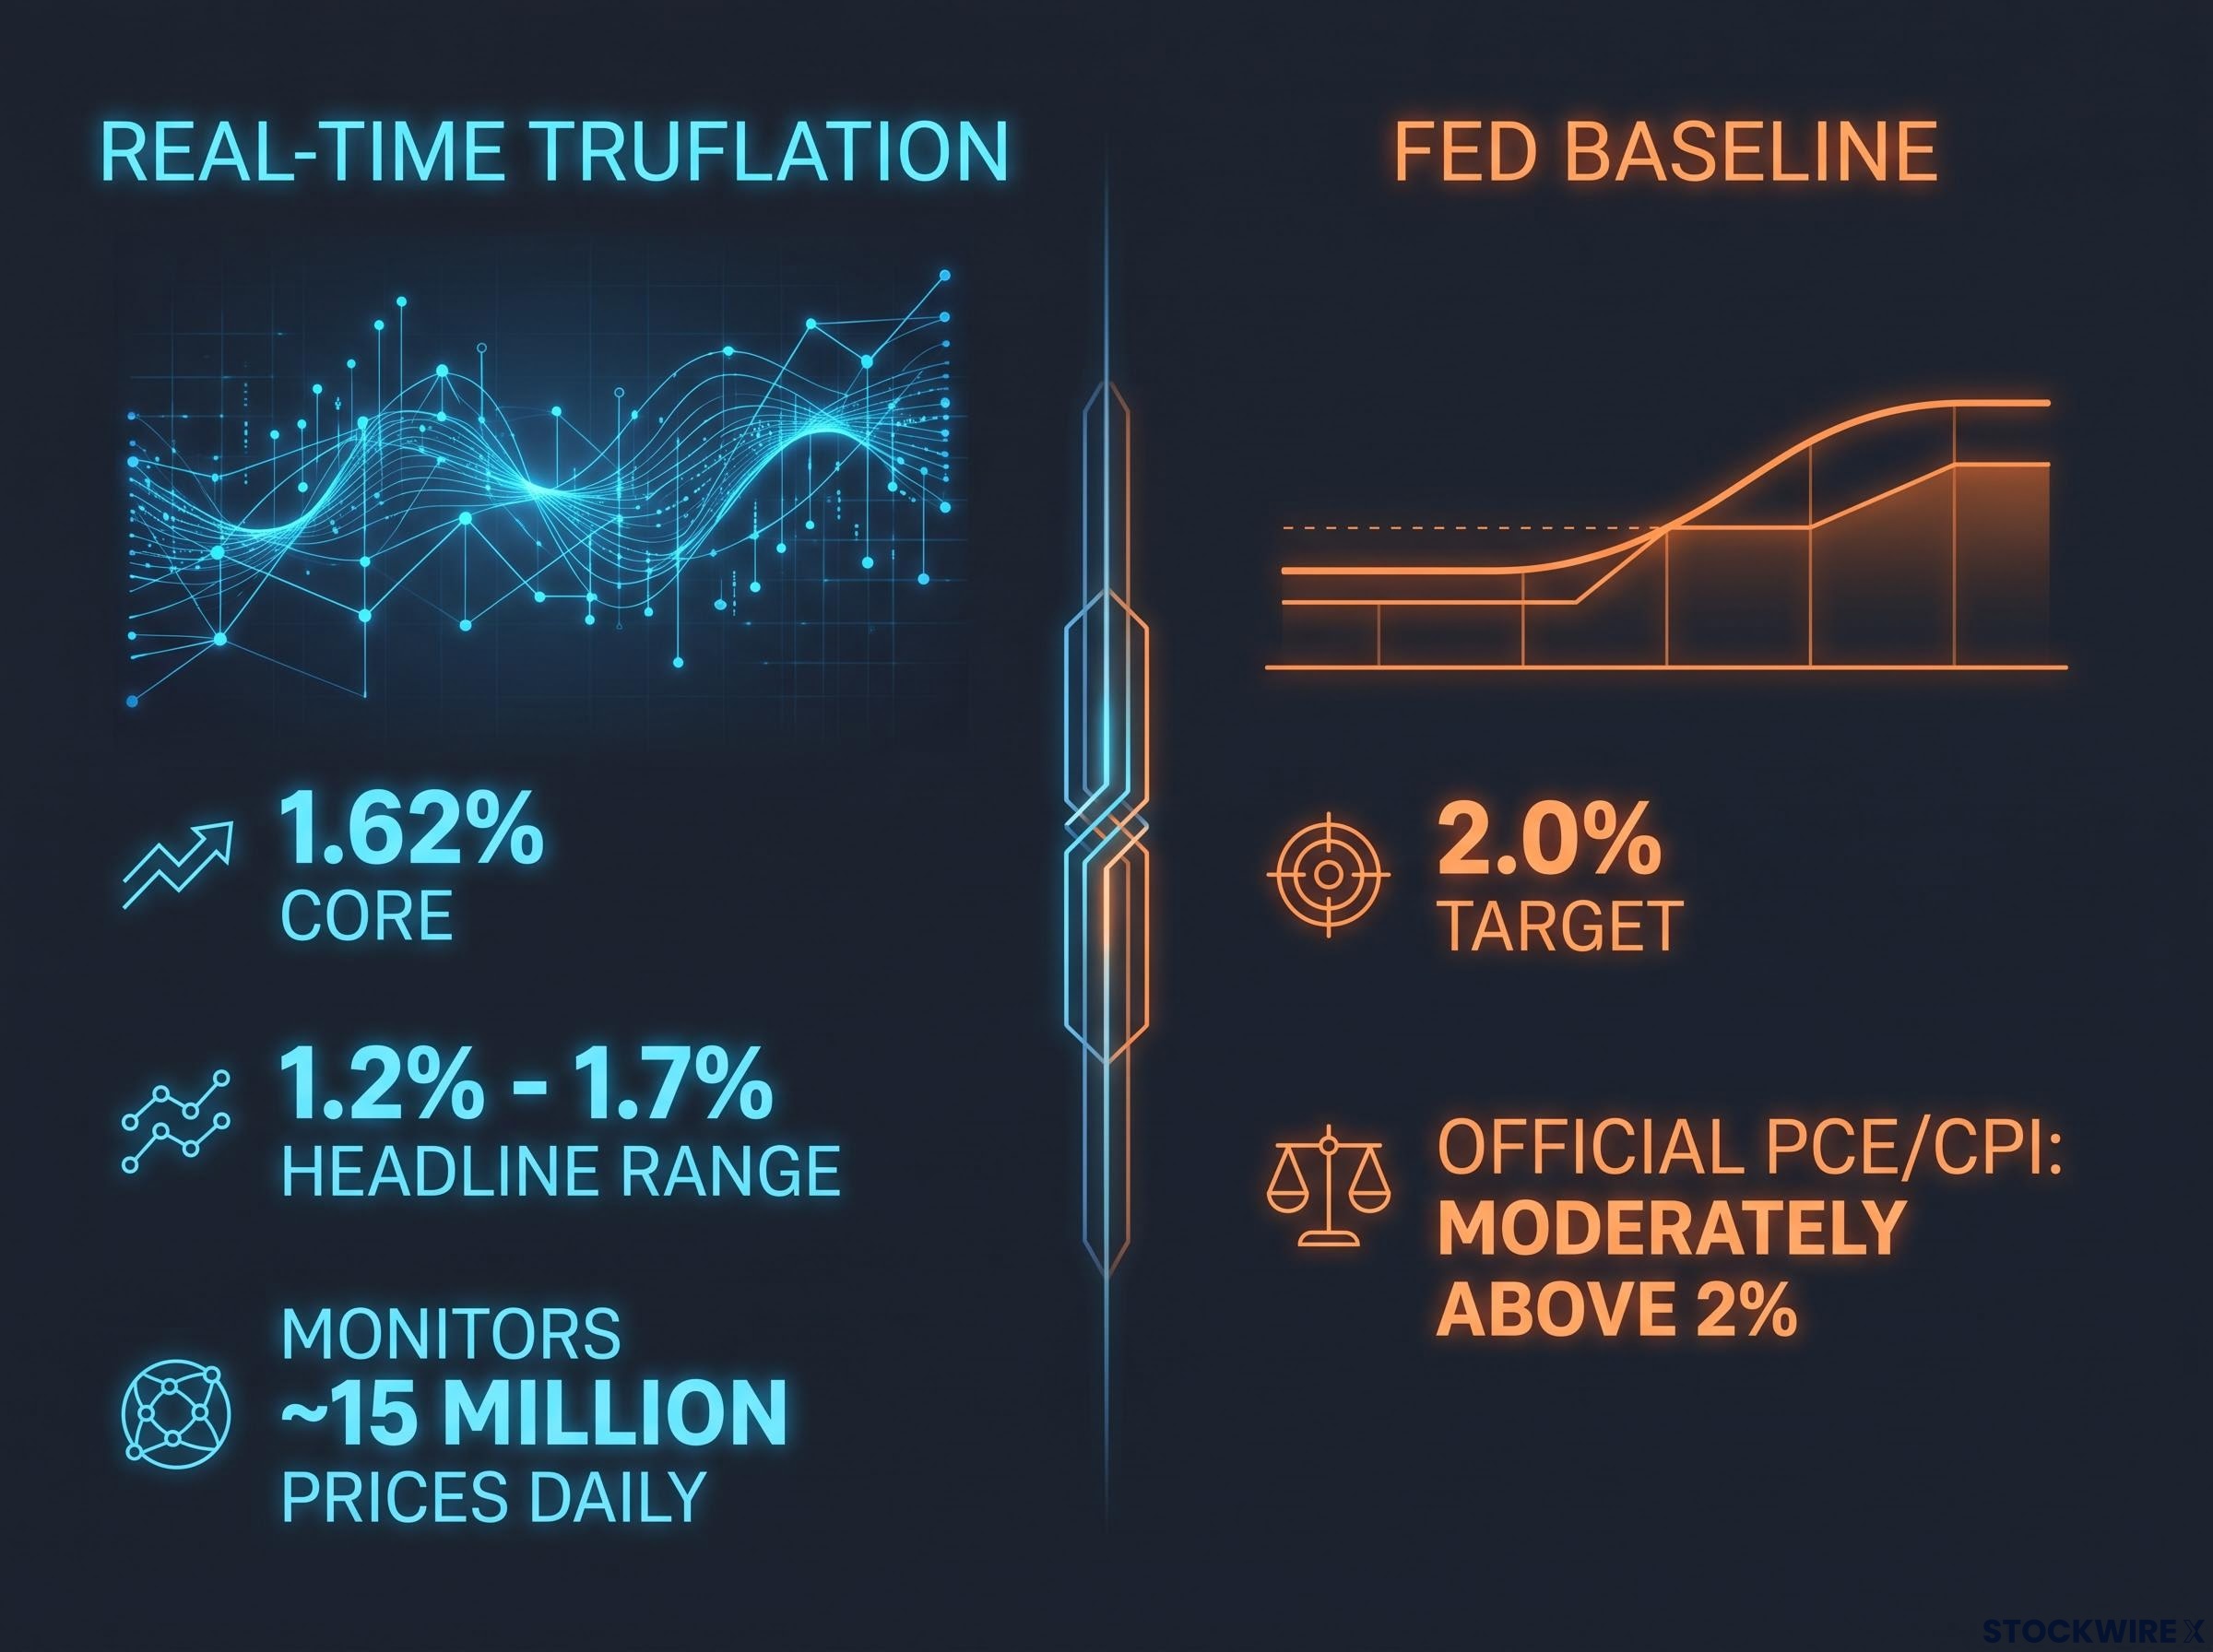
High-frequency tools like Truflation tend to lead government releases. They do not replace them for policy decisions. The Fed anchors on official Personal Consumption Expenditures (PCE) and Consumer Price Index (CPI) data, both of which remain moderately above 2% on a trailing basis.
The country’s largest retailers, Target, Home Depot, and Lowe’s, have flagged in recent earnings that shoppers are restricting spending to necessities, with discretionary purchases falling away. University of Michigan survey data has softened as well, with Americans growing less confident that wage growth will keep up with the cost of living. These are supporting signals, not policy triggers.
What this tells you is straightforward: the inflation side of the Fed’s mandate is trending toward compliance. But “trending toward” and “durably at” are two very different standards in the Fed’s institutional vocabulary, and only the second one triggers a rate cut.
When big ASX news breaks, our subscribers know first
The labour market is weaker than the headline unemployment rate suggests
Headline unemployment sits at levels that look manageable on a dashboard. The composition underneath those numbers tells a different story.
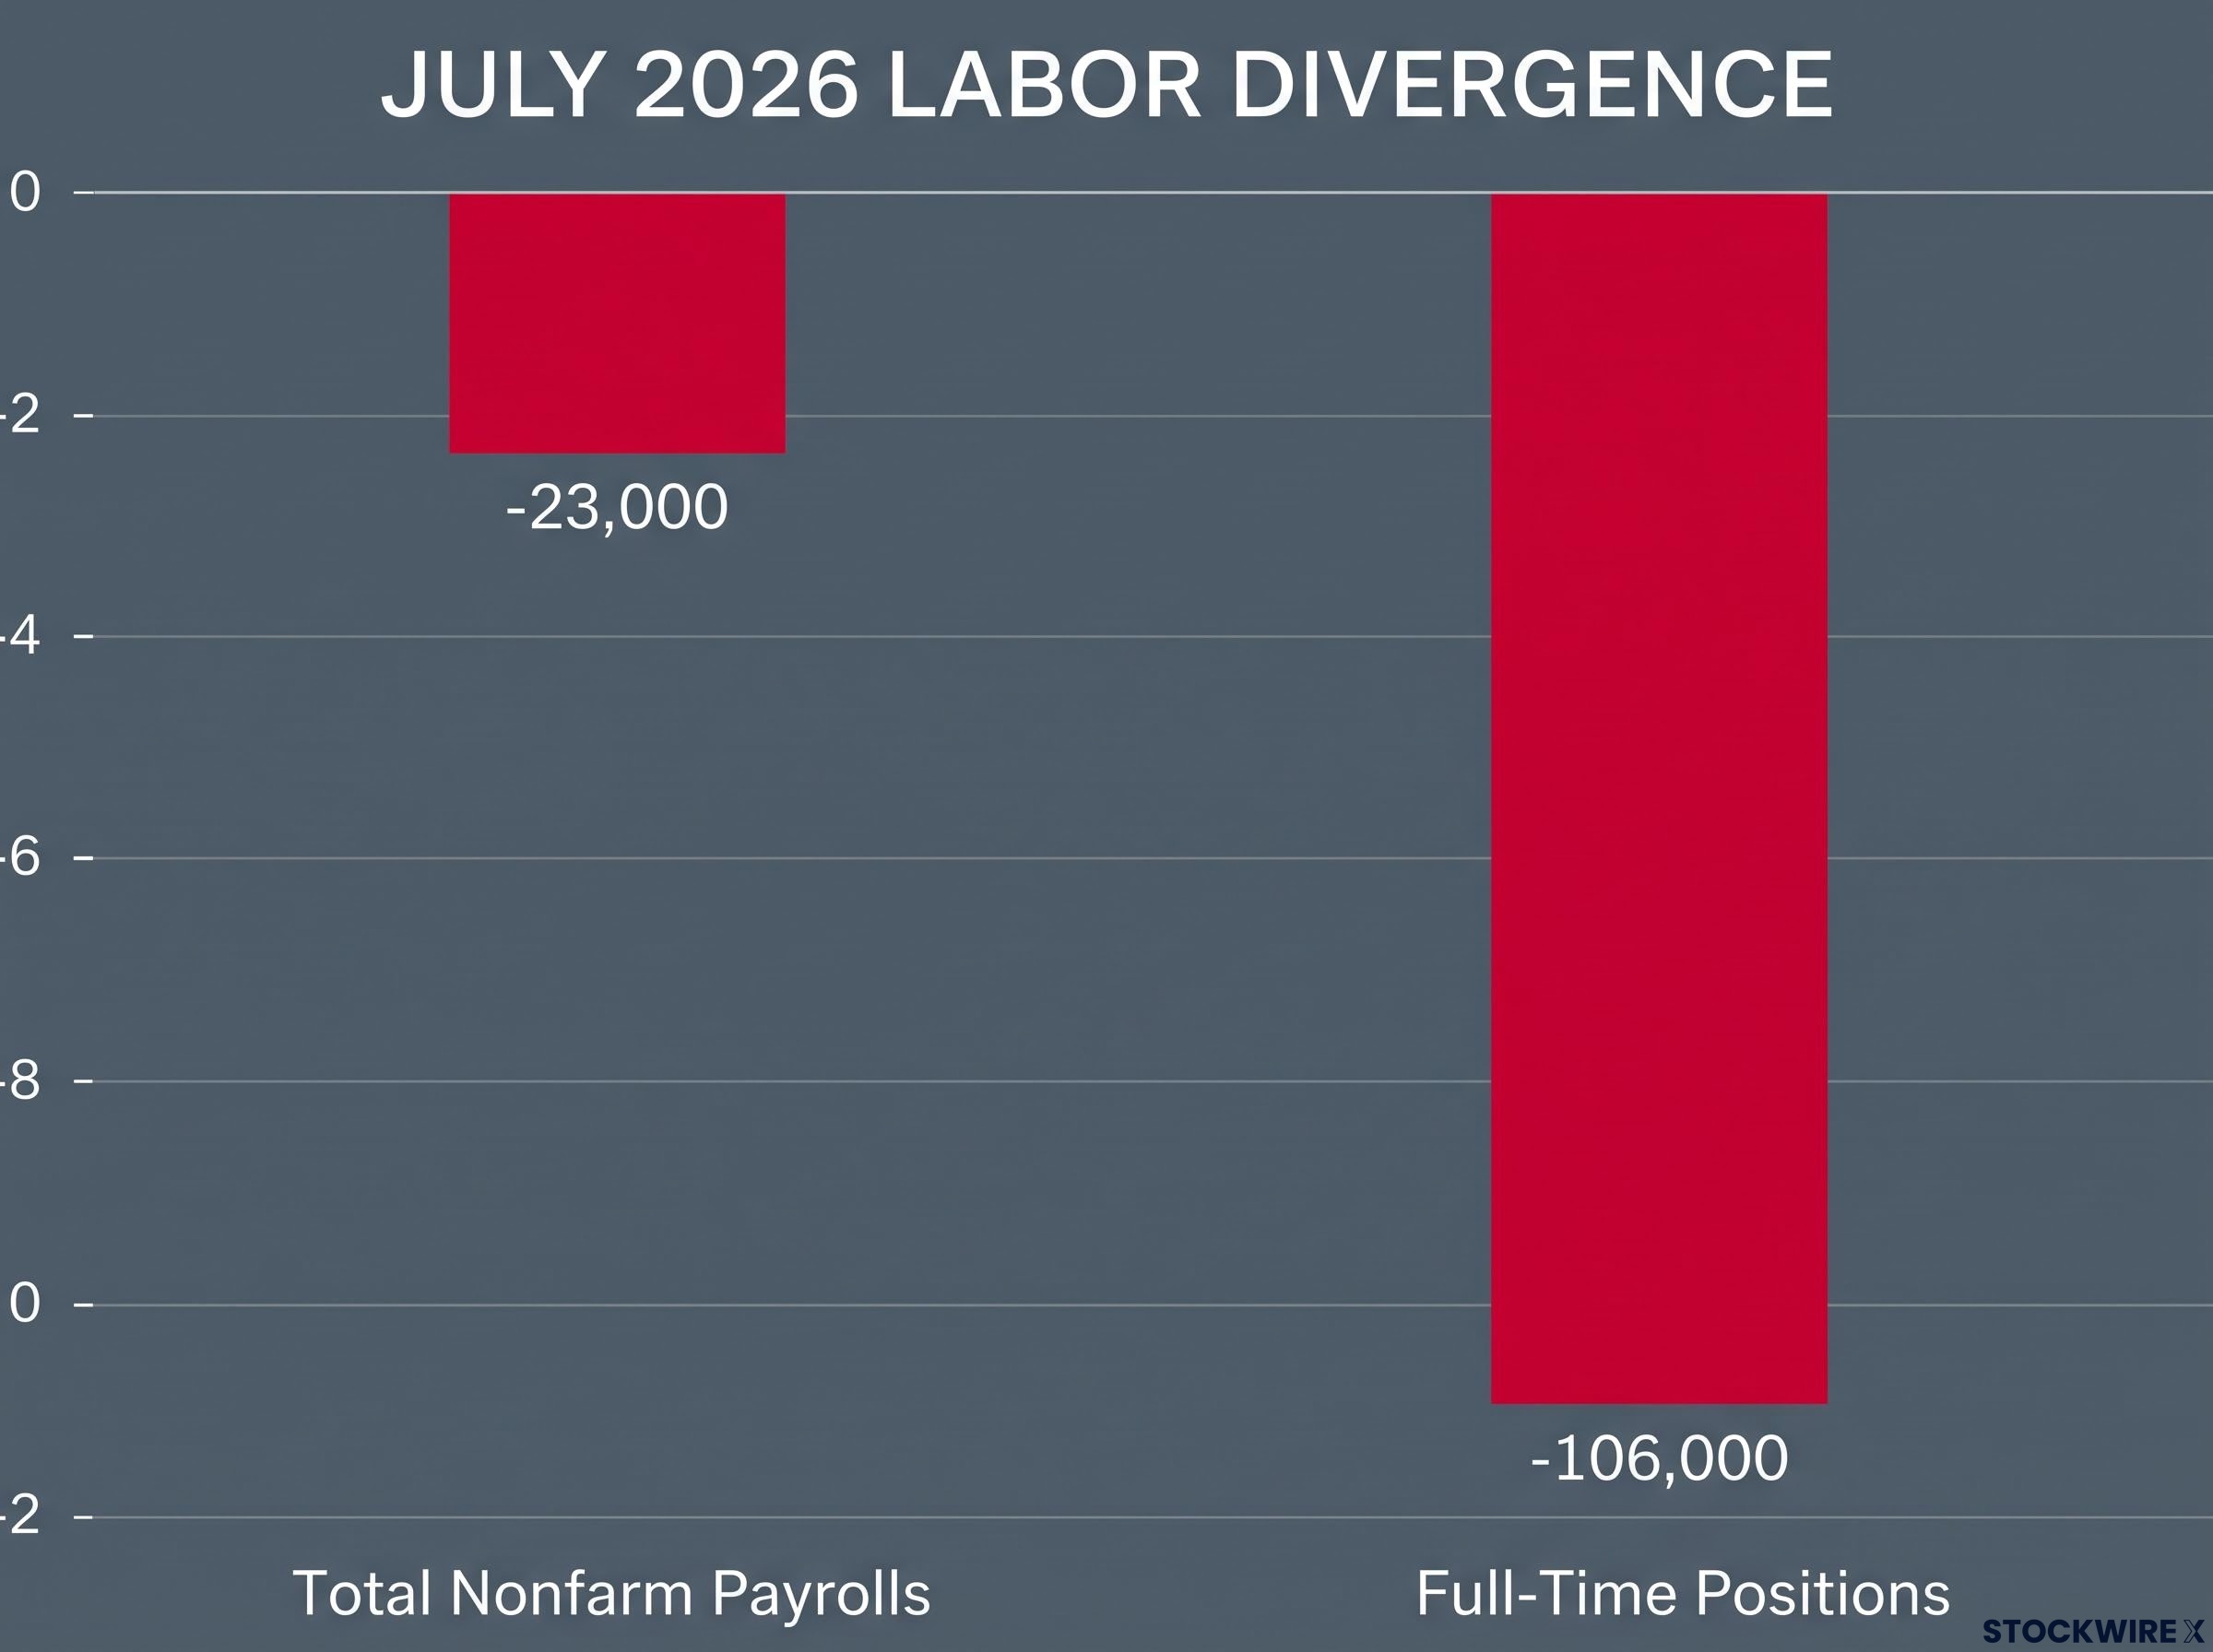
In July 2026, full-time employment fell by approximately 106,000 positions. Total nonfarm payrolls declined by an unexpected 23,000. These are distinct metrics: one measures the quality of employment, the other its quantity. Both moved in the wrong direction simultaneously.
| Period | Event | Headline figure | Full-time employment change |
|---|---|---|---|
| February 2026 | Unexpected payroll decline | -92,000 jobs; unemployment rose to 4.4% | Decline (part of broader trend) |
| July 2026 | Payroll miss and full-time contraction | -23,000 nonfarm payrolls | -106,000 full-time positions |
Analyst estimates place cumulative full-time job losses at approximately 1.6 million since late last year. That figure is directionally consistent with Bureau of Labour Statistics (BLS) data showing full-time employment no longer making new highs, though the precise magnitude depends on the reference month and should be treated as an analyst-level estimate rather than a single confirmed BLS release.
BLS household employment data for July 2026 separates full-time from part-time positions, providing the granular composition breakdown that headline payroll releases smooth over and the series that most directly reveals the quality deterioration the nonfarm payroll number obscures.
The labour force participation rate has been declining. According to Census Bureau data, the pace of job creation is not keeping up with the number of people entering the workforce. The headline payroll number cushions the picture with part-time positions; the full-time composition erodes it.
For you, the distinction matters because full-time positions drive consumer spending capacity. A labour market generating mostly part-time substitutes is generating less actual household income than the payroll headline implies, and income is what sustains the consumption that powers roughly 70% of U.S. GDP.
What consumer balance sheets actually look like right now
The stress is not concentrated in one indicator. It is showing up across the full width of household financial health.
- Personal bankruptcies are trending materially above the abnormally low pandemic-era baseline (the direction is confirmed; exact magnitudes remain unverified in official releases)
- Small business bankruptcies are rising year-over-year
- Credit card lending standards have tightened
- Credit union lending for vehicle purchases has tightened, making car financing harder to secure
- Consumers are turning to buy now, pay later (BNPL) services for everyday grocery spending once credit card limits have been reached
That last point comes from the Federal Reserve’s own research.
A Federal Reserve report on BNPL usage found that financially stretched households are relying on instalment payment services to cover grocery bills after reaching the limits on their credit cards.
When the institution that sets borrowing costs publishes a report showing consumers buying groceries on instalments, it signals that elevated rates have reached the household balance sheet in ways that aggregate spending figures can obscure. University of Michigan data confirms the direction: consumer sentiment is clearly softer than at any point in the post-pandemic recovery, with Americans reporting rising concern about the affordability of debt at current rate levels.
The U.S. national debt has now crossed close to $40 trillion, a figure that has roughly doubled since the period before the COVID pandemic. At the household, corporate, and government levels, equivalent interest rate levels are materially more consequential today than they were even a decade ago. The debt load amplifies every basis point.
Consumer spending accounts for approximately 70% of U.S. GDP. A structurally weakened consumer balance sheet is not a sentiment story. It is a growth story with direct implications for corporate earnings and credit quality.
Consumer debt health data presents a more layered picture than any single indicator captures: credit card delinquencies have reached a 15-year high, but household net worth simultaneously sits at a record high, and stress remains concentrated among younger and lower-income cohorts rather than distributed evenly across the borrower base.
How the Fed’s dual mandate creates the policy bind readers are watching
The Fed operates under a dual mandate, established in the late 1970s, requiring it to simultaneously pursue maximum employment and price stability. When both objectives pull in the same direction, policy is straightforward. When they pull in opposite directions, as they do now, the institution faces a genuine bind.
Inflation data is softening. Labour quality is deteriorating. Consumer balance sheets are under stress. Housing is near historic lows. The case for easing is building. Yet the Fed has held the federal funds rate at 3.50-3.75% for five consecutive meetings.
The bind explains the hold: cutting prematurely risks reigniting inflation that is not yet durably at target on official measures. Holding too long risks deepening a consumer downturn that is already visible in real-time data. The Fed’s institutional bias is to err on the side of waiting.
Milton Friedman’s insight into long and variable lags remains the structural reason the Fed’s institutional bias runs toward waiting: policy effects on real economic activity can take well over a year to materialise, meaning rate cuts announced today are responding to conditions that began deteriorating months earlier.
Reading the FOMC headcount
The released FOMC minutes came in with a softer internal tone than the broader market had been pricing in. Key readings from the language:
- The term “several” participants backed a 25 basis point increase, a word that in Fed convention maps to roughly 4-5 of the committee’s 17 members
- The term “many” members indicated they would back rate rises if inflation picked back up, a word that maps to roughly 8-9 members holding a conditional position
- All dissenting votes were cast by District Bank presidents; no sitting governors broke from the majority
- Two additional non-voting District Bank presidents subsequently went on record backing higher rates
These headcount distributions are analyst interpretation of standard FOMC wording rather than direct text from the minutes. But the structural pattern is clear: the governor bloc, which carries the most institutional weight and is most closely aligned with Chair Jerome Powell, is currently not in cutting mode, and not in hiking mode either.
Readers watching for a policy pivot should understand that the hawks are concentrated among rotating District Bank presidents whose dissents are publicly recorded but not majority-forming. When governor-level language shifts, that is the signal worth tracking.
Housing and credit confirm the rate-sensitive sectors are already in contraction
Pending home sales have fallen to within a few basis points of their series record low, making them the clearest single indicator of how severely rate-sensitive activity has been squeezed in the current environment.
The housing market is not in outright collapse. It is stalled, and the quantitative benchmarks tell you precisely how stalled.
Housing market decoupling from broader GDP has been a contested thesis throughout the current cycle: housing’s direct contribution to GDP has shrunk to the low single digits from a pre-GFC peak of roughly 6.5%, which limits the sector’s capacity to drag the broader economy into contraction even as pending sales approach record lows.
| Indicator | Current reading | Prior benchmark or context |
|---|---|---|
| Pending home sales | Near the series record low | Among the weakest readings ever recorded |
| Housing starts | At their weakest point since 2022 | Four-year low |
| Builder purchase discounts | Largest ever reported by builders | Unprecedented in builder disclosures |
| Rental concessions | At record highs | Apartment operators offering aggressive incentives |
With the policy rate at 3.50-3.75%, revolving credit costs remain elevated. Banks have raised lending standards. The transmission mechanism is working exactly as designed: elevated rates are cooling rate-sensitive sectors.
The question the data cannot answer for you is whether the Fed has done enough, or whether the cooling will overshoot into a harder contraction before policy responds. Housing has historically led the broader economic cycle. A near-record-low pending sales reading in mid-2026 is a leading signal for consumption and employment conditions across construction, real estate, and financial services.
What would actually move the Fed to cut, and when
The forecaster consensus offers a clear baseline. Market economists surveyed in mid-August 2026 overwhelmingly expect no cut at the September meeting. Survey data suggests around 80% of professional economists anticipate no policy change before the close of 2026, a figure broadly in line with Fed communications, though the precise poll result is unverified. Median forecasts point to rates remaining on hold well into the following year.
The consensus view: rates on hold through year-end 2026 and potentially beyond, with only a minority of professional forecasters contemplating additional hikes.
The Fed has signalled three specific conditions are required before cuts become likely:
- A sustained run of benign official inflation data, specifically PCE convincingly at or below 2%, not just real-time proxy confirmation
- More pronounced and sustained labour market deterioration beyond current softness
- No reacceleration in inflation that would validate the conditional hawk position
The gap between where the data is trending and where the Fed’s threshold actually sits is the central timing question. Real-time inflation readings are already below target. Official trailing series are not yet there. Labour softness is building but has not reached the sustained deterioration threshold. The Fed has made its approach clear: it will wait for official data to confirm rather than acting ahead of it.
For you, the actionable implication is that the Fed’s bar for cuts is higher than the current data mix clears. The window between when economic stress becomes undeniable in official data and when the Fed responds is the risk period to plan around. Knowing the Fed’s exact threshold conditions, not just the direction of the data, allows you to assess whether each incoming release is moving the needle or simply confirming a trend the Fed is already aware of and not yet acting on.
The macro regime is shifting, but the Fed’s clock runs on different data
The evidence across six distinct data streams points in one direction. Real-time inflation is below target. Full-time employment is eroding. Consumer balance sheets are under observable stress. Housing is near historic lows. The FOMC hawk bloc is a rotating minority without governor support. The macro regime is shifting from an inflation problem to a growth-and-household-stress problem.
The Fed moves on official series that lag real-time conditions by weeks to months. By the time the Fed’s preferred data unambiguously clears its threshold, the economic softening will have been running for longer than the cut announcement suggests. That lag is not a policy failure. It is the feature of institutional caution that you need to price into any rate-cut timeline you are building.
The specific official series worth tracking from here:
- PCE inflation: The Fed’s preferred price gauge; sustained readings at or below 2% on a trailing basis would remove the primary objection to easing
- BLS full-time employment composition: The metric that reveals labour quality deterioration the headline payroll number obscures
- Governor-level FOMC language: When sitting governors, not rotating District Bank presidents, begin signalling openness to cuts, that is the institutional shift that precedes action
The federal funds rate sits at 3.50-3.75% after five consecutive holds. The data is moving. The Fed is not, yet. Readers who understand the institutional lag dynamic can position ahead of it rather than reacting to the cut announcement itself, which will arrive after official data has already made the decision for the committee.
For investors wanting to understand how the institutional calendar itself may shift, our full explainer on FOMC meeting frequency reform examines what a reduction from eight to six annual meetings would mean for how markets price policy uncertainty between sessions.
This article is for informational purposes only and should not be considered financial advice. Investors should conduct their own research and consult with financial professionals before making investment decisions. Financial projections and rate-cut timing estimates are subject to market conditions and various risk factors. Past performance does not guarantee future results.