Most investors approach strategy like a shopping trip, hunting for the one approach that beats the rest. That search is a trap. Treating investment choices as if they carry no consequences is one of the surest routes to failure, and the debate over growth vs income shares is where that mistake shows up most often.
The timing makes the question harder to avoid. Growth-led indices dominated in 2024, then parts of the market swung back towards dividends and value through 2025 and into 2026. Meanwhile, the AI spending boom has concentrated returns in a handful of giant companies, and many investors are wondering whether to switch sides.
Switching sides is the wrong question. This explainer gives you a way to judge growth and income approaches by the weaknesses you can live with, rather than by whichever style won last year.
Why does every investment strategy come with a catch?
The comfortable idea is that a flawless strategy exists and you simply have not found it yet. Mark LaMonica and Shani Jayamanne of Morningstar Australia argue the opposite: no single correct strategy exists, and none comes without drawbacks.
The central idea The best strategy for you is the one whose weaknesses you can tolerate and whose benefits match your priorities.
Start with the mechanics. A growth share is a company whose value rests mostly on what investors expect it to earn far into the future, so it usually pays little or no dividend and reinvests its profits instead. An income share is a company that pays out a meaningful part of its profits as dividends, delivering more of your return now.
Each design carries its own typical error. Growth investors tend to stumble by holding unrealistic expectations about how fast and how far a company can grow. Income investors tend to stumble by fixating on today’s dividend while ignoring where the business is heading.
One point trips up many income investors. A dividend is not free extra return: on the ex-dividend date (the cut-off for receiving the payment), the share price normally falls by roughly the amount paid out. That is why comparing total return, meaning price change plus dividends, matters more than yield alone.
Once you see how dividends actually work, the ex-dividend price drop stops looking like a penalty and starts looking like a transfer, which is why your comparison should always rest on total return rather than yield.
| Feature | Growth shares | Income shares |
|---|---|---|
| What drives return | Expectations of distant future earnings | Dividends paid in the near term, plus price change |
| Typical company profile | Reinvests profits to expand | Larger, mature, slower-growing, financially stronger, less cyclical |
| Typical strength | Leads in optimistic, momentum-driven rallies | Supplies return when price gains shrink |
| Typical weakness | Vulnerable when lofty expectations disappoint | Lags speculative rallies; dividends can be cut |
Read the table as a set of trade-offs rather than a scorecard. Picking growth or income is really picking which kind of discomfort you can sit through, so you need your own answer before you choose. A strategy that fits your goals is also the one you are most likely to hold long enough for its benefits to arrive.
When big ASX news breaks, our subscribers know first
What behavioural traps turn a sound strategy into a poor result?
Knowing a strategy’s built-in weakness is one thing. Living through it is another, and that is where most of the damage happens.
The three traps in plain terms
- Performance chasing: buying whatever has just done well, such as piling into AI-heavy growth funds after a big year or switching to dividend funds once they have rallied.
- Herding: feeling safe because everyone else is buying, including only reading views you already agree with, which breeds false confidence.
- Confirmation bias: treating new information as proof of what you already believe, such as seeing every AI spending announcement as evidence valuations are justified, or every dividend increase as proof a company is financially sound.
Two cousins often join them. Recency bias assumes the latest winner will keep winning, and the disposition effect leads you to hold losers too long while selling winners too early.
Notice when these habits bite. It is rarely during the good stretches; it is when your chosen style lags, the headlines favour the other side, and abandoning ship feels like common sense.
Loss aversion explains why abandoning ship feels like common sense: a 20% drawdown triggers a fear response out of proportion to the loss, and selling near lows is the usual result.
What the behaviour gap costs
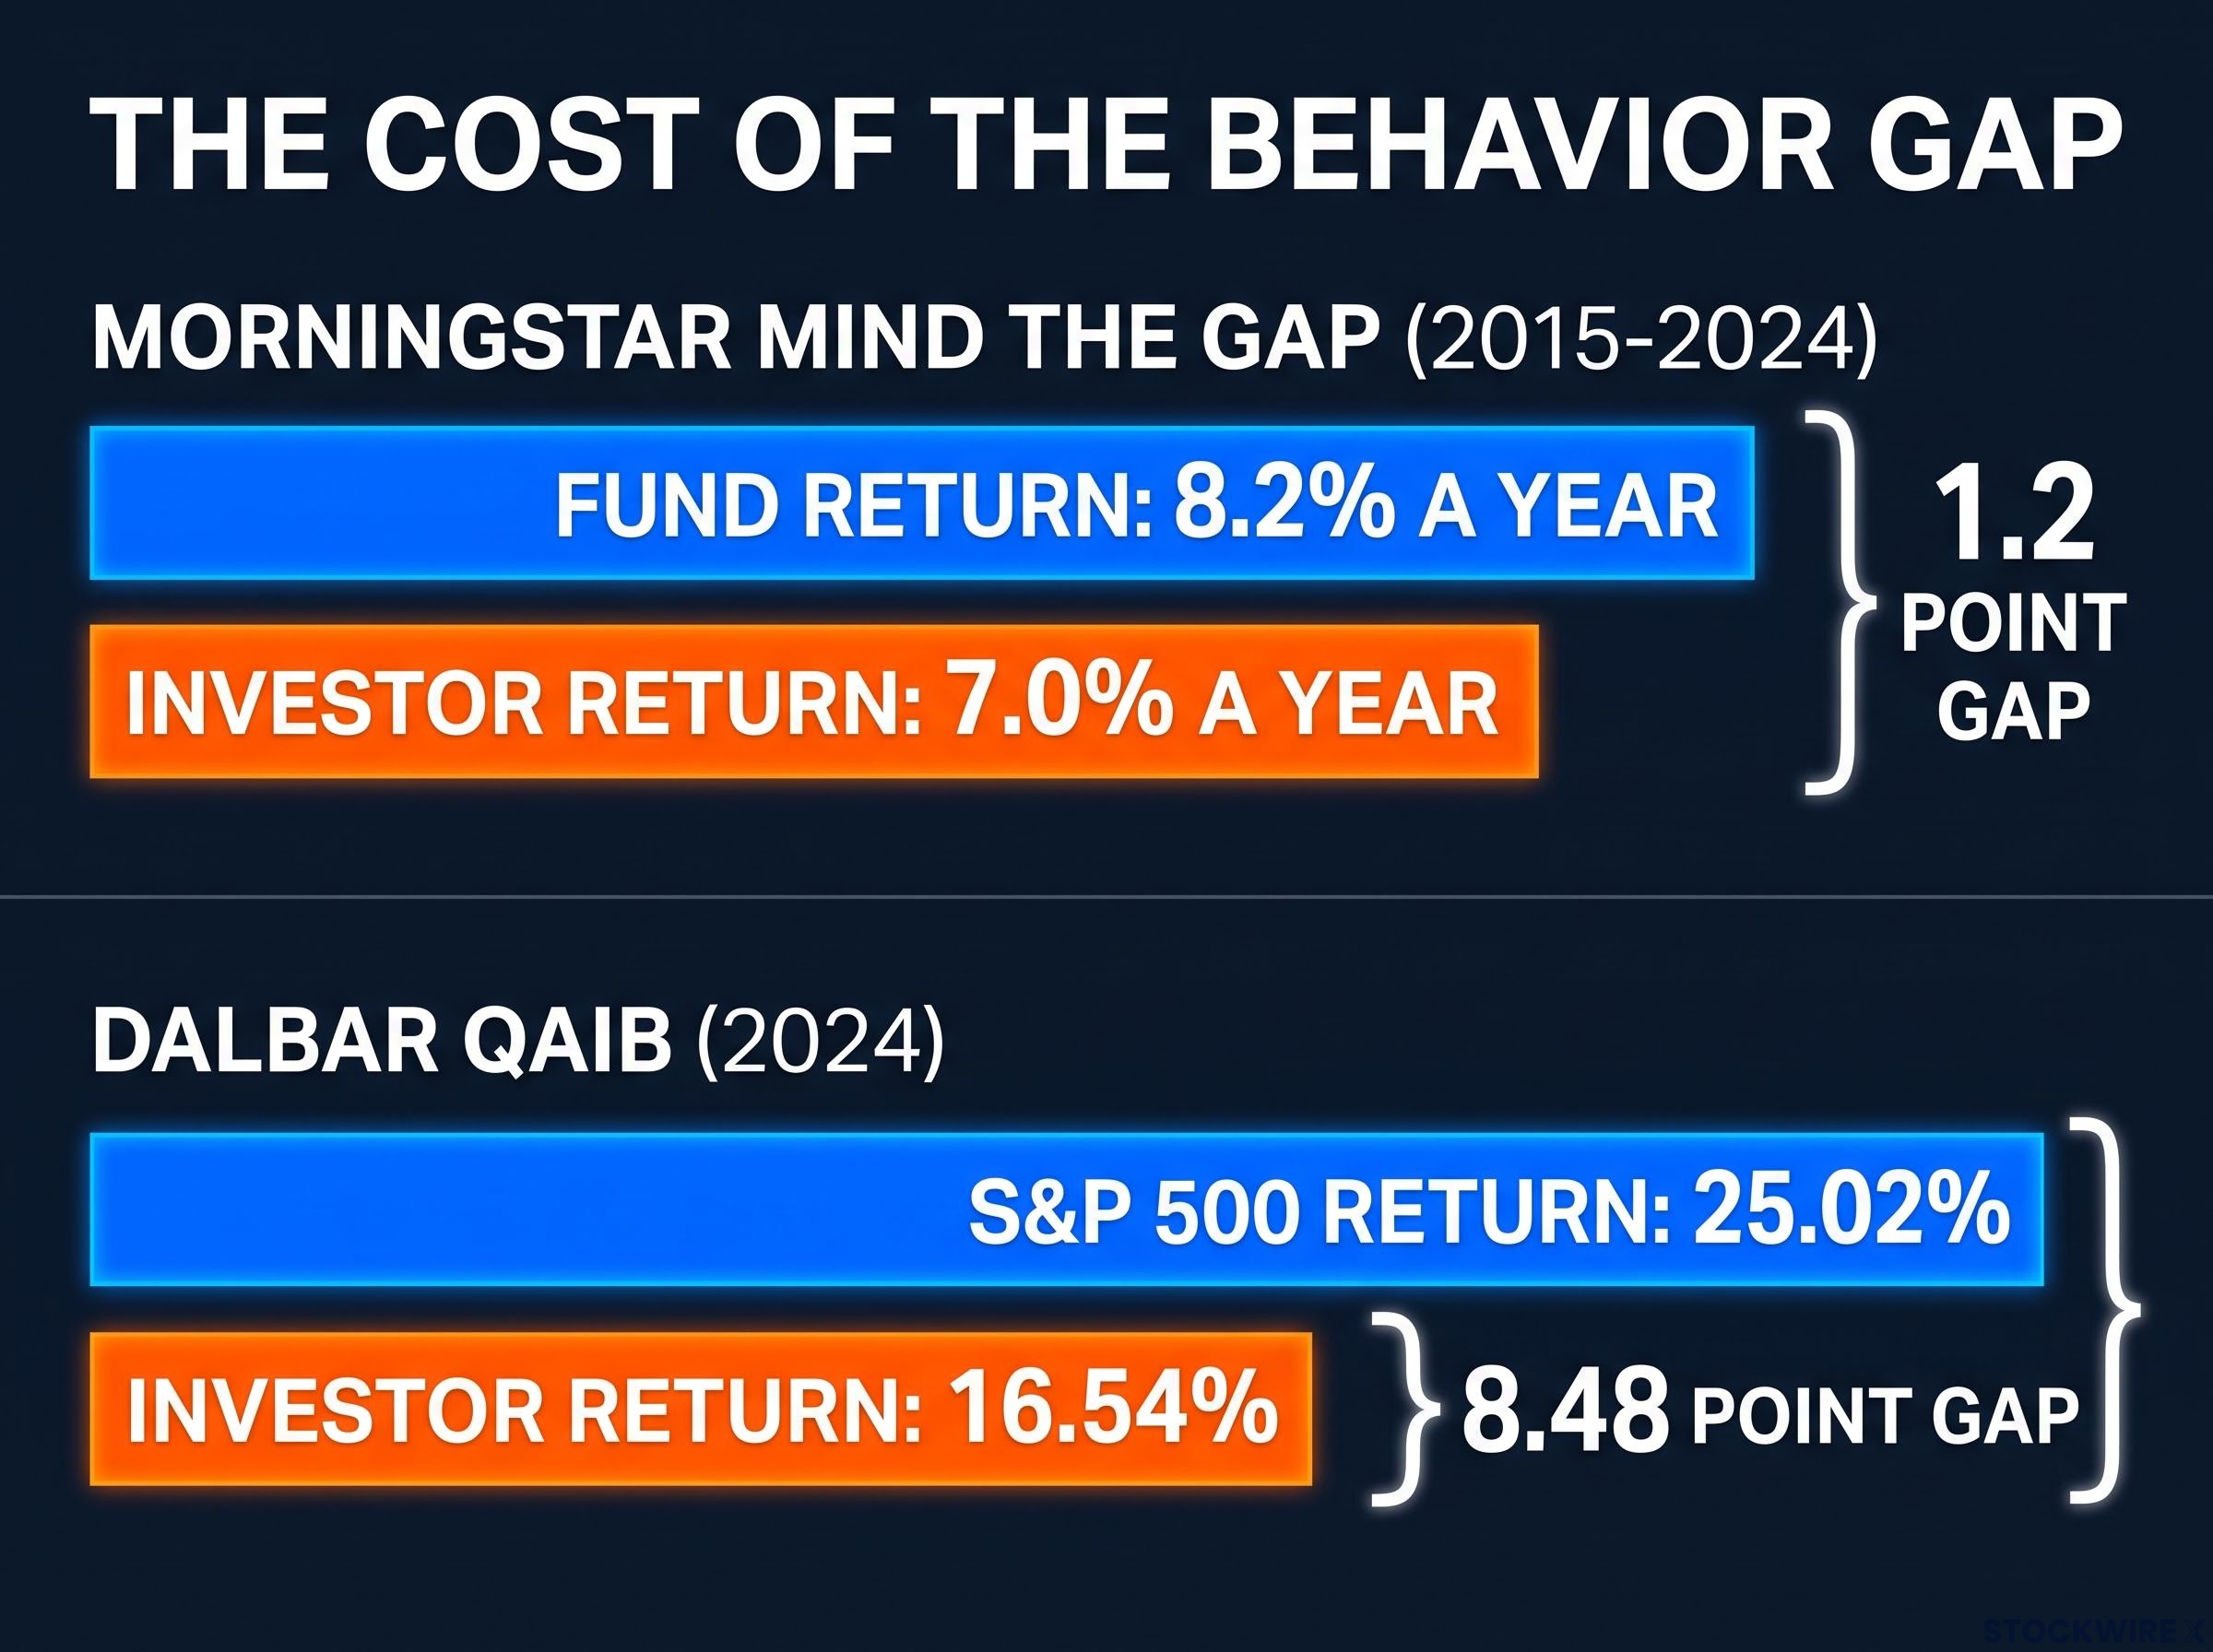
The cost of these habits shows up in research comparing what funds earn with what their investors actually capture.
| Study | Period | Investor return | Fund or benchmark return | Gap |
|---|---|---|---|---|
| Morningstar Mind the Gap | 2015-2024 | 7.0% a year | 8.2% a year (funds) | About 1.2 points a year |
| DALBAR QAIB | 2024 | 16.54% | 25.02% (S&P 500) | 8.48 points |
According to Morningstar, that 1.2-point annual gap amounted to roughly 15% of the funds’ total gains over the decade. DALBAR’s figure covers the average equity investor in a single, strong year. Both are reported by secondary research, and neither claims every investor underperforms; they describe an average penalty.
That average is still sobering. The biggest threat to your return may be your own timing, which means a strategy you will abandon is worth less than a slightly weaker one you will actually keep.
How do growth and income shares trade places across a cycle?
If behaviour costs so much, it helps to see the cycle that tempts you to misbehave.
Why leadership rotates
Growth companies are sensitive to valuation shifts. When rates fall or optimism rises, the present value of their distant earnings climbs, so they tend to lead speculative rallies. Income indices usually hold more utilities, financials, energy and consumer staples, and less technology, which restrains gains when tech leads but helps under stress, as dividends keep paying when prices stall.
MSCI factsheet data shows the pattern, though results vary with index methodology, currency and whether returns are price or total.
| Year | MSCI World High Dividend Yield (gross) | MSCI World (gross) | Style that led |
|---|---|---|---|
| 2022 | -3.93% | -17.73% | Income |
| 2024 | 8.91% | 19.19% | Broad market |
| 2025 | 19.66% | 21.60% | Broad market, by a narrower margin |
Australia offers a sharper swing. For the year to 30 June 2026, the Australian Shareholders’ Association reported the S&P/ASX 200 rose 2.77% on price but 5.90% on a net total return basis, while S&P Dow Jones Indices reported the S&P/ASX 200 Value index gained 20.20%.
Whichever style leads in a single year is poor evidence for which leads next. A rotation built on last year’s winner is a bet, not a plan.
The AI build-out as a live test
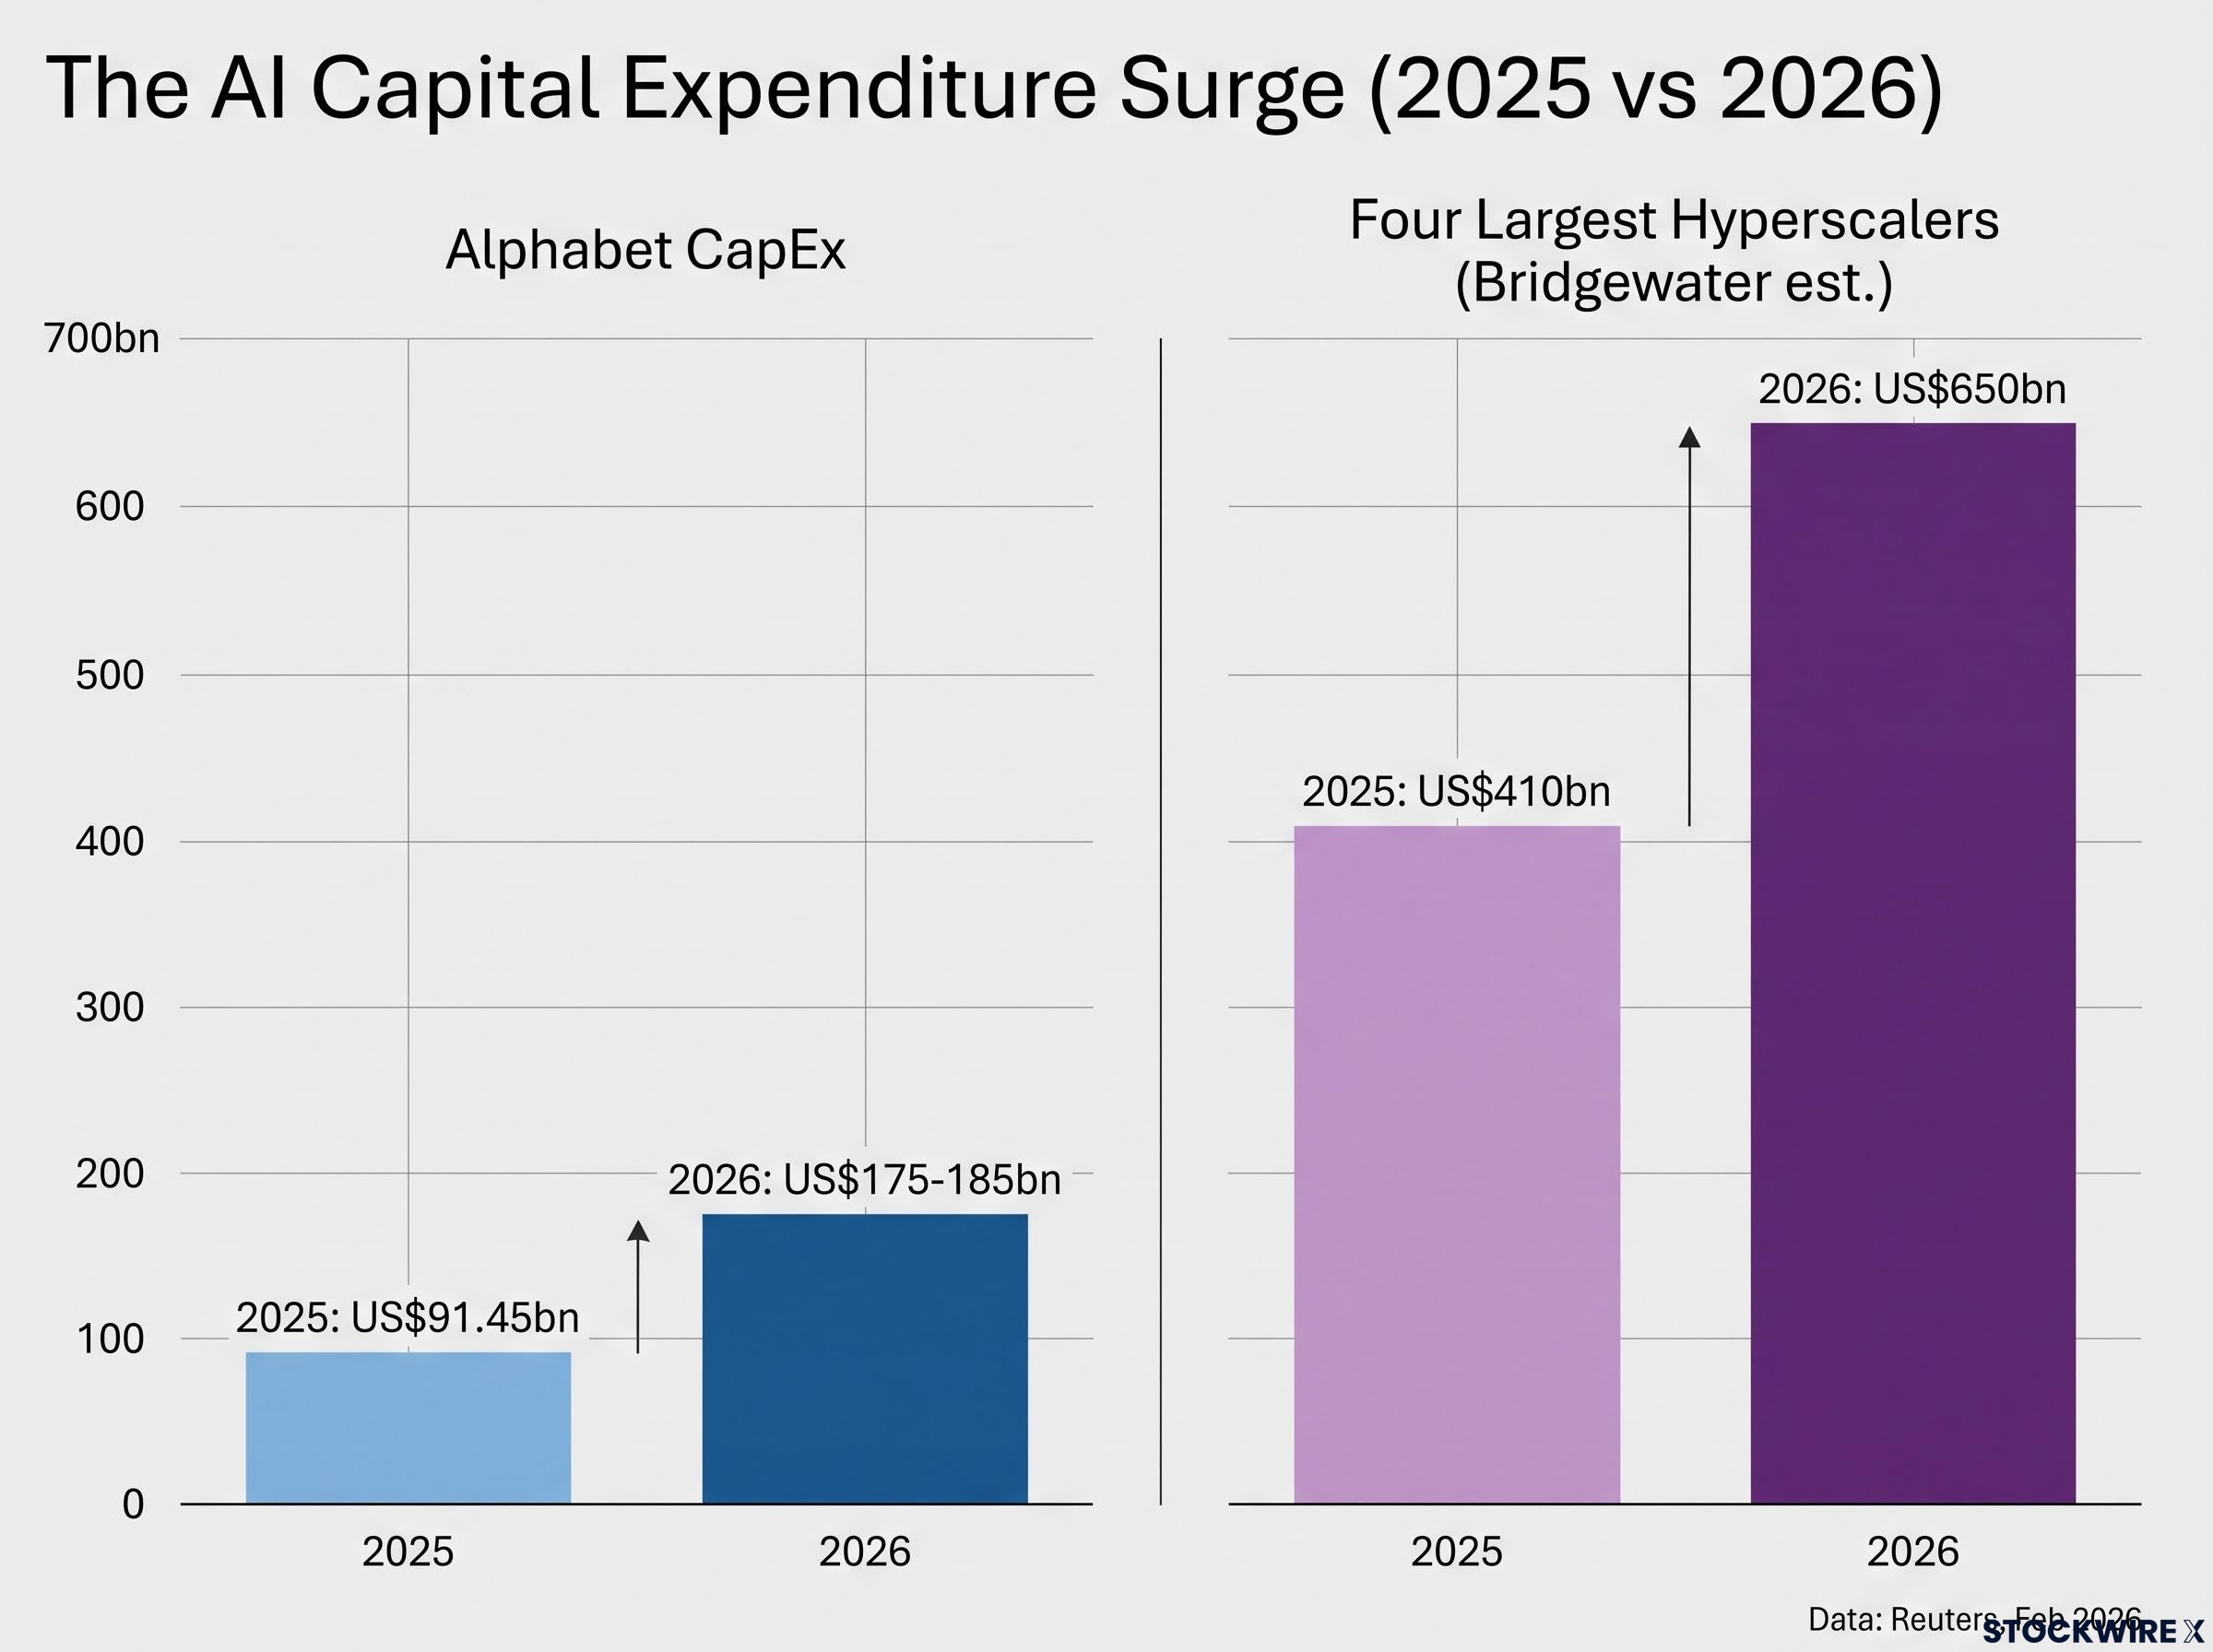
Reuters reported in February 2026 that Alphabet guided to US$175-185bn of capital expenditure for 2026, up from US$91.45bn in 2025. Citing Bridgewater, Reuters put spending by the four largest hyperscalers (giant cloud providers) at about US$650bn in 2026, against US$410bn in 2025. Morningstar reported technology at 30.9% of its US Market Index in June 2025.
You do not need a view on whether AI succeeds to see the risk. Even if it does, infrastructure spending will eventually plateau, and timing an exit is hazardous either way. LaMonica holds some AI exposure but mostly owns companies little affected by it, accepting periods of underperformance as the price.
Hyperscaler AI capital expenditure now absorbs roughly 93-94% of operating cash flow by PIMCO estimates, leaving little room for buybacks or dividends and raising the stakes on how quickly returns arrive.
Income carries its own catches:
- Dividend cuts can arrive exactly when you most rely on them.
- Yield traps: a high yield may reflect a collapsing share price, not value.
- Concentration in a few sectors or holdings.
- Bond competition when rising yields make dividends less attractive.
- Tax and inflation can erode nominal income.
Why switching styles is costly
Rotating successfully means acting before the change is obvious. In 2022, rising rates repriced growth and sent money into value, energy and income, and investors who switched only once the move was clear risked selling growth near its lows. Add transaction costs and taxes, and mistimed rotation compounds the damage.
How do you read a product’s marketing and build a strategy you can hold?
The pull to switch often comes from a glossy fund page, so start there.
Reading the fine print
Marketing versus disclosure Marketing leads with benefits. The risks usually sit in the fine print, such as the product disclosure statement (PDS), the legal document describing how a fund works.
A label like “income” or “growth” tells you little about what a fund holds. In Australia, the corporate regulator ASIC is reported to require that past performance carry a prominent warning it is not necessarily a guide to the future, and ETF documents warn that distributions are not guaranteed.
Morningstar favours forward-looking quality screens, such as payout ratios and financial strength, over simply chasing the highest yield. Before you commit to any fund, work through this list:
- Define your goal and the weakness you can tolerate.
- Check the index methodology, sector weights and top holdings.
- Compare total return, not just yield, and understand when distributions can fall.
- Review fees, spreads, tax treatment and currency hedging.
- Set rebalancing rules in advance.
- Write down what would make you change course.
The label on a fund is a starting point for questions. The fine print is where you learn which weaknesses you are actually signing up for.
Chasing dividend yield on a screener can mislead, because a falling share price mechanically inflates the yield without any improvement in the business behind it.
Holding the course without ignoring warning signs
Consistency and diversification work together, but each has limits. A style can stay out of favour for years, and “staying consistent” can become an excuse for ignoring a broken thesis.
Diversification has traps too. Several funds may own the same mega-caps, and shifting weights after recent performance is market timing in disguise. Done honestly, though, spreading exposure across styles cushions the blow when leadership rotates.
What a tolerable weakness looks like in practice
Every style costs something, and the evidence suggests behaviour often costs more than the style itself. The AI cycle is simply the latest reminder that market leadership never stays put.
So the decision comes down to one question: would you rather lag a speculative rally, or sit through a drawdown in a concentrated growth holding without selling? Choose the weakness you can accept, then keep reviewing valuation, concentration and costs rather than switching off.
Write down your strategy and its known drawbacks now, before the next market shift tests your resolve.
This article is for informational purposes only and should not be considered financial advice. Investors should conduct their own research and consult with financial professionals before making investment decisions. Past performance does not guarantee future results.