A gap down feels like the market has already made up its mind. The data says otherwise: after the S&P 500 index (SPX) opens at least 0.5% below the prior close, the average open-to-close return is about +0.01%, the same as on any other day.
That matters more now than it did a few years ago. Zero-days-to-expiration (0DTE) options, contracts that expire on the same day they are traded, now make up roughly 61-65% of SPX options volume, according to recent Cboe figures. A gap down is the first thing those traders face at the bell.
The study behind this piece covers about 15 years of SPX data and was updated into October 2026. A gap of nearly -1% landed the day before it was presented, which is a useful reminder that these mornings keep arriving.
Here is what the numbers show about how often these gaps happen, what they do and do not predict, how much wider ranges and volatility become, and what that means for how you manage risk.
How often does an SPX gap down of 0.5% or more actually happen?
Most traders remember gap-down mornings as rare, dramatic events. The base rate tells a quieter story.
A gap down here means the open sits below the prior day’s close. The study counts only gaps of -0.5% or worse, so a drop of roughly -0.35%, like the one seen on the day of the presentation, falls outside it.
| Gap threshold | 15-year study | Trade Intel (1993-2026) | Note |
|---|---|---|---|
| -0.5% or worse | ~13.6% | ~12.1% | Trade Intel figure combines 643 and 369 sessions |
| -1% or worse | ~6% | ~4.4% | 369 sessions in the Trade Intel sample |
| -1.5% or worse | ~2% | Not reported | Larger gaps thin out quickly |
That works out to roughly one gap-down session every seven or eight trading days. Year-to-date frequency in 2026 has tracked the long-term average, even though recent frequency has been rising.
Why the two studies disagree
Trade Intel’s study, published on 22 June 2026, spans about 8,300 sessions over 33 years, while the presentation study covers roughly 15. Different sample periods and slightly different gap definitions produce different counts.
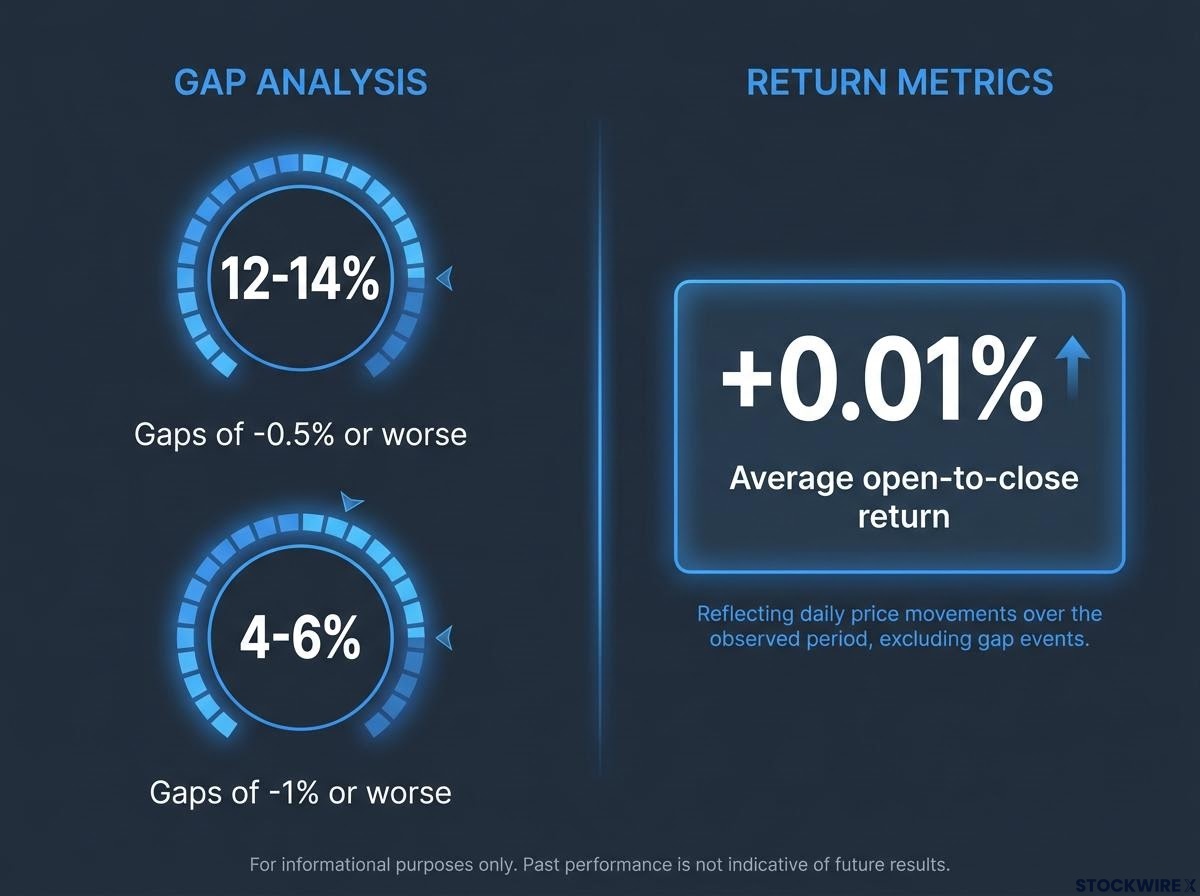
The usable range is about 12-14% of sessions for gaps of -0.5% or worse, and about 4-6% for -1% or worse.
For you, the point is simple. A gap of this size is a routine event, so your 0DTE playbook needs a standing response to it rather than one you improvise at 9:30 a.m.
When big ASX news breaks, our subscribers know first
Why does a gap down leave the average return flat?
If gap downs happen this often, you would expect them to point somewhere. They mostly do not.
Key statistic: Average open-to-close return after a gap down is about +0.01%, the same as all days.
In the presentation study, 53% of all days close above the open over the long term, and the gap-down buckets sit in a 53-57% band. Very large gaps of 1.5% to 2% may see more sessions finish below the open. Trade Intel found about -0.04% after a 0.5%-1% gap down and +0.11% after gaps larger than 1%, with 51% and 52% of sessions closing above the open.
The reason sits in the overnight session. News keeps arriving after the cash market shuts at 4:00 p.m. ET, and the most common catalysts include:
- Company earnings
- Geopolitical developments
- Tariff announcements
- Central-bank surprises
- Economic data releases
- Moves in overseas markets
S&P 500 futures trade through the night and absorb that information before the 9:30 a.m. ET open. By the time the cash index starts trading, the repricing has largely already happened.
So the open-to-close session starts fresh. It behaves like a coin-flip with fatter tails, where sharp recoveries and continued selloffs cancel each other out in the average.
That flat average tells you the gap gives you no directional edge. Any trade you place on a gap-down morning has to be justified by something other than an assumed bounce or an assumed continuation.
For readers wanting a structured process for gap mornings, our full explainer on SPY overnight gap decision frameworks ranks fill probability, VIX term structure and direction in order.
Do gap downs fill, and what happens the next day?
A “gap fill” means the index climbs back to the prior close. Traders love the idea because it promises a tidy reversal, but the figures depend entirely on how fill is defined.
| Source | Fill definition | Time window | Probability |
|---|---|---|---|
| Trade Intel | Same-day fill, 0.5%-1% gaps | Same session | 47% |
| Trade Intel | Same-day fill, gaps above 1% | Same session | 40% |
| Presentation study | Touches prior close intraday | Same session | ~14-29% (vs 81% all days) |
| Presentation study | Closes above prior close | Same session | ~10-15% |
| Presentation study | Gap filled | Within one week | ~55-60% |
These figures should not be merged. What holds across both sources is that fill probability falls as gaps grow, and that time helps: weekly or 30-day options give a gap far more room to close than a contract expiring at 4:00 p.m.
What happens the next session
The other worry is contagion. After a gap-down day, the presentation study puts the chance of another gap down at about 19.3%, compared with about 17% after any down day and 13.6% for any day.
That is a modest bump, not a pattern. The average next-session gap is about 0%, and the next session closes lower roughly 45% of the time.
Other studies cited in the presentation suggest back-to-back losses on short put spreads or iron condors are rare, under 5% and possibly under 2%, or roughly one instance in four years. The presentation study itself includes no 0DTE position backtest, so treat that as context rather than proof.
You cannot count on a same-day fill to rescue a position, and you should not assume a big gap day makes tomorrow worse. Each day deserves its own risk assessment.
How much wider do ranges and the VIX become on gap-down days?
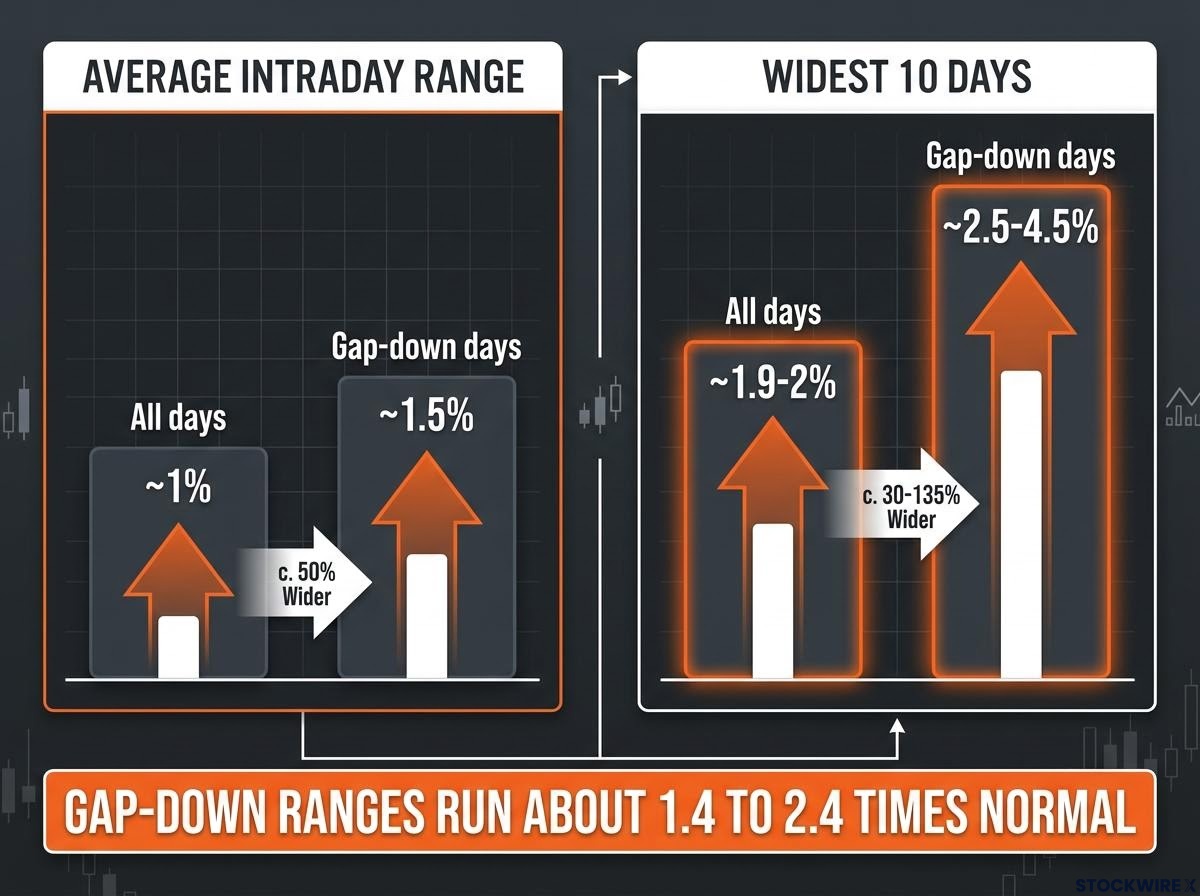
Flat does not mean quiet. The same days that average a near-zero return produce much bigger swings between the high and the low.
| Measure | All days | Gap-down days |
|---|---|---|
| Average intraday range | ~1% | ~1.5% (0.5% gap) |
| Widest 10 days | ~1.9-2% | ~2.5-4.5% |
| Average open-to-close return | ~+0.01% | ~+0.01% |
Range expansion: Gap-down ranges run about 1.4 to 2.4 times the all-days range, and the expansion accelerates as the gap gets larger.
The Cboe Volatility Index (VIX) rises too. The VIX measures implied volatility, which is the market’s expected movement over the next 30 days derived from S&P 500 option prices, not the movement that actually occurs (realised volatility).
The extreme end shows how far this can stretch. In April 2025, SIFMA reported an average intraday S&P 500 spread of about 162 points, peaking at 532.91 points on 9 April, while the VIX averaged 31.97. The St. Louis Fed measured a 30.8-point VIX rise from 2 to 8 April, a 99.9th-percentile move.
Why the VIX can jump before the open
Much of the VIX rise happens overnight, especially on smaller gaps of about 0.5%-0.75%; on larger gaps the intraday share catches up. Earlier in the week of the presentation, the VIX jumped overnight from about 16-17 to about 20, against a long-term median of 17.6.
Two forces drive this: investors buy downside protection, and market makers widen their quotes. On 5 August 2024, the VIX hit about 65.73 before the open. The Bank for International Settlements (BIS) found asymmetric bid-ask widening amplified that spike, and the S&P 500 fell as much as about 4.3% intraday before closing down about 2.98%. The VIX can overshoot what realised volatility later justifies.
Implied volatility usually sits above what the index later delivers, since the VIX bakes in crash-insurance demand and jump-risk compensation, which explains why a premium can look rich on a gap morning and still fail to pay off.
The wider range means a position can be stopped out or badly marked even if the index closes near its open. Path risk, not the closing level, is what you are actually trading.
How should 0DTE traders manage a gap-down morning?
The asymmetry is plain: direction is a coin-flip, but the size of the swings is not. The presentation’s own takeaway was to consider closing positions sooner rather than holding to expiration, and to allow for greater volatility on larger gaps.
| Position type | What can help | What can hurt |
|---|---|---|
| Long options | Gap move and elevated implied volatility | Fast decay if the market stabilises |
| Short options | Rich premium | A further move can overwhelm the credit |
| Short put spreads | Stabilisation or reversal | Continued selling; loss approaches spread width less credit |
| Iron condors | A contained session | A wide range can breach one wing despite a flat close |
Clusters are the hidden danger. A short strategy can profit on many separate gap days and still suffer badly in a run of correlated gap downs, as April 2025 showed.
A run of correlated gap downs is exactly where stacked short spreads fail, as a Christmas Eve 2025 blowup showed when rolled positions compounded into an account-destroying loss.
Does 0DTE calm or inflame gap days?
Dealer gamma describes how much market makers must adjust their hedges as prices move. When it is positive, dealers buy dips and sell rallies, which dampens moves; when it is negative, they sell into falls and buy into rises, which can amplify them.
Cboe-sponsored research finds aggregate gamma is usually positive and volatility-reducing, with volatility rising when it turns negative. A 2024 study found 0DTE market-making reduced index volatility by about 60-90 annualised basis points on average.
Competing views hold that 0DTE dampens, amplifies, redistributes intraday moves, or adds fragility in shocks. These are averages, not guarantees, and the 61-65% volume share figures cover different periods and measures.
Limits of the data
The study includes no 0DTE position backtest. Results also shift with:
- How a gap is defined
- Whether SPX, ES futures or SPY opens are used
- Mid-price fills that vanish in stressed minutes, plus slippage
- Exit rules, margin and regime dependence
- Tail-loss asymmetry: frequent small gains, rare large losses
High implied volatility does not guarantee profitable mean reversion, so settle your plan before the open:
- Set your exit rule, time or price based.
- Size the position for a range of up to 2.4 times normal.
- Define your maximum loss in dollars.
- Decide whether you will hold or close early.
Past performance does not guarantee future results, and these statistics may not hold in future market conditions.
What a gap down does and does not tell you
Sort the evidence into two piles and the rule of thumb becomes clear:
- Gaps of -0.5% or worse hit about 12-14% of sessions; -1% or worse about 4-6%.
- The average open-to-close return is near zero.
- Fill figures depend on definition; one-week fill runs about 55-60%.
- Next-day outcomes are largely independent.
- Wider ranges and a higher VIX are the dependable signals.
The gap tells you volatility is coming. It does not tell you direction, and it does not promise a fill. Your central risk is the path the index takes, not where it closes.
When the next gap down arrives, measure it against these base rates, using the October 2026 update as a reference point rather than a forecast. Treat it as a volatility event to manage, not a directional bet to make.
This article is for informational purposes only and should not be considered financial advice. Investors should conduct their own research and consult with financial professionals before making investment decisions.