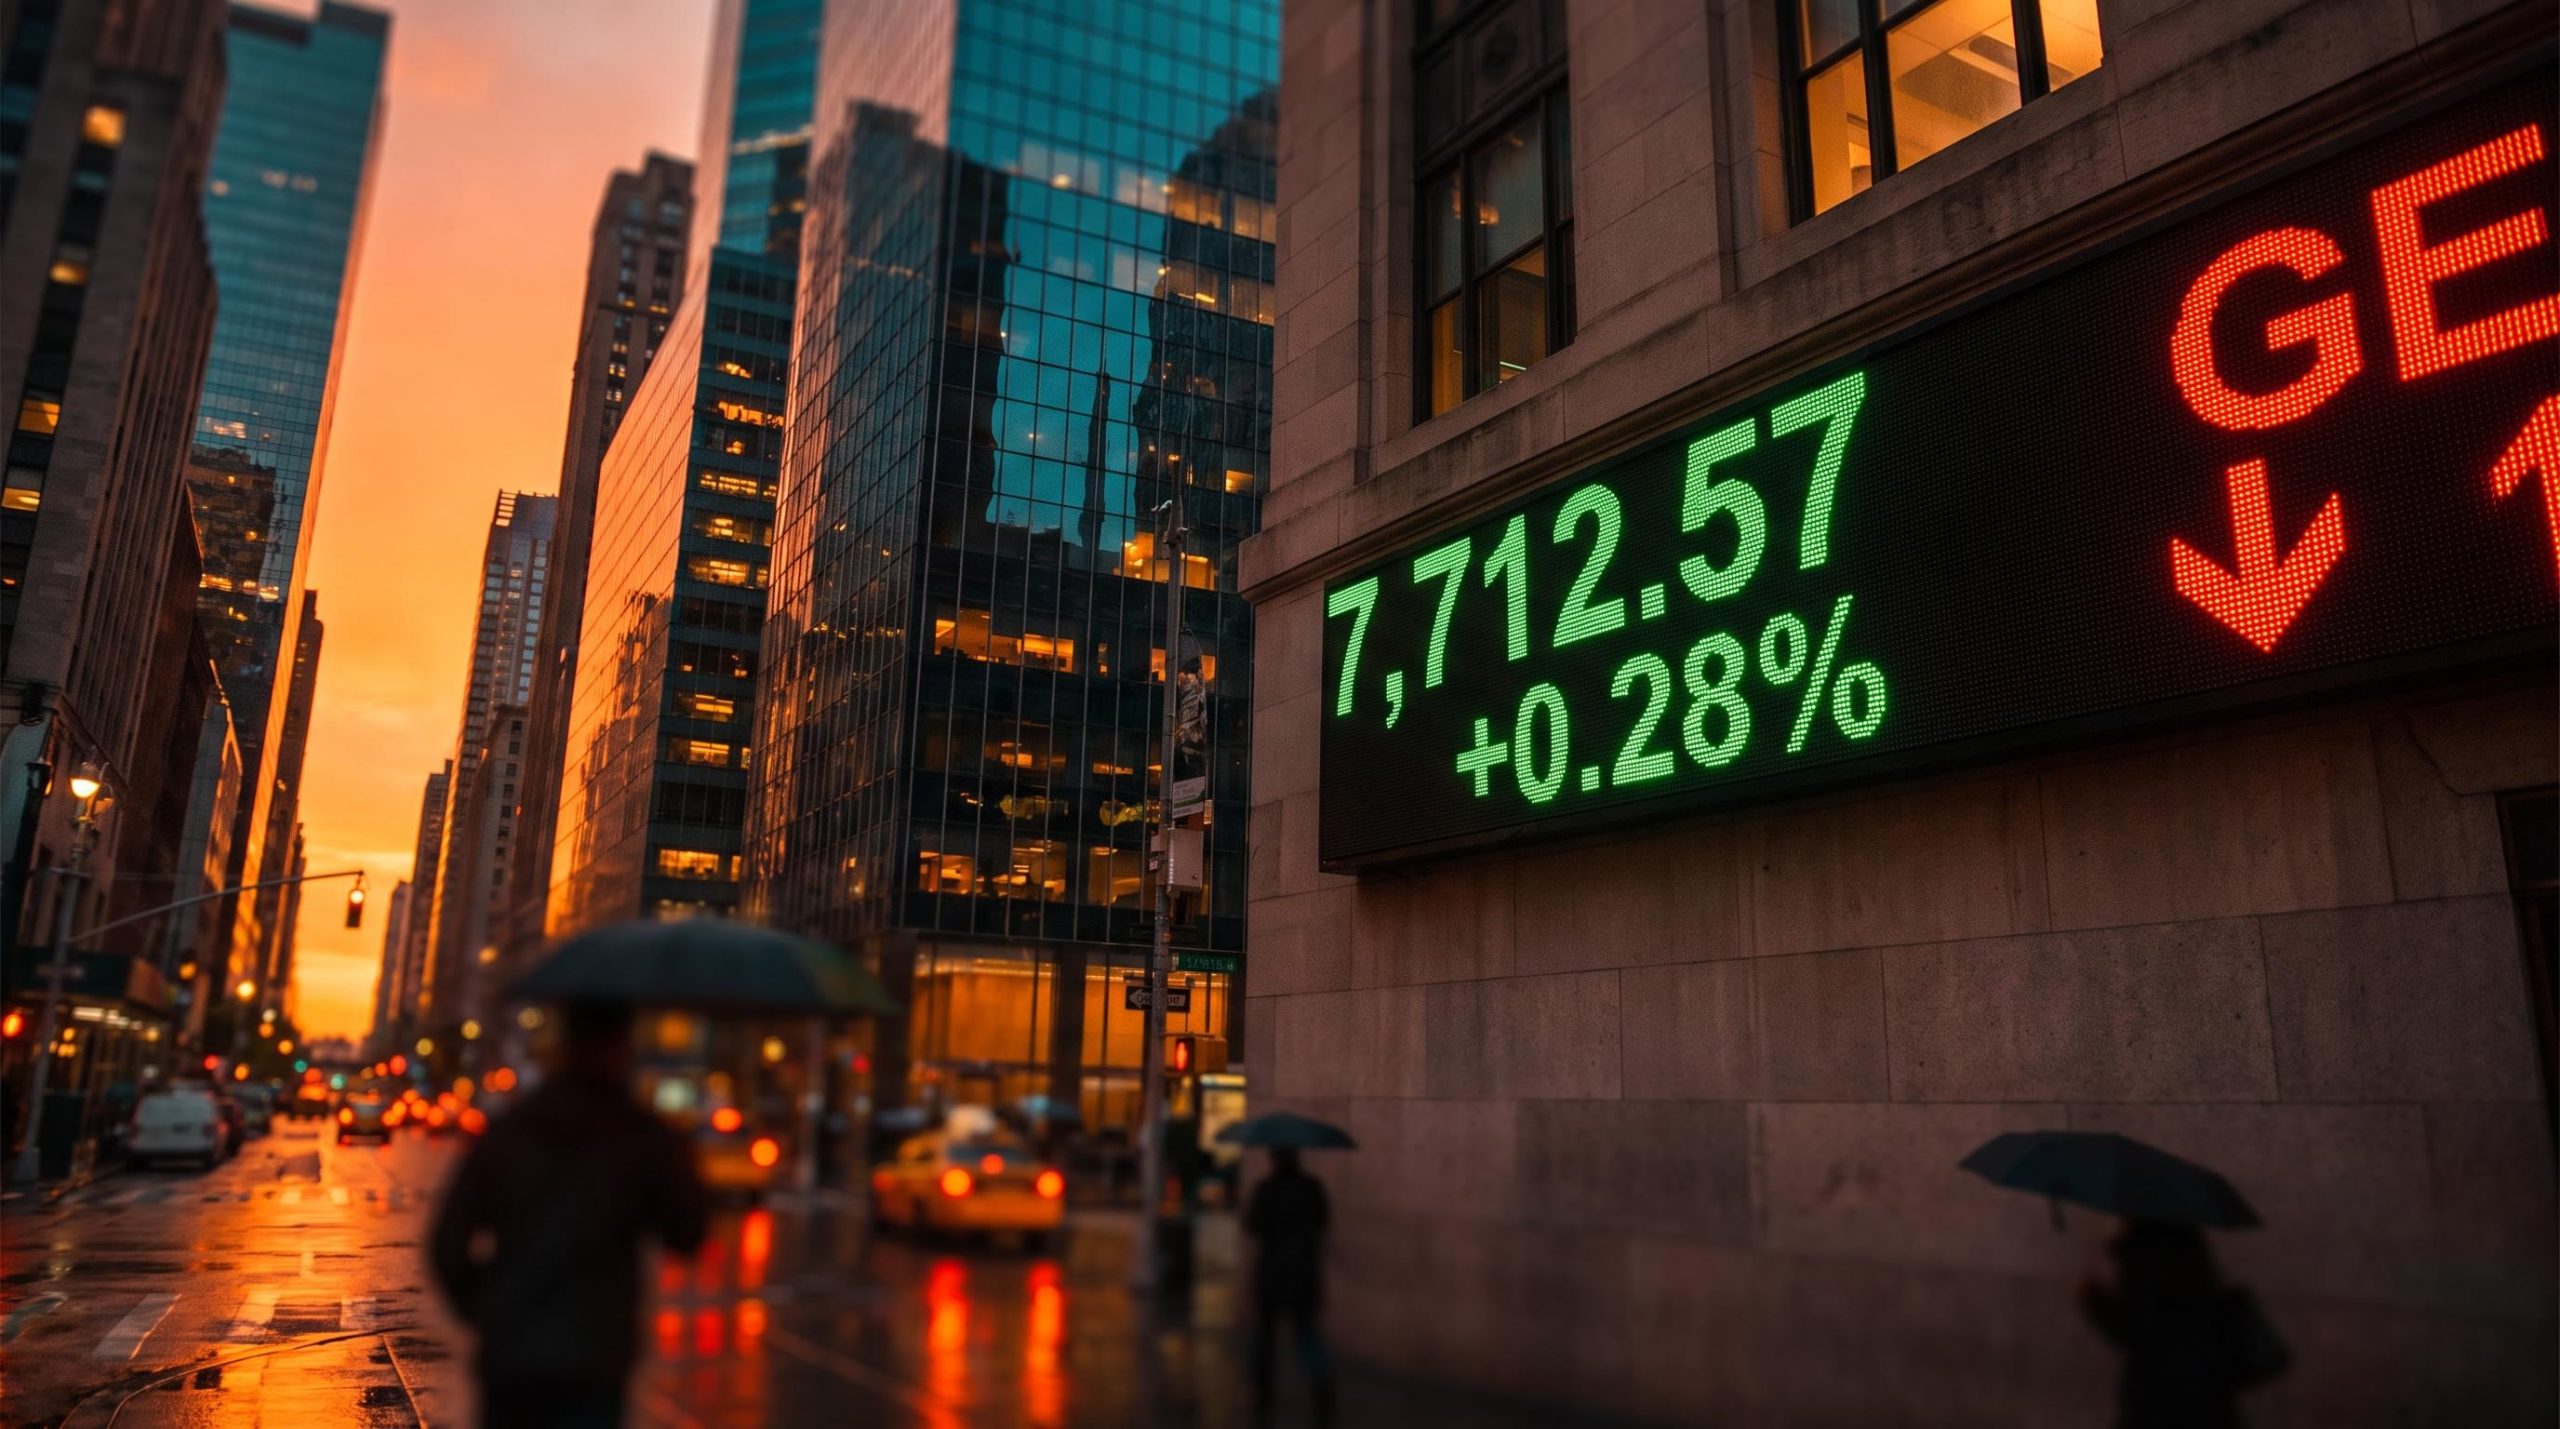
The stock market today finished in the green, but not for the reasons the earnings calendar suggested. The S&P 500 closed at 7,712.57, up 0.28%, on Tuesday. The Dow Jones Industrial Average gained 1.02% to 52,495.88, and the Russell 2000 climbed 1.65% to 2,773.42.
The gains came even as GE Aerospace and General Motors both beat estimates and still sold off.
The session landed nine trading days before the 3 November midterm elections. Netflix reports after tonight’s close, and Tesla follows on Wednesday.
Here is what Tuesday’s tape tells you about whether headline-driven rallies hold, and which price levels decide what happens next.
Why did a peace-deal rumor lift stocks while good earnings got sold?
On the surface, Tuesday looked calm. Underneath, two solid earnings reports were punished, and a rally built on geopolitical headlines lost steam within hours.
GE Aerospace and GM: beats that did not hold
GE Aerospace posted adjusted earnings per share (EPS, the profit attributed to each share) of $2.25 against a $2.01 consensus, meaning the average analyst forecast. It also raised its 2026 EPS guidance to $8.00-$8.10. The stock still slid to about $301, roughly 22.5% below its $388.84 high from 6 August.
GM’s problem sat in the fine print. Its narrowed guidance put the EPS midpoint at $13.25, below the roughly $13.41 consensus, so the quarterly beat was not enough.
| Company | Adj. EPS vs consensus | Revenue vs consensus | Guidance | Stock reaction |
|---|---|---|---|---|
| GE Aerospace | $2.25 vs $2.01 | $13.29B vs $12.88B | 2026 EPS raised to $8.00-$8.10 from $7.65-$7.85 | About $301 vs $311.28 prior close |
| General Motors | $3.70 vs about $3.63-$3.69 | $50.02B vs about $48.7-$48.8B | 2026 EPS narrowed to $12.75-$13.75 | Down about 5%-7.6% early |
Some secondary coverage cited GE revenue of $14.12B. The figure above comes from the reporting that compared results directly with consensus.
The peace-deal rally that faded
Reports of progress in U.S.-Iran talks, including possible easing of shipping limits through the Strait of Hormuz, sparked an early rally. It faded as investors questioned whether any deal was final. Oil readings conflict: Schwab’s snapshot showed WTI at $99.48, up 0.96%, while a separate report had it down 2.69% at $90.54.
Tuesday’s early gains fit the pattern of a political market rally, where summit sequencing and diplomatic headlines lift futures before any substantive outcome arrives, which helps explain why the move faded within hours.
The trader’s read Tim Knight, a bearish trader and market commentator, said peace rumors have repeatedly sparked quick rallies that fade, and that earnings season now gives the market other catalysts.
When good numbers meet selling, you are being told that expectations set the bar, not results. A rally built on rumor gives you little to lean on.
What are the indexes hiding beneath the surface?
The index closes looked steady. Chip stocks tell a rougher story.
Semiconductors: bounce or breakdown?
The Philadelphia Semiconductor Index (SOX) fell about 11% last week, erasing roughly $2 trillion in value over an eight-session losing streak. That was the sector’s longest since October 2008. On Tuesday, SOX rose just under 0.5%, even as South Korea’s KOSPI dropped about 3.73% on memory-chip selling.
The chip sector selloff has structural roots, including accumulating AI export controls and South Korean contagion risk, which helps explain why a sub-0.5% SOX bounce and KOSPI’s 3.73% drop sat side by side.
Knight noted that the XLK and QQQ technology funds have printed a lower daily high every session since their 6 October lifetime highs. He also observed that the Nasdaq 100 sits roughly where it was in May.
- Bear case: BTIG suggests using rebounds to cut chip exposure. Julien Lafargue of Barclays Private Bank points to the cyclical nature of memory.
- Bull case: UBS Wealth Management says semiconductor valuations sit below long-term averages. Thorne calls the October drop a normal pullback, and Michael James of Rosenblatt Securities called Monday’s bounce an “enough-is-enough” reversal.
Rates, gold and oil: the cross-asset check
Schwab’s same-day snapshot serves as the primary reference below. Kitco captured gold and yields at different times.
| Asset or index | Level | Move | What to watch |
|---|---|---|---|
| S&P 500 futures (ES) | Above 7,670 | Mixed intraday | Break of 7,670 (Knight) |
| SMH chip ETF | Support at 536 | SOX up just under 0.5% | Repeated holds at 536 |
| 10-year Treasury yield | 5.09% | Down about 3 basis points | Rate pressure on valuations |
| Gold | $4,142.60/oz | Down about 0.4% | Drift toward $4,000 (Knight) |
Calm index closes can mask a narrow, weakening leadership group. You learn more from the tech internals and a few named levels than from the headline index number.
How does a short-biased trader manage risk nine days before the election?
Knight’s positioning shows how one bear structures exposure into event risk. A short position is a bet that a price will fall. This describes one individual trader’s approach, not a recommendation.
Inside the book: stops and sizing
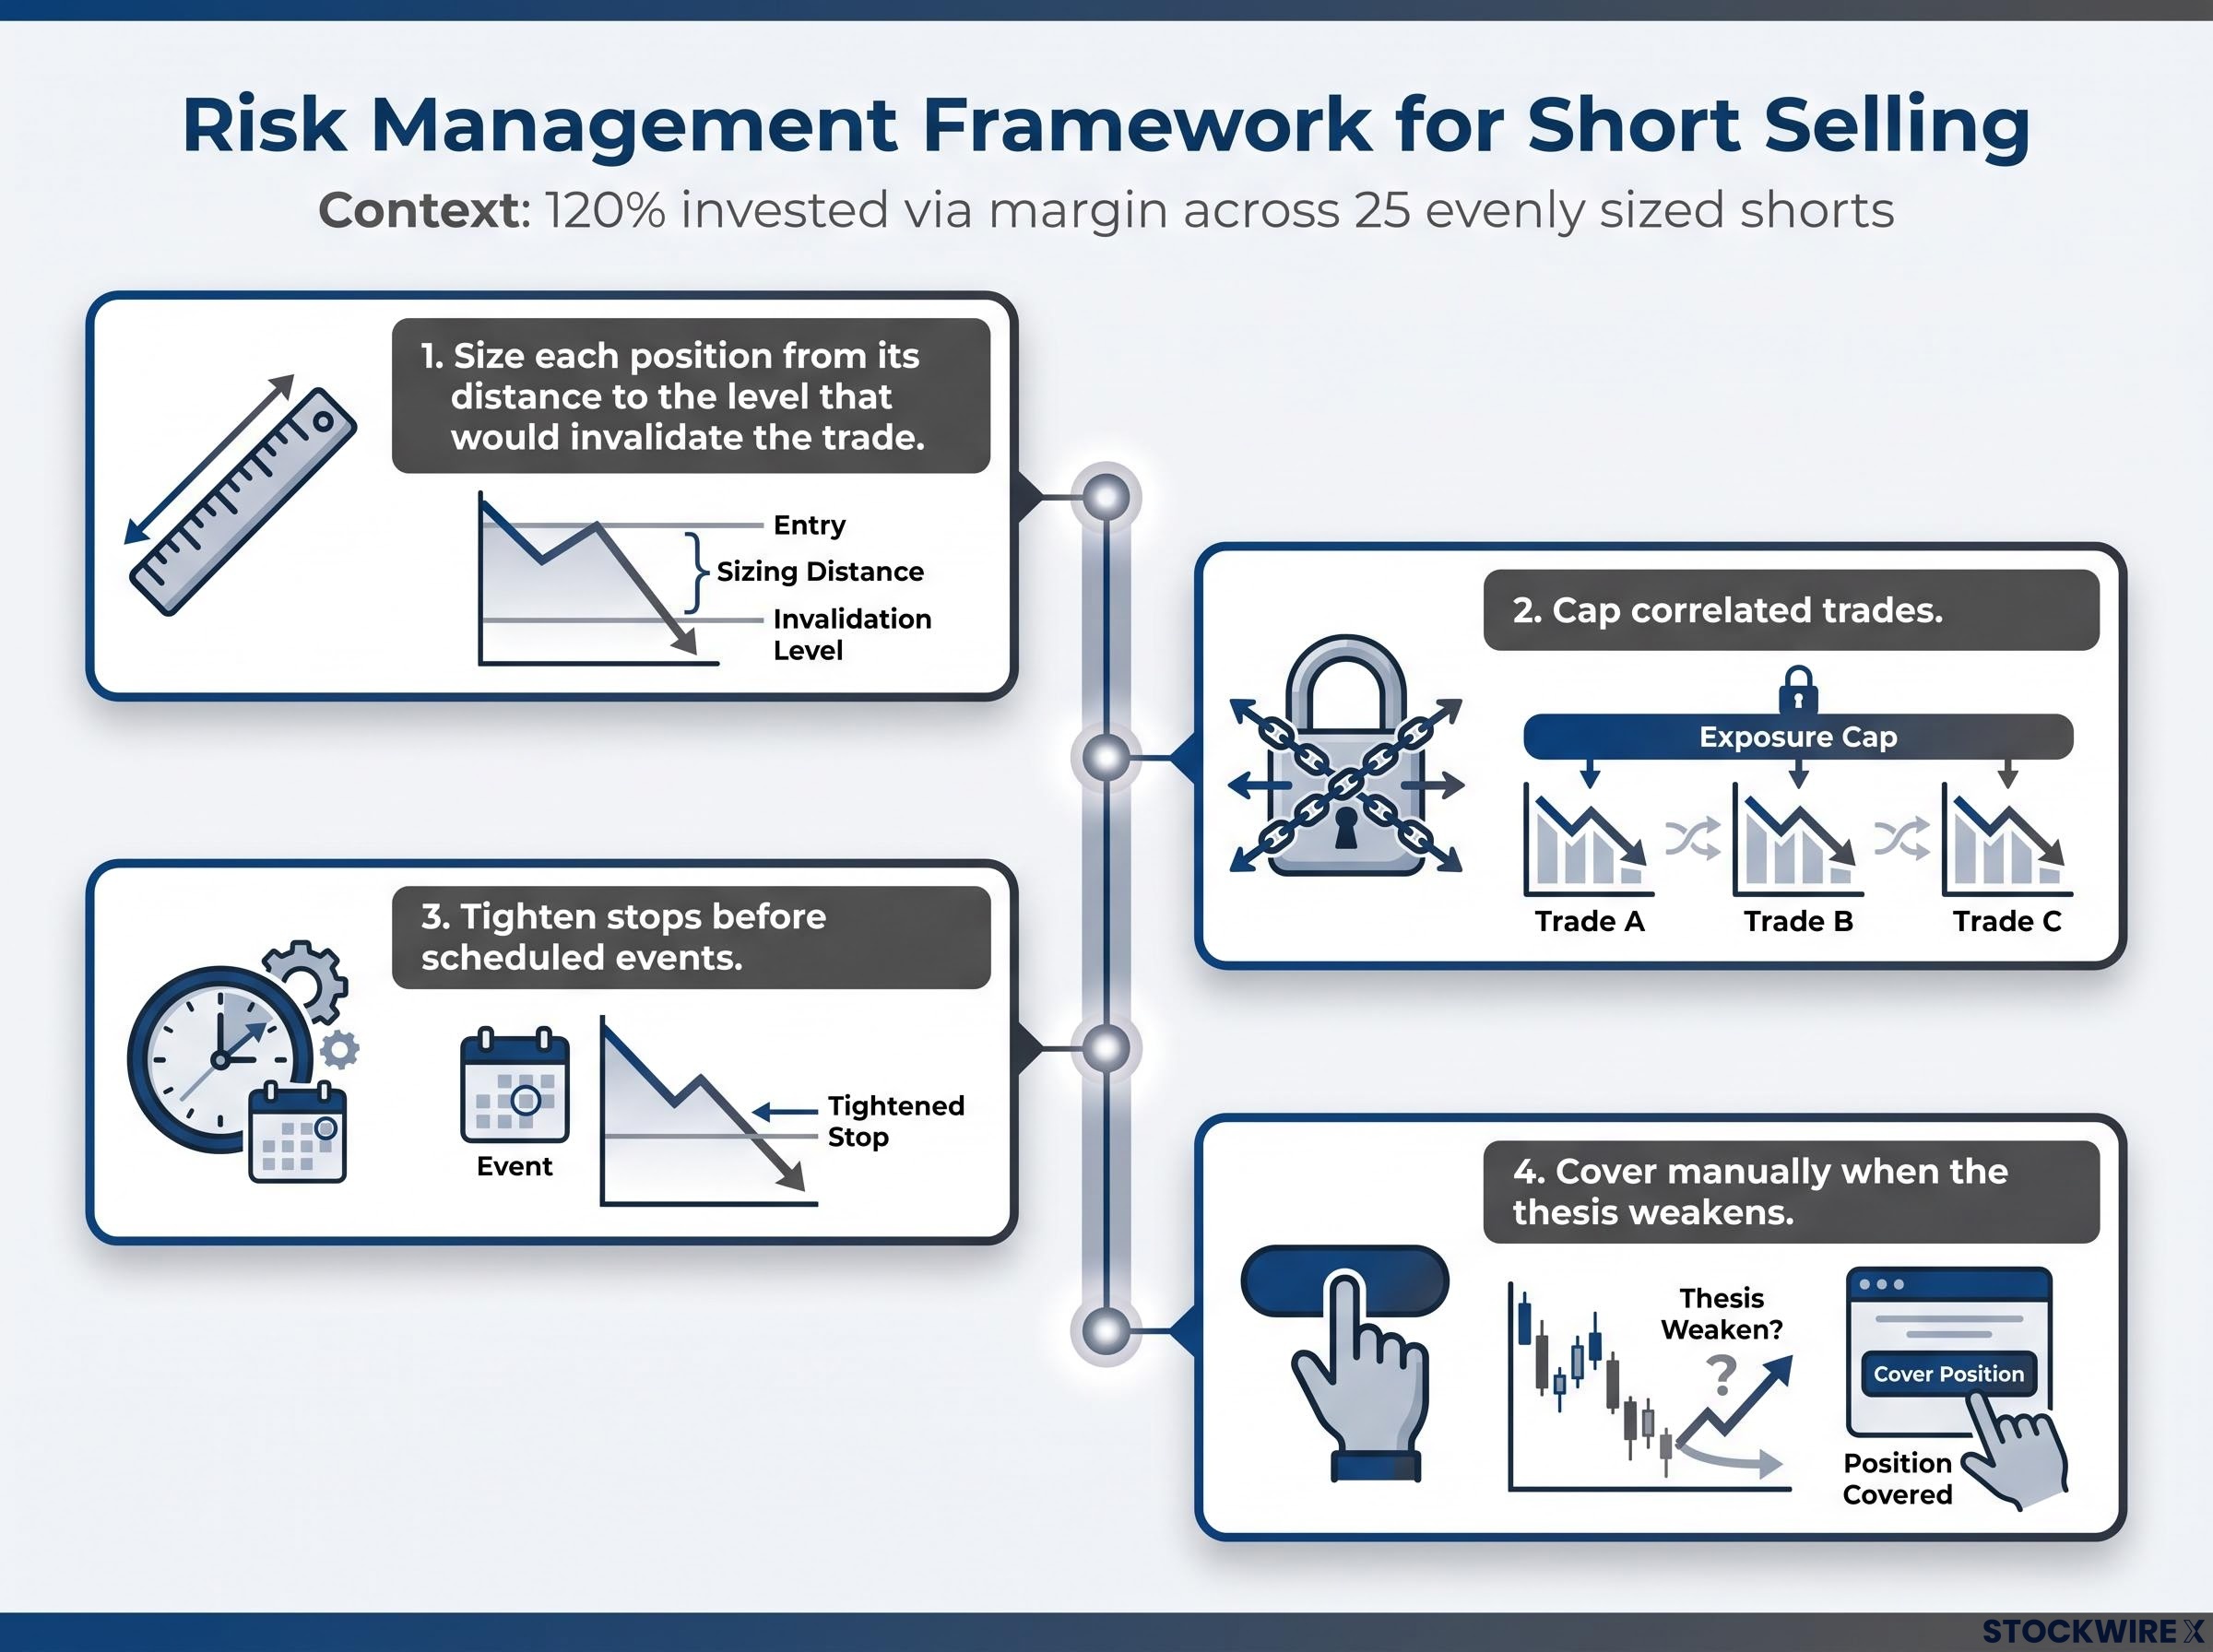
Knight runs about 120% invested, using margin (money borrowed from a broker), across 25 roughly evenly sized shorts. He covered a Diamonds ETF short manually at a small profit rather than waiting for his stop-loss, a preset exit price.
His stops sit at defined points: China’s FXI near $34, just above the prior high, and XLU at 76.5, near a price gap and a broken triangle pattern. He tightened stops on Planet Labs (about 80% off its peak above $50), Synopsys, Firefly Aerospace (near $14) and an optoelectronics name. He avoids penny stocks, covered his Tesla short on Monday, and holds no Netflix position.
- Size each position from its distance to the level that would invalidate the trade.
- Cap correlated trades.
- Tighten stops before scheduled events.
- Cover manually when the thesis weakens.
Leverage warning 2026 risk guidance warns that leveraged shorts can face forced liquidation when crowded trades reverse. It recommends cutting exposure before volatility rises and keeping a free-margin buffer. One squeeze guide cites risking about 1%-3% of capital on volatile setups.
Where the bearish case can fail
Monday’s chip rebound showed how quickly short squeezes can hit, as bears are forced to buy back shares. Netflix, Tesla, Brazil’s runoff, Israel’s election and the midterms can all gap prices past stops. Knight says he will not trade on hunches about election outcomes. Meanwhile, profits keep beating forecasts, and Ryan Detrick of Carson Group points to favourable post-midterm history.
After-hours gaps show why sizing matters more than stops: thirty equally sized shorts at about 3% of equity each turn a 13% single-stock jump into a loss of roughly 0.4% of the account.
Whichever direction you lean, many small positions with predefined exits limit the damage when headlines gap the market.
What this session changes, and what it does not
Tuesday moved no major level. It did confirm a pattern: headlines lift prices briefly, while earnings and rates decide whether gains last.
The near-term markers are clear. Watch Netflix’s results tonight, Tesla on Wednesday, ES around 7,670, SMH at 536, and the 3 November midterms. Past performance does not guarantee future results, and these levels reflect one trader’s charts rather than consensus.
The decision in front of you is about sizing, not prediction. If a single gap would hurt your portfolio, the time to resize is before the event.
Readers interested in the election setup can read our deep-dive into midterm elections and the stock market, which shows what VIX levels imply about event risk.
This article is for informational purposes only and should not be considered financial advice. Investors should conduct their own research and consult with financial professionals before making investment decisions.