
You have probably spent hours comparing index funds, reading up on ETFs, or debating which stock deserves your next contribution. Meanwhile, there is a financial move sitting within reach right now that can return 20% or more, and it has nothing to do with the market.
That is not a promotional pitch. It is arithmetic.
Investment selection gets the lion’s share of attention in personal finance content, but the order in which you make your financial decisions matters just as much. Two moves in particular, clearing high-interest debt and capturing your employer’s retirement match, function as guaranteed-return opportunities that most market investments cannot realistically beat over the same window.
The catch is that these returns come before any trading platform enters the picture. They are quieter, they are less exciting, and they are almost always available before you buy a single share.
Here is the framework for deciding where your next available dollar should go, grounded in the actual mathematics rather than gut feeling. Once you can see your debt and your match as returns rather than obligations, the right sequence becomes obvious.
Why the math on high-interest debt repayment beats the market
Start with a simple number. Carry a $5,000 balance on a credit card charging 20% annual interest, leave it untouched for a year, and you accumulate roughly $1,000 in interest charges.
That $1,000 is money leaving your pocket for nothing in return. Now flip the perspective. If you pay off that balance instead, you avoid the $1,000 entirely, which is functionally the same as earning a 20% return on the money you used to clear it.
Paying off debt is not technically an investment. But the financial effect is mathematically identical to earning a guaranteed, after-tax return equal to the interest rate you stop paying. The interest rate on your statement is not just a cost; it is the guaranteed annual return you are handing to a lender to hold your balance, and seeing it that way changes the entire calculation.
To justify investing instead of repaying, any investment you make would need to consistently deliver after-tax returns above your debt’s interest rate. At 20% or more, that is a hurdle even long-run equity returns rarely clear.
Recent regional data shows how steep these guaranteed costs have become. These figures carry an unverified flag in the underlying research, so treat them as illustrative benchmarks and check your own current rate:
Credit card delinquency trends provide useful context for why these rates have reached current levels: US card delinquencies hit a 15-year high in Q1 2026, driven heavily by younger and lower-income borrowers who face the steepest compounding costs from carrying balances at today’s average APRs.
LendingTree’s tracker of the average credit card interest rate in America, drawing on Federal Reserve data, placed the figure at 20.94% in Q2 2026, confirming that the typical US cardholder faces a guaranteed-return hurdle that long-run equity performance rarely clears.
- United States: average commercial bank credit card rate of approximately 20.94% (Q2 2026, Federal Reserve).
- United Kingdom: average credit card APR of approximately 36.81% as of May 2026 (Finder UK).
- Australia: average standard purchase rate of approximately 20.99% (June 2026 RBA data via Mozo).
- Canada: typical purchase APR ranging from 19.99% to 25.99%.
The reason this comparison is so lopsided is that the debt return is guaranteed and risk-free, while no market investment is. You can hope for a strong year in equities. You cannot hope your way out of a credit card charge; it is contractually certain.
A 2026 comparison modelled $6,700 of credit card debt at 21% APR against investing the same amount at a hypothetical 10% annual return. Over ten years, the debt cost roughly $14,070 in interest paid to the card issuer, while the investment produced only around $10,680 in gains. The guaranteed cost outpaced the plausible upside.
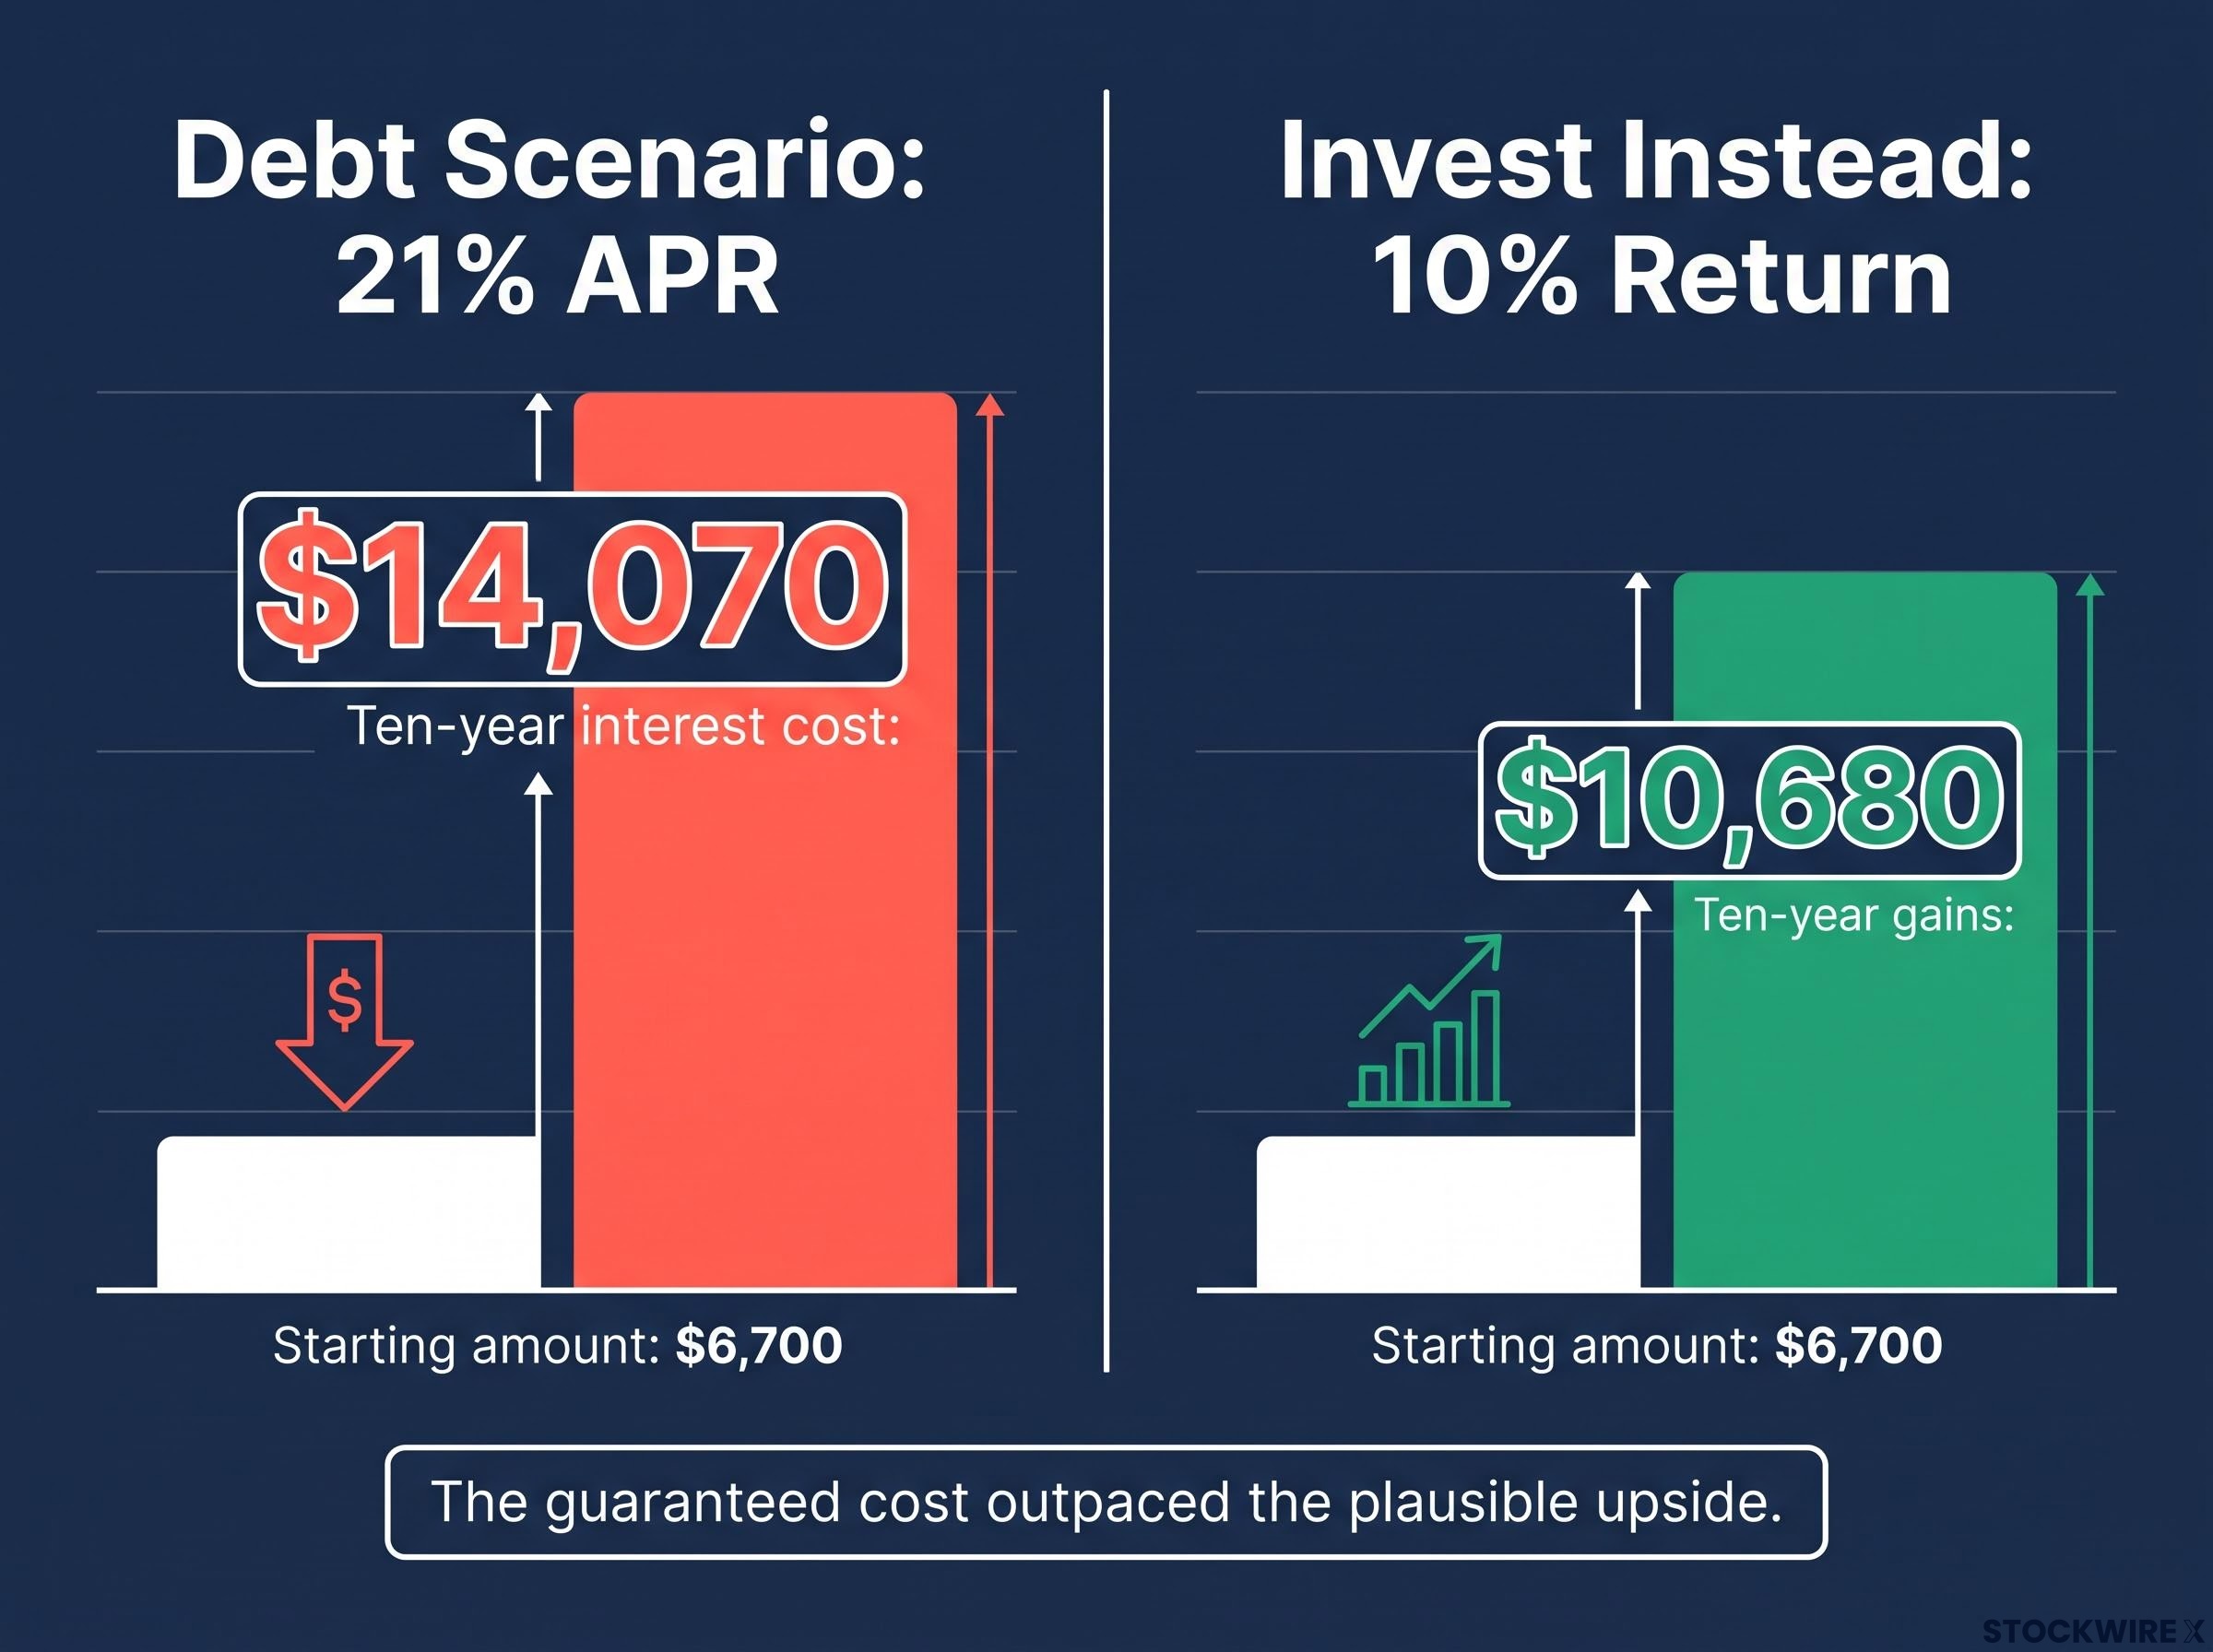
Laid side by side, the asymmetry is hard to argue with:
| Debt scenario (21% APR) | Invest instead scenario (10% return) |
|---|---|
| Starting amount: $6,700 | Starting amount: $6,700 |
| Ten-year interest cost: $14,070 | Ten-year gains: $10,680 |
| Net position: paying out more than the debt itself | Net position: gains fall short of the interest avoided |
The takeaway is not that investing is bad. It is that a guaranteed 20% return is not a contest the market usually wins.
When big ASX news breaks, our subscribers know first
Employer matching is a 50-100% instant return hiding in your pay slip
If a 20% guaranteed return sounds good, an employer match can hand you an instant 50% to 100% return on the money you contribute. It is the closest thing to free money in personal finance, and it is likely sitting in your pay slip right now.
An employer match is deferred compensation. It is part of your total pay package, which means not contributing enough to capture it is the same as voluntarily declining part of your salary.
The mechanics are worth understanding because formulas vary and you need to check your own plan documents. Two common structures illustrate the point: a straight 50% match on contributions up to 6% of salary, and a tiered formula such as 100% on the first 3% plus 50% on the next 2%, totalling a 4% maximum employer contribution.
Here is what those structures deliver in practice, using an employee earning $60,000:
| Match formula | Employee contributes | Employer adds |
|---|---|---|
| 100% up to a cap | Full cap contribution | Dollar for dollar (a 100% return) |
| 50% on up to 6% of salary, contributing 6% ($3,600) | $3,600 | $1,800 (the full match) |
| 50% on up to 6% of salary, contributing only 3% ($1,800) | $1,800 | $900 (half the match, $900 forfeited) |
That third row is the trap. The employee who contributes only 3% permanently forfeits $900 of available employer money that year, with no way to reclaim it.
If you are contributing below your employer’s match cap, you are accepting a pay cut, and the exact size of that pay cut is calculable from your own pay slip today.
Fidelity’s Q2 2026 analysis found that 18.8% of eligible employees failed to contribute enough to capture their full employer match, leaving a significant share of workers walking away from guaranteed compensation.
The numbers are meaningful across markets. Among US plans with match formulas, the average promised match sits at roughly 4.5% to 4.7% of pay. In Canada, typical group RRSP matches most commonly fall in the 3% to 5% of salary range.
The vesting catch: when the match is not yet yours
There is one caveat that keeps this from being pure free money, and it is vesting.
Vesting determines when employer contributions actually belong to you. Cliff vesting is all or nothing at a set year of service; graded vesting hands you ownership in rising percentages over time.
Under a common three-year cliff schedule, you own 0% of the employer match until you complete exactly three years, and leaving earlier forfeits all of it. In one illustrative case drawn from the underlying research, an employee under such a schedule forfeited an estimated $74,000 in potential match growth by leaving just before full vesting.
The single actionable step is straightforward: locate your vesting schedule in your plan documents or HR portal before you make any decision about changing jobs.
How to sequence these decisions without leaving money on the table
Once you can see debt and the match as returns, the question becomes one of order. For any given dollar of spare cash, where should it go first?
The answer follows a prioritised sequence based on guaranteed return, not on emotion or inertia. Financial institutions including Vanguard and Morningstar use similar “next-dollar” frameworks, ranking high-interest debt repayment and full match capture as the top wealth-maximising uses for extra cash precisely because both are effectively risk-free.
Here is the order that most frameworks converge on:
- Build a modest, highly liquid emergency cash buffer so an unexpected bill does not force you back onto the credit card.
- Pay down high-interest, non-deductible debt, especially credit cards, where the guaranteed return is highest.
- Contribute at least enough to capture the full employer retirement match, locking in that instant 50% to 100% return.
- Expand into broader long-term investing and any unmatched retirement contributions.
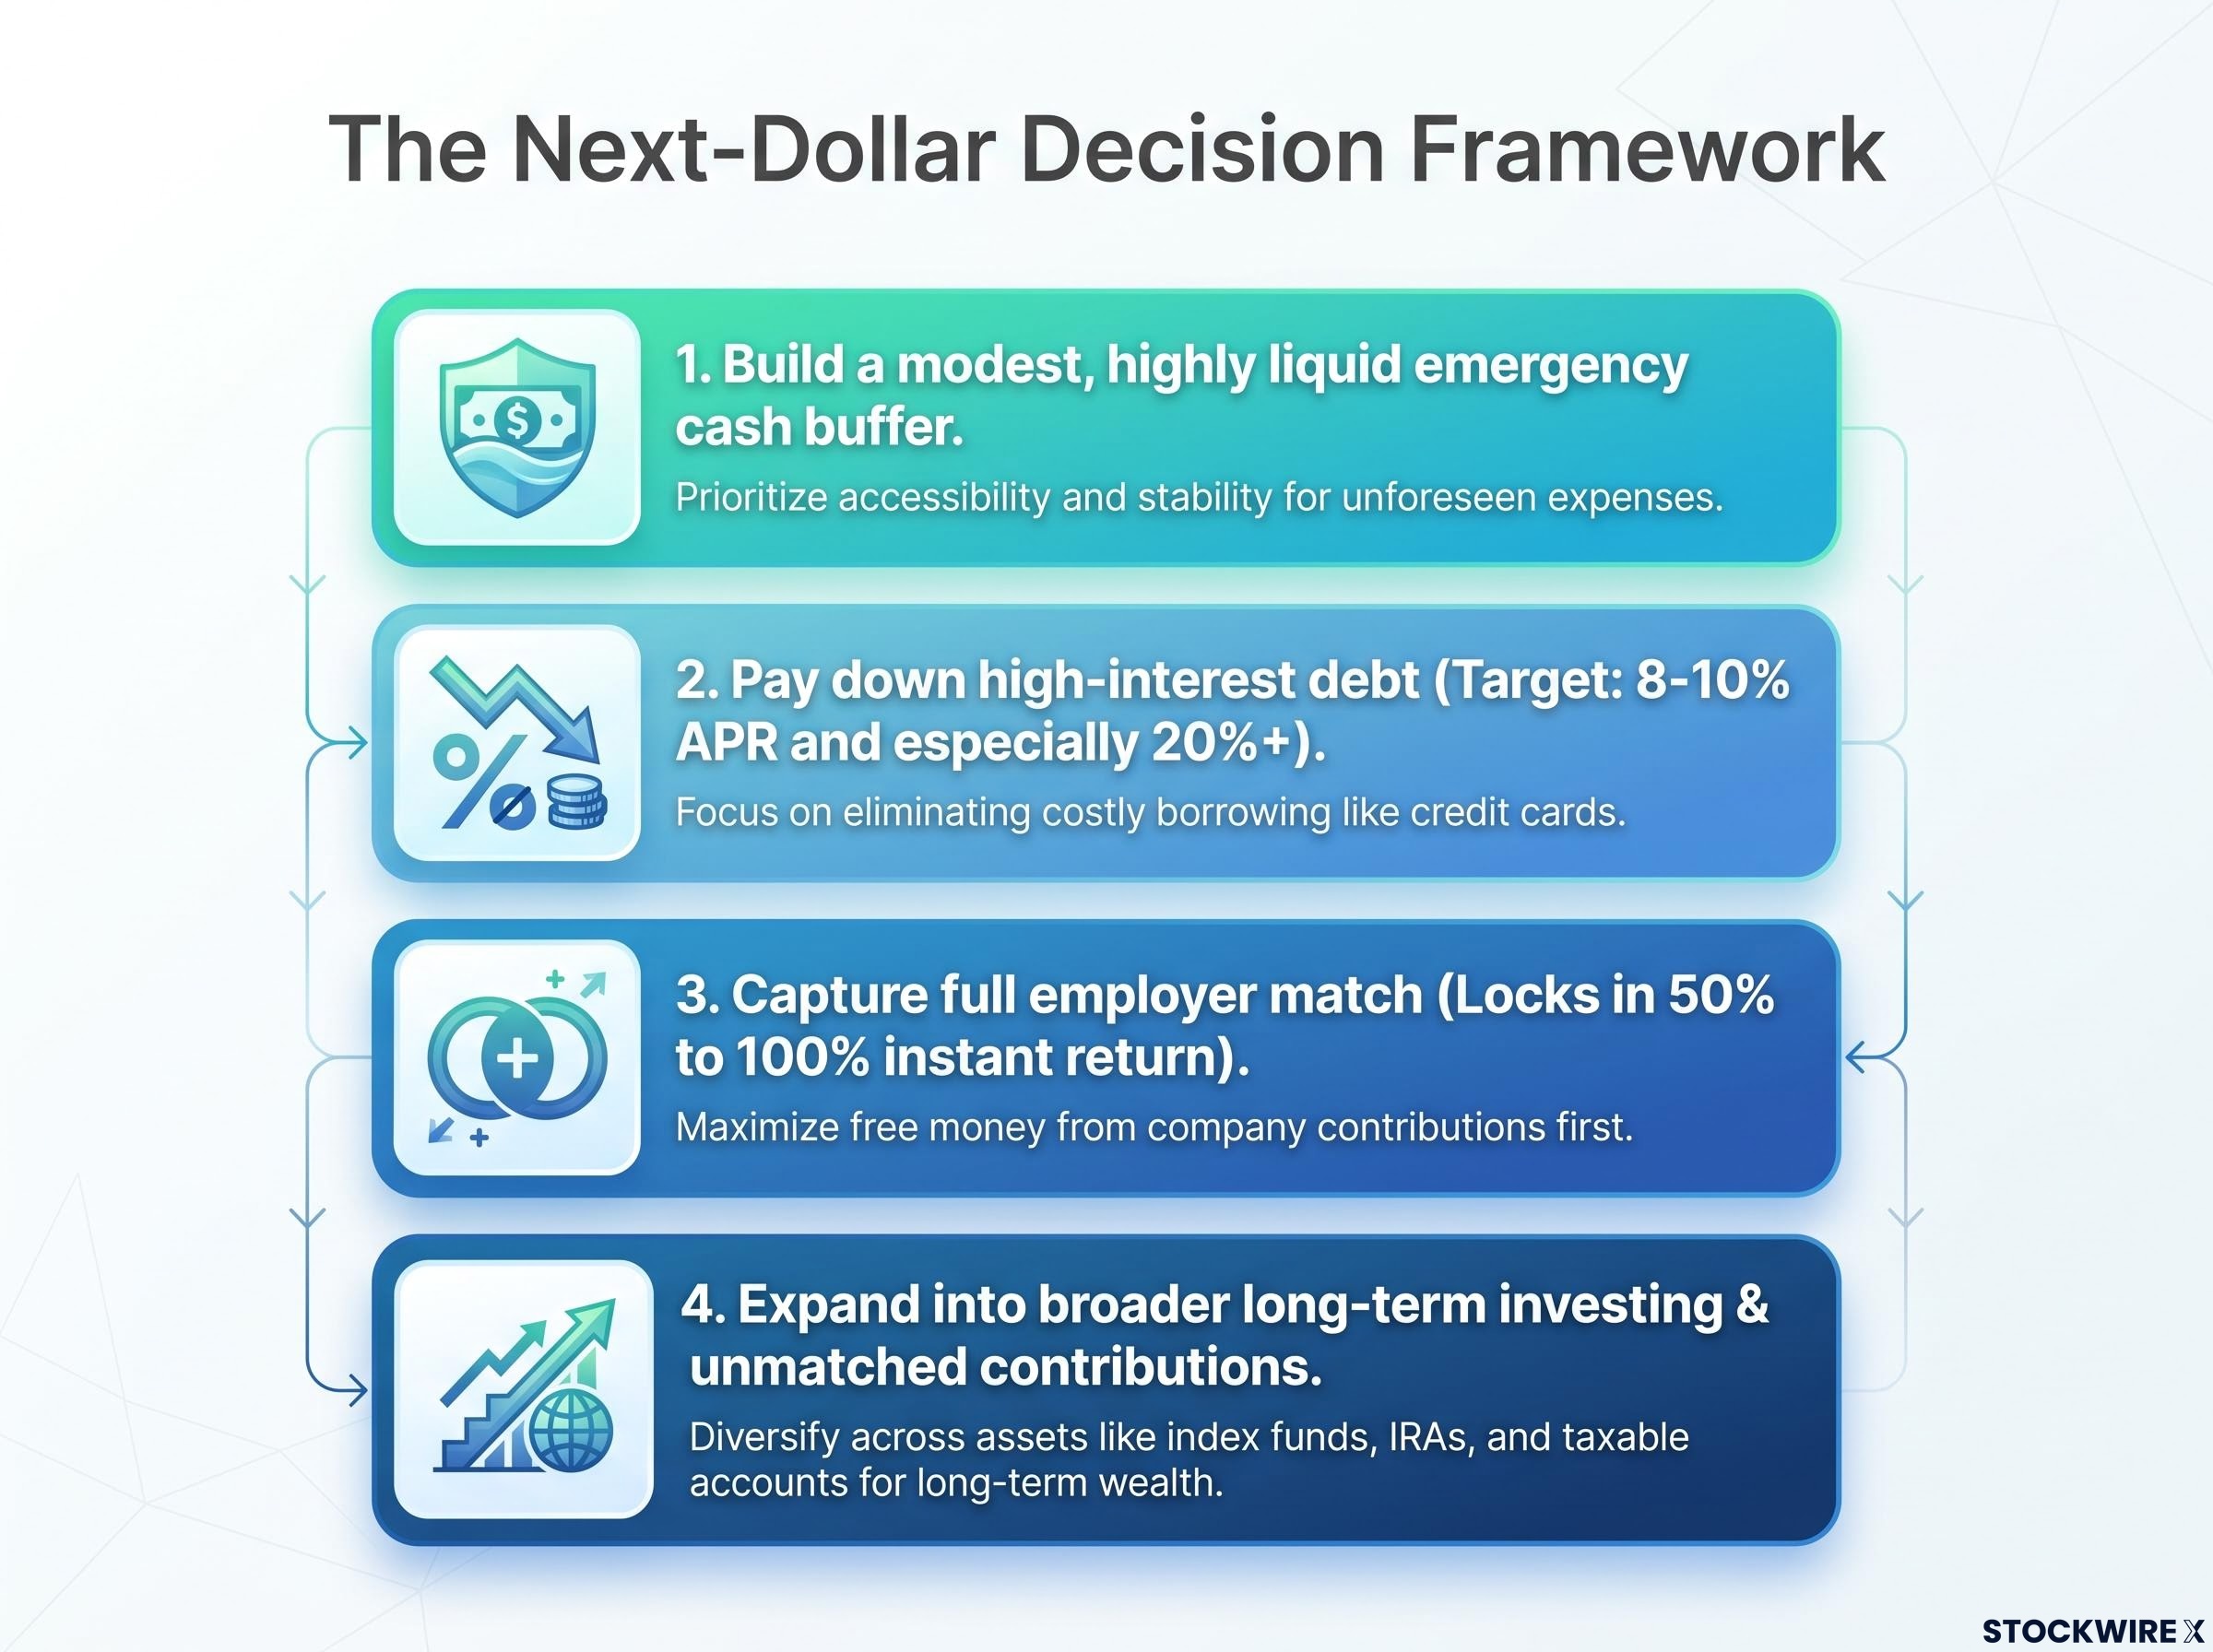
The reason step two often sits above step three is rate-sensitive. A 20% credit card charge beats even a 50% one-time match when the debt keeps compounding month after month, though many people can attack both in parallel once the buffer exists.
This is not a blanket “pay off all debt first” rule. It is rate-sensitive, and the threshold rules matter:
- High-rate debt at 8-10% APR or above, and especially 20%+, warrants aggressive repayment before market investing.
- Moderate-rate debt at 6-9% APR is a judgment call, where you can reasonably split effort between paying down and investing.
- Low-rate debt below 4-5% APR, such as many mortgages and low-rate student loans, can stay at minimum payments while you prioritise retirement contributions, because the after-tax cost is often lower than expected portfolio returns.
The mortgage prepayment decision sits in a different tier from credit card debt, because the after-tax interest rate on most fixed mortgages falls well below the threshold where guaranteed repayment reliably beats expected equity returns.
The framing anchor: debt carrying an APR above roughly 8-10% generally warrants aggressive repayment before market investing, because that is where the guaranteed return starts to exceed what equities have historically delivered.
That 8-10% line is not arbitrary. Equities have historically returned around 6-10% annually over long periods, so once your debt rate climbs above that band, paying it off reliably beats what the market can plausibly hand you.
The framework means you do not have to choose between debt and investing in the abstract. You only need to know your debt rate and your match terms, and the correct order becomes mechanical.
Putting the framework to work across different starting points
The sequence is only useful once you can locate yourself in it. Three representative starting points show how the logic translates into a concrete first move. These are illustrative educational examples, not personalised advice.
Scenario 1: carrying high-interest credit card debt
- Situation: $3,000 of credit card debt at 22% APR, with no employer match on offer.
- Sequencing logic: the 22% guaranteed return from repayment dwarfs any plausible investment return, and there is no match to compete for.
- First move: aggressive debt paydown, not market entry. Every dollar cleared earns a locked-in 22%.
Scenario 2: under-contributing to a matched retirement plan
- Situation: no high-interest debt, an employer match of 50% on up to 6% of salary, but you are currently contributing only 3%.
- Sequencing logic: raising your contribution to 6% captures the full match and doubles the employer’s contribution on those additional dollars.
- First move: increase contributions to hit the 6% cap, which represents an immediate 50% return on the extra dollars you direct there.
Scenario 3: low-rate debt only, match already captured
- Situation: only low-rate debt, such as a mortgage at 3.5% APR, with the full employer match already secured.
- Sequencing logic: with no high-interest debt to clear and the match locked in, the guaranteed-return options are exhausted.
- First move: expand into broader market-based investing and unmatched retirement contributions, where growth potential now outweighs the low cost of the debt.
Whichever scenario fits you tells you not just what to do next, but why it is the highest-return use of your next dollar relative to any alternative you are weighing.
The meta-lesson is that the sequence of financial decisions compounds in the same way interest does. Starting in the right order is itself a form of return optimisation.
This article is for informational purposes only and should not be considered financial advice. The scenarios above are illustrative; verify your own rates, plan terms, and tax situation, and consult a qualified financial professional before making decisions. Past performance does not guarantee future results, and financial projections are subject to market conditions and various risk factors.
Getting the sequence right is the foundation every other investment decision builds on
Before investment selection matters at all, the order of your financial decisions determines how much of each dollar actually works for you. Getting that sequence right is itself a form of return maximisation, and it costs nothing but attention.
The two moves examined here, clearing high-interest debt and capturing the full employer match, are the only places in personal finance where returns are effectively guaranteed before market risk enters the picture. A 20% avoided interest charge and a 50% instant match are not forecasts; they are arithmetic.
Timing and sequencing errors consistently outweigh poor asset selection as sources of wealth destruction: a one-year delay in beginning a 30-year investment horizon costs roughly eight times the value of the single missed contribution, a compounding penalty that dwarfs most stock-picking mistakes.
Once those foundations are secured, market investing becomes a far more powerful tool, because it is no longer competing against guaranteed returns you are quietly leaving behind. Clear the guaranteed wins first, and every dollar you eventually put into the market gets to do its full job.
For readers who have cleared high-interest debt and captured the full match but are now uncertain how much cash to keep before deploying into the market, our dedicated guide to cash versus investing decisions covers the stage-based framework for sizing your position across accumulation and preservation phases.