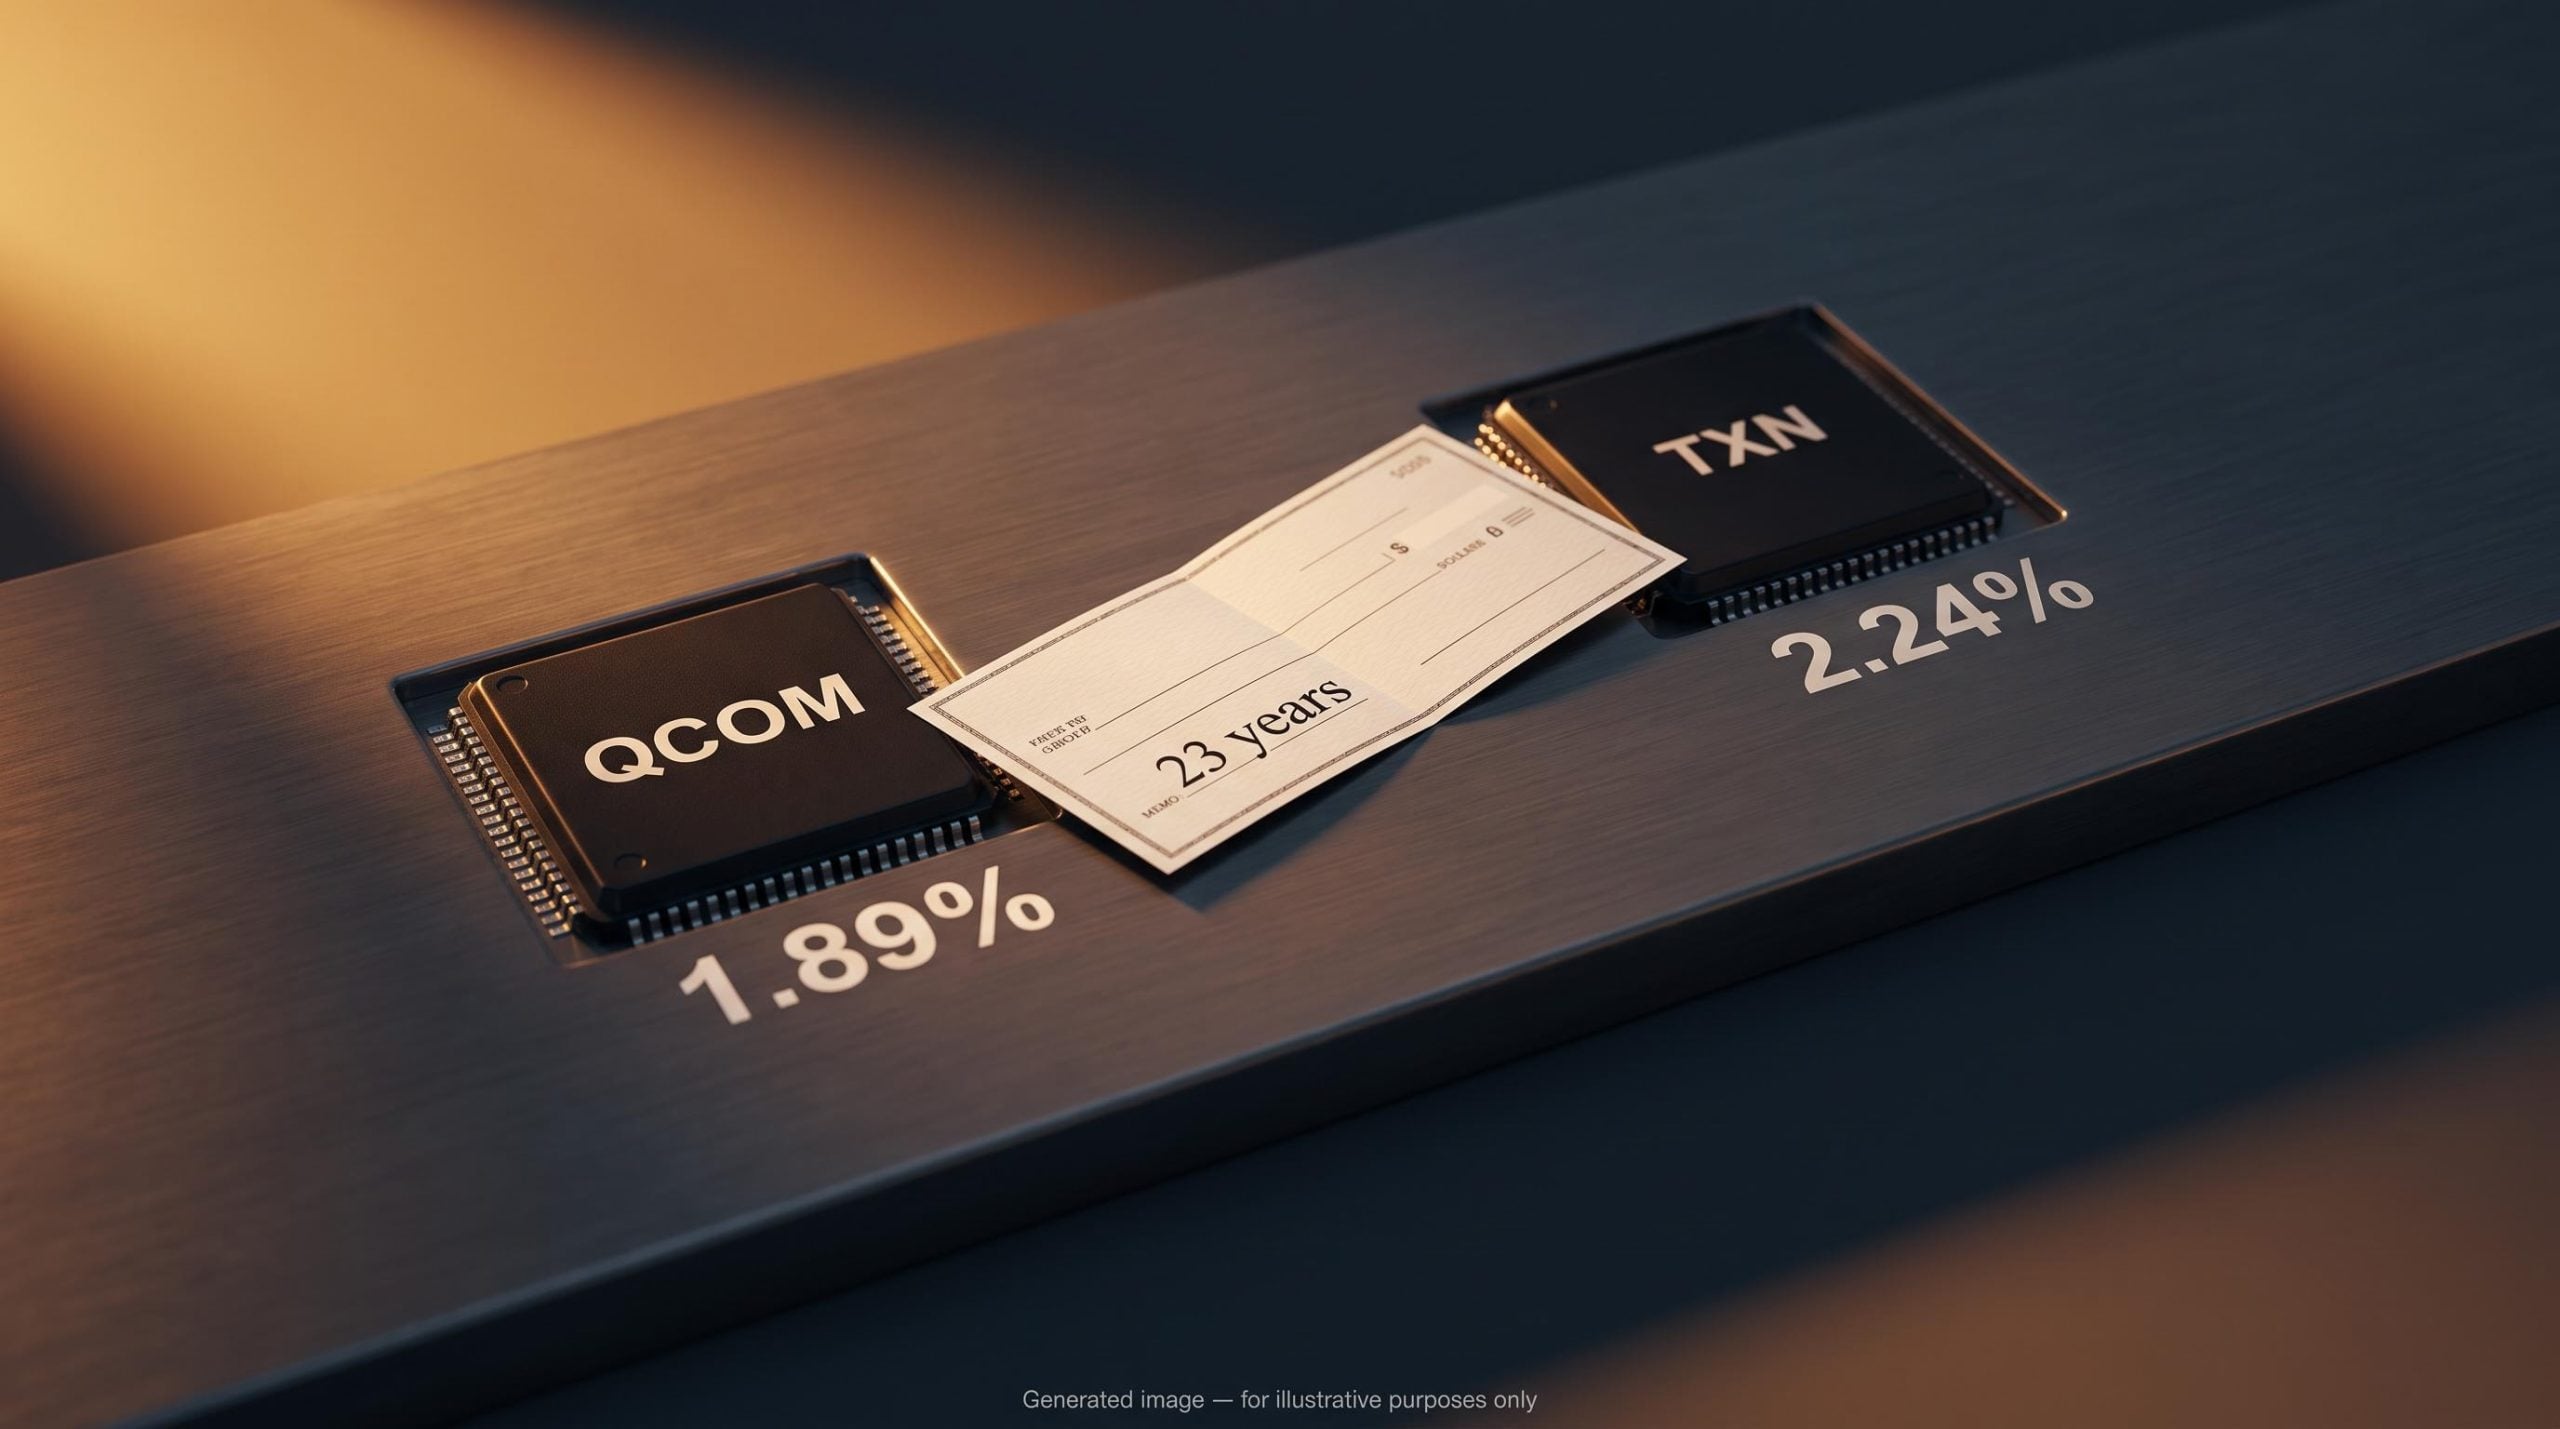
Most SCHD investors describe the fund to a friend the same way: a steady dividend play, heavy in consumer staples and healthcare, the kind of thing you buy and forget. As of 22 September 2026, the fund’s two largest positions are Qualcomm and Texas Instruments. No portfolio manager made that call. A rulebook did.
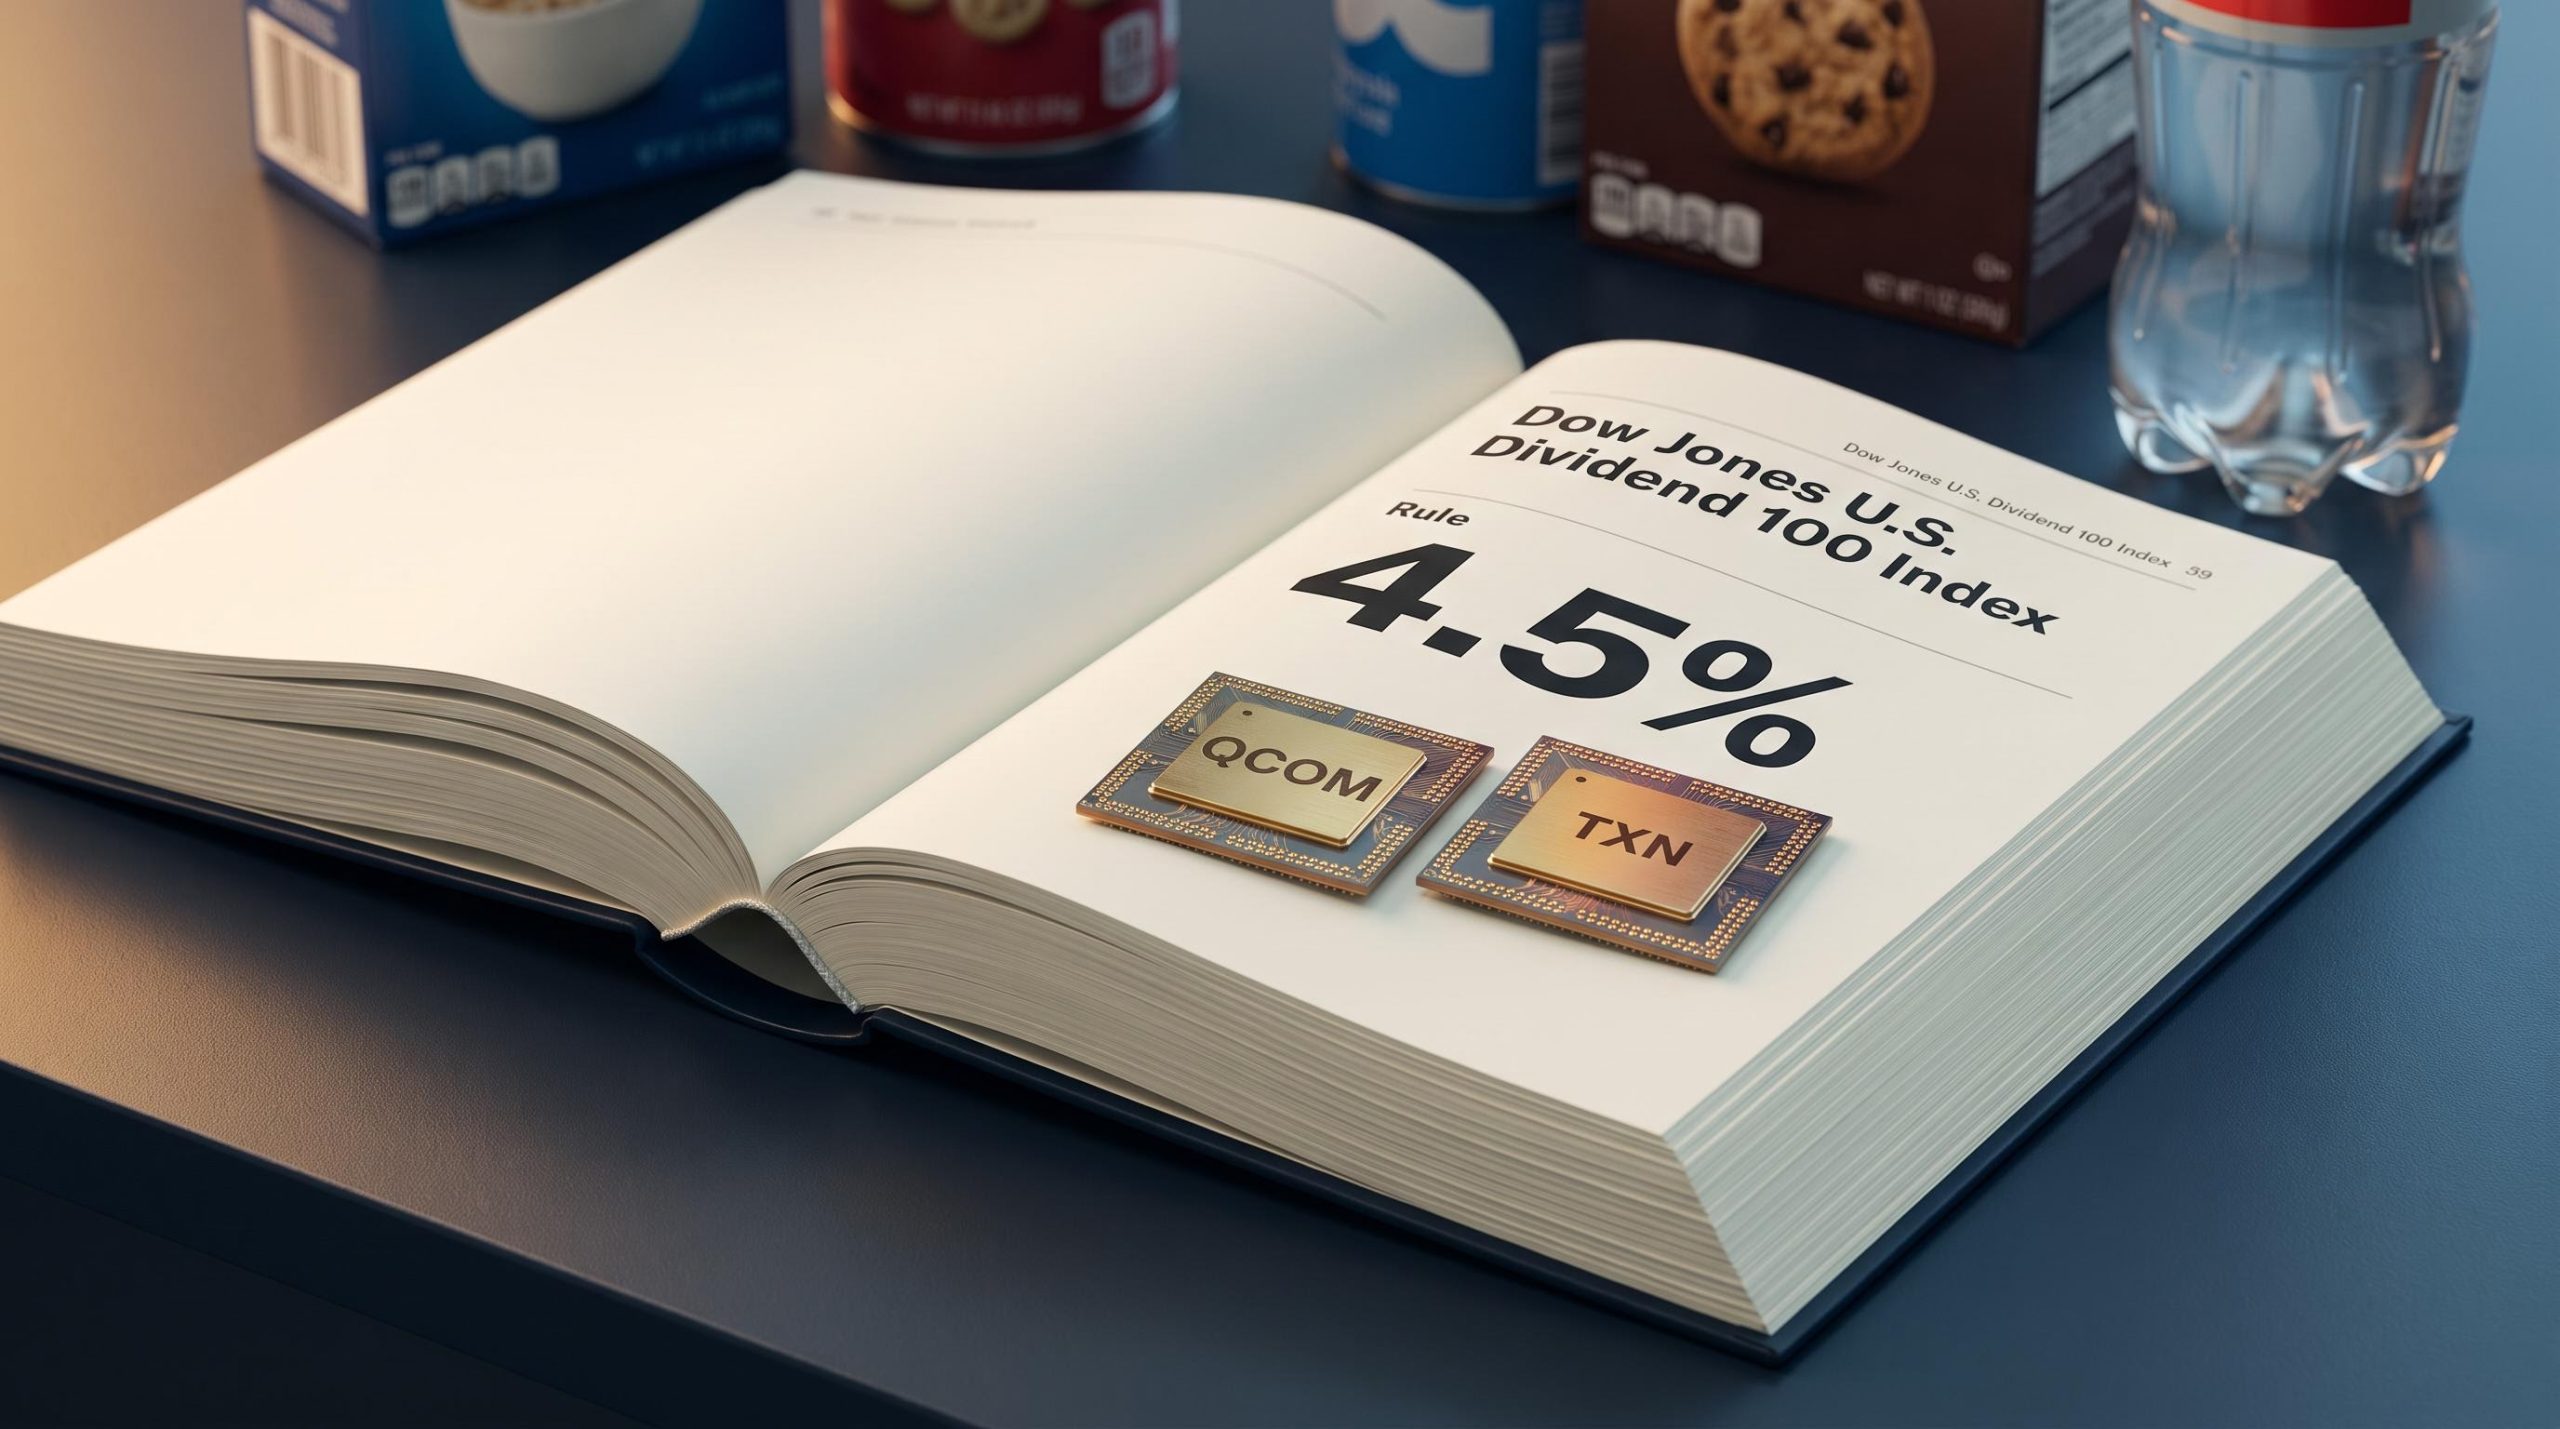
SCHD tracks the Dow Jones U.S. Dividend 100 Index, which selects and weights its holdings through a fully automated, rules-based process that runs on a fixed schedule. When that process ran its September 2026 quarterly rebalancing, the mechanical output pushed two semiconductor names to the top of a fund most people associate with Procter & Gamble and Coca-Cola.
Here is how the methodology produced that result, and why it is entirely consistent with the index rules. More importantly, you will finish with a clear model for how to think about the fund from here.
How the Dow Jones U.S. Dividend 100 Index actually selects and weights its holdings
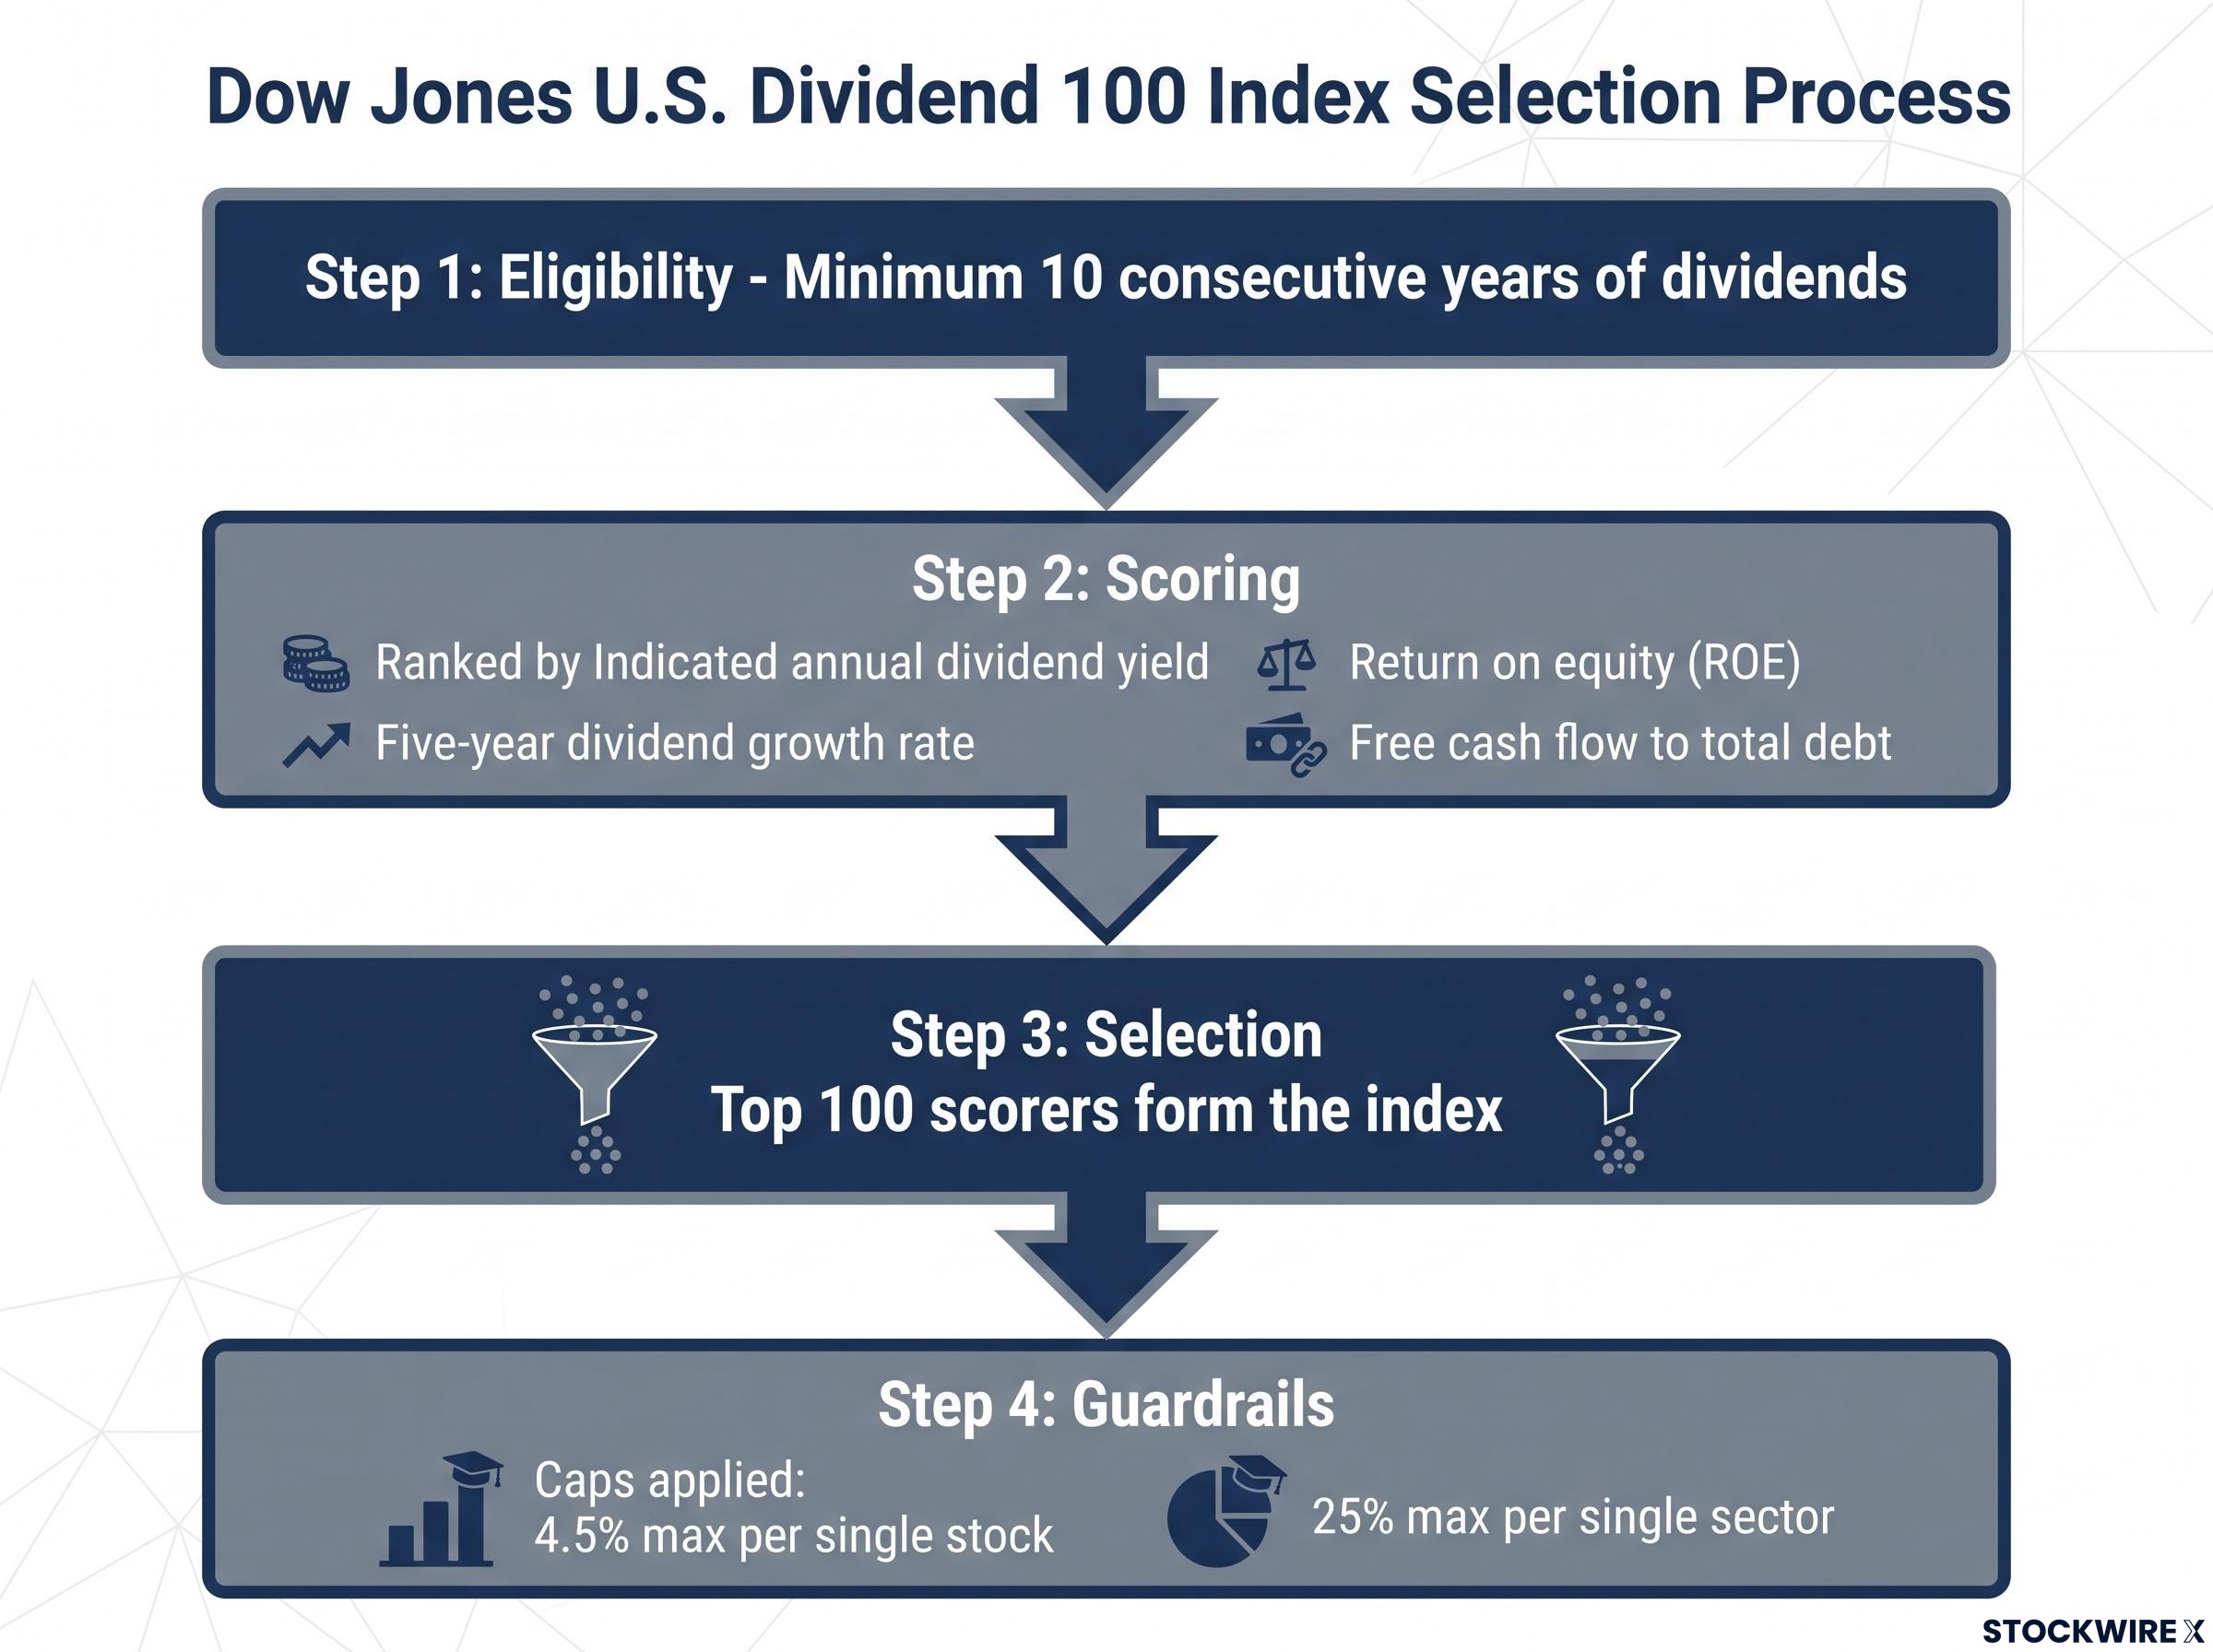
Start with eligibility, because that is where the sector assumptions quietly fall apart. To be considered at all, a company must have paid dividends for at least 10 consecutive years and clear minimum thresholds for size and trading volume. That baseline says nothing about which industry a company operates in.
From the eligible pool, the index ranks every company on a composite score built from four metrics:
- Indicated annual dividend yield
- Five-year dividend growth rate
- Return on equity (ROE), which measures how much profit a company generates from shareholders’ money
- Free cash flow to total debt, a gauge of how comfortably a company can cover what it owes from the cash its operations throw off
The top 100 scorers form the index. Nothing in that scoring formula rewards or penalises a company for being a utility, a consumer staple, or a chipmaker.
Once the 100 are selected, two guardrails govern how much of the fund each one gets. No single stock may exceed 4.5% of the index, and no single sector may exceed 25%. When a stock or sector would breach its cap, the excess weight is redistributed across the remaining holdings.
The index selects the highest scorers on dividend and quality criteria from any eligible sector. It contains no explicit tilt toward defensive names. A semiconductor company with a strong dividend record is structurally just as eligible to rank first as a soft-drink maker.
One detail worth flagging: sources differ on the precise weighting basis, with some describing yield-weighting and others describing float-adjusted market-cap weighting subject to the caps. The official S&P Dow Jones Indices methodology document is the authority on that specific point. Both descriptions agree on the cap structure, which is what matters most for understanding the outcome.
If you assumed SCHD’s conservative branding reflected a permanent defensive posture, this is the moment to reset that model. The rules make semiconductors eligible in principle. What you see in the holdings today is that principle playing out.
The gap between a fund’s name and its actual composition is a recurring theme in ETF due diligence, where a label like ‘dividend’ or ‘conservative’ can obscure significant sector concentration and top-10 holding weight that only appear when you read the methodology document directly.
When big ASX news breaks, our subscribers know first
The two-process calendar: how March reconstitution and quarterly rebalancing work differently
The fund does not “rebalance” in a single annual event. It runs two distinct processes at different times, and they do different jobs. Confusing the two is the fastest way to draw the wrong conclusion about what changed.
Here is the annual sequence:
- March, annual reconstitution: the full selection screen re-runs, changing which companies are in the index.
- June, quarterly weight reset: caps are reapplied and weights reset, with no change to membership.
- September, quarterly weight reset: same mechanism as June.
- December, quarterly weight reset: same mechanism again.
The distinction matters because membership and weighting are separate levers. Reconstitution decides who is in the club. Quarterly rebalancing decides how much room each member gets.
| Process | When it occurs | What it changes | What it does not change |
|---|---|---|---|
| Annual reconstitution | March each year | Which companies are in the index (membership) | Nothing is fixed; the full screen re-runs |
| Quarterly rebalancing | June, September, December | The weight of each holding, applying the 4.5% and 25% caps | Constituent membership stays the same |
The March 2026 reconstitution did the heavier lifting on sector composition. Running the quality-and-yield screen against fresh data trimmed energy exposure by roughly 8 percentage points, while healthcare rose about 4 percentage points and technology gained around 3 percentage points. That is where the technology tilt originated, through admitting and dropping constituents.
What the September 2026 quarterly rebalancing specifically changed
The September 2026 rebalance changed no membership at all. It reset weights within the existing set and reapplied the caps, which is what produced the specific top-holdings ranking you can see right now.
This detail resolves a discrepancy you may have noticed on aggregator sites. N-PORT regulatory filings dated 31 May 2026 showed Qualcomm at roughly 6.74% and Texas Instruments at roughly 5.90%, both well above the 4.5% individual cap. Those figures predate the September cap reset.
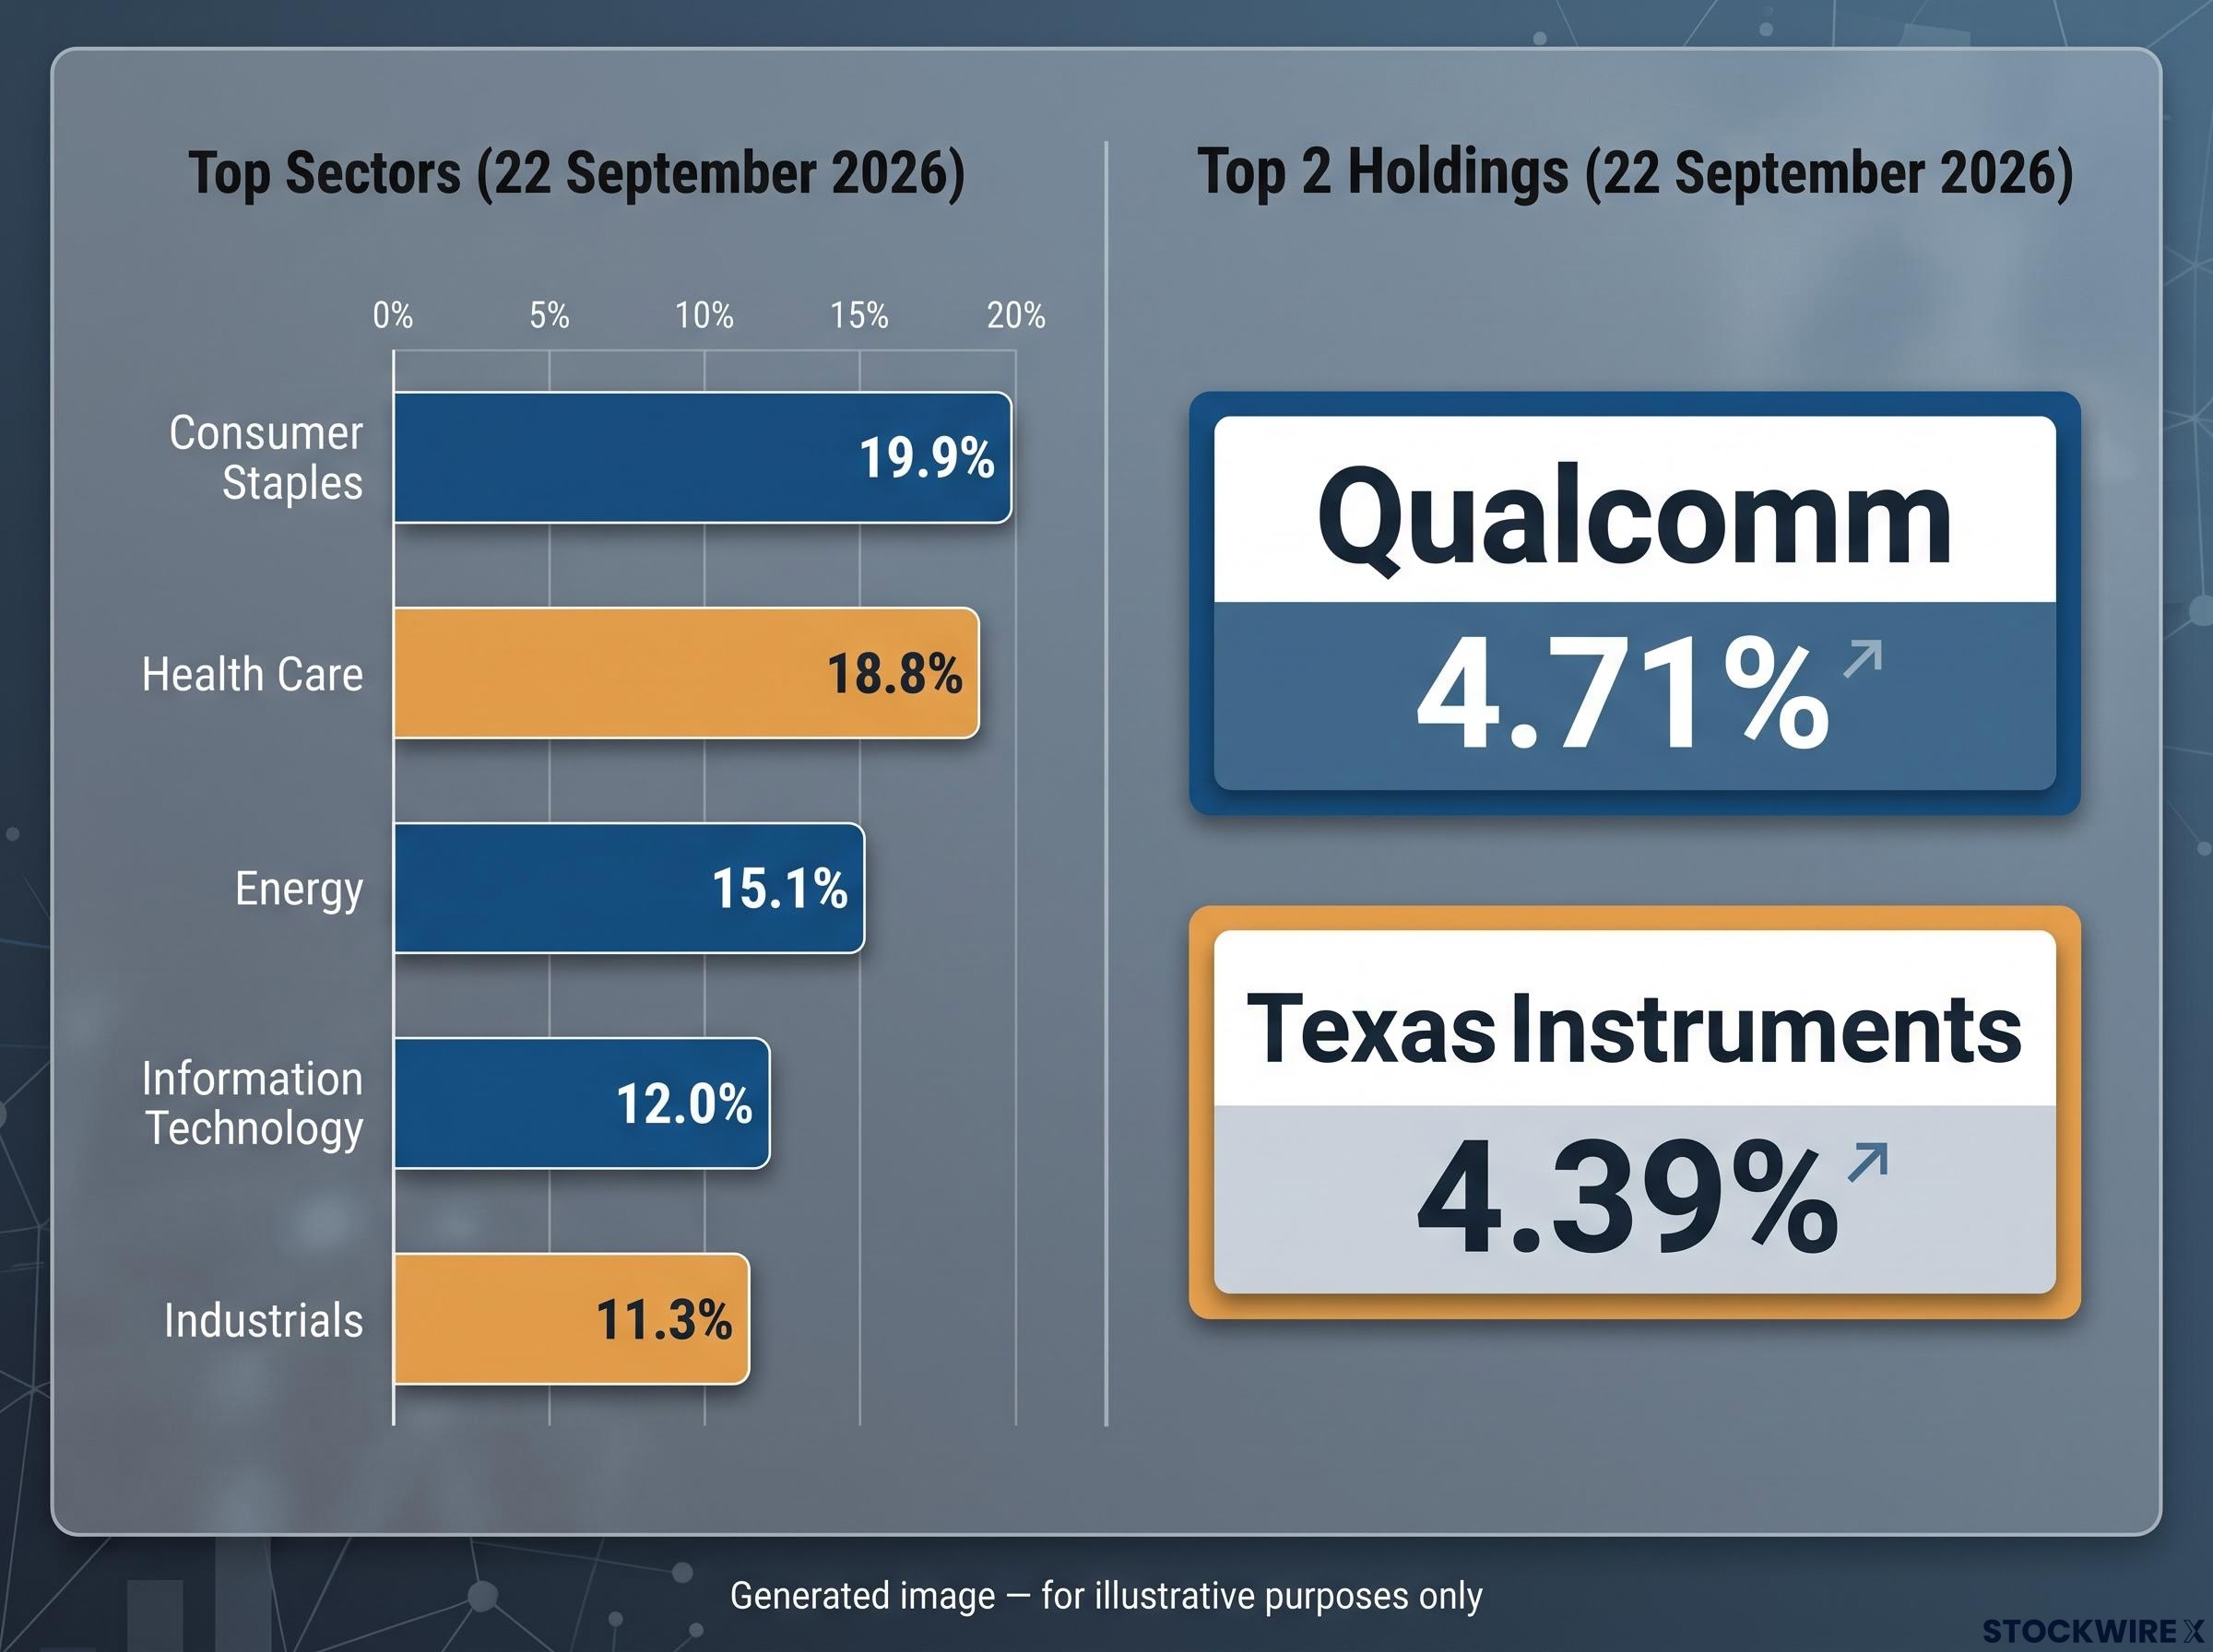
The authoritative current snapshot comes from Schwab and Robinhood as of 22 September 2026. Both show Qualcomm near 4.71-4.83% and Texas Instruments near 4.39-4.41%, comfortably inside the cap.
If the weights you are looking at seem lower than what some sites report, that is not an error. It is the 4.5% cap doing exactly what it was built to do.
Why Qualcomm and Texas Instruments score at the top of a dividend quality screen
“Blue-chip semiconductor” and “top dividend scorer” sound like they belong to different worlds. Look at the qualifying criteria, though, and the tension mostly dissolves.
Both Qualcomm and Texas Instruments have paid and grown dividends for well beyond the 10-year minimum, and both generate substantial free cash flow relative to their debt. Those are precisely the inputs the composite score rewards: dividend growth, ROE, and free cash flow to debt. High rankings are the natural output, not a glitch.
A dividend quality screen built around free cash flow payout ratios, ROE trends, and multi-year dividend growth records produces a very different shortlist than one sorted by headline yield alone, which is precisely why mature semiconductor businesses score alongside consumer staples names when the metrics, not the sector labels, do the ranking.
This is where the “conservative tech” framing that analysts use becomes useful. These are cash-generative, mature businesses with multi-decade payout records, not the unprofitable high-growth names that dominate the Nasdaq.
Established, cash-generative businesses with multi-decade dividend records are not the same as high-growth Nasdaq names, even though both carry the technology label. The composite screen cannot tell the difference between “tech” as a marketing category and “tech” as a fundamental risk profile. It only reads the numbers.
Here is the full picture of the top of the fund as of 22 September 2026:
| Rank | Company (Ticker) | Weight (%) |
|---|---|---|
| 1 | Qualcomm (QCOM) | 4.71% |
| 2 | Texas Instruments (TXN) | 4.39% |
| 3 | Procter & Gamble (PG) | 4.08% |
| 4 | Coca-Cola (KO) | 4.08% |
| 5 | Merck (MRK) | 4.07% |
| 6 | Chevron (CVX) | 3.97% |
| 7 | Verizon (VZ) | 3.92% |
| 8 | UnitedHealth Group (UNH) | 3.90% |
| 9 | Home Depot (HD) | 3.85% |
| 10 | Abbott Laboratories (ABT) | 3.84% |
At the sector level, the fund looks nothing like a tech fund. As of 22 September 2026:
- Consumer Staples: 19.9%
- Health Care: 18.8%
- Energy: 15.1%
- Information Technology: 12.0%
- Industrials: 11.3%
So the fund has not become a technology vehicle. Information Technology at 12% sits behind both Consumer Staples and Health Care. What has changed is the risk texture: with two cyclical semiconductor names as your single largest positions, the fund is now more sensitive to the chip industry’s boom-bust swings than the sector percentages alone would suggest. That is the nuance the headline numbers hide.
What the rules-based mechanism means for investors watching the next rebalance
Once you understand the mechanism, you can predict how it behaves, which is the whole point of a rules-based fund. The core dynamic is quietly contrarian.
Here is the three-step sequence that drives it:
- A stock’s price falls while its dividend stays intact.
- Its yield rises, because yield moves inversely to price.
- At the next weight reset, the higher yield pulls more weight toward that stock.
Rising prices work the opposite way: they compress yields and trigger trimming at the reset. The effect is a buy-low, sell-high discipline that no human has to decide on or feel nervous about. That is a genuine advantage, since most investors struggle to add to positions that have just fallen.
The mechanism has a blind spot, though. The rules cannot tell the difference between a stock that is temporarily cheap and one that is genuinely impaired, at least not until deteriorating fundamentals show up in the four composite metrics. The index can add weight to a falling stock whose problems the numbers have not yet caught.
Two dates are already on the calendar. The next quarterly weight reset lands in December 2026, and the next annual reconstitution in March 2027. December can shift weights within the current lineup; March can change the lineup itself.
Before those dates, here is what is worth checking on your top holdings:
- Dividend continuity: are Qualcomm, Texas Instruments, and the rest maintaining their payouts, since a cut removes a name from eligibility over time
- Sector cap proximity: how close Information Technology or any other sector sits to the 25% ceiling
- Guidance changes: any signals from QCOM or TXN that could weaken their composite scores at the next screen
With top-10 concentration hovering around 40-43%, a handful of positions drive most of the fund’s behaviour. Treating December and March as scheduled review prompts, rather than reacting after weights move, is what turns a passive holding into one you monitor with intent.
Top-ten concentration hovering near 40-43% is the kind of figure that looks manageable in percentage terms but produces outsized sensitivity to any single holding’s earnings revision or dividend cut, a dynamic that frequently surprises investors who assumed a 100-stock fund was broadly diversified.
SCHD is still a dividend fund. It just proved how far that label can stretch.
None of this is a malfunction. The semiconductor names at the top are the direct output of a quality-and-yield screen applied without sector preference, running on a schedule anyone can look up in advance.
That said, the gap between the fund’s conservative branding and its current cyclical leaders is real. Methodologically consistent and emotionally comfortable are not the same thing, and you are entitled to decide whether that gap changes how large a position you want to hold.
The safe-haven narrative that surrounds dividend-focused funds like SCHD was tested in early 2026, when the MSCI World High-Dividend Yield Index fell roughly 7.6% peak to trough and then lagged the broader market’s recovery, a result that reflects how sector concentration inside dividend indexes shapes drawdown behaviour independently of the dividend label.
The practical takeaway is simple. The label “dividend ETF” describes an eligibility filter, not a permanent sector guarantee. Information Technology sits at 12% of the portfolio while Consumer Staples and Health Care together account for roughly 38-40%, so the fund’s income character is intact even as its top two holdings surprise people.
The index methodology document, not the fund’s marketing language, is the accurate description of what SCHD will hold at any given time. It is publicly available, and it is the fund’s real identity.
The next chances for the lineup to shift are already set: the December 2026 quarterly reset and the March 2027 reconstitution. Investors who understand the mechanism are simply better positioned than those holding on the strength of a label.
This article is for informational purposes only and should not be considered financial advice. Investors should conduct their own research and consult with financial professionals before making investment decisions. Past performance does not guarantee future results, and financial projections are subject to market conditions and various risk factors.