
The moment a company’s earnings collapse is the exact moment valuation becomes both most important and most unreliable. Your standard tools start producing nonsense, and the investors who know what they are doing quietly build positions while everyone else waits for a clarity that never arrives on schedule.
Nike is that company right now. Shares have fallen roughly 50% since Hill took over in October 2024, earnings estimates have been cut repeatedly through 2025 and 2026, and a string of analysts have moved from Buy to Neutral to Underweight while pushing their recovery timelines further out each quarter.
The stock is not broken in any permanent sense. But the numbers that normally anchor a valuation, your trailing earnings, your recent margins, your current return on capital, are all distorted by a turnaround in progress.
This guide gives you a step-by-step framework for exactly that situation: how to normalise the numbers, build a discounted cash flow model that accounts for uncertainty, set a required rate of return that fits your personal circumstances, and stress-test across bear, base, and bull cases. Nike is the live example throughout, because a valuation framework is only as useful as the practitioner who has run it on a real, uncomfortable, unresolved situation.
Why standard valuation tools break down during a turnaround
Here is the trap most investors fall into. You open a spreadsheet, you plug in the company’s most recent earnings, you apply a reasonable growth rate, and you tell yourself you are being conservative. You are not. You are being systematically wrong.
When you anchor a discounted cash flow model, a method that estimates a stock’s value by projecting its future cash and discounting it back to today, to a depressed base year, every single year of your projection inherits that distortion. A bad starting number does not produce a cautious valuation. It produces a broken one.
NYU Stern’s DCF valuation framework for distressed firms identifies contaminated base-year inputs as the primary failure mode in traditional models, recommending explicit adjustments to both projected cash flows and discount rates when the company being valued is mid-repair rather than at a steady state.
Turnaround financials are contaminated in specific, predictable ways:
- One-off charges: restructuring costs and impairments that will not recur but drag down reported earnings today.
- Inventory liquidation write-downs: clearing old stock at a loss, which crushes gross margin temporarily.
- Margin compression: operating margins sit below their normal level because the business is mid-repair, not because that is its steady state.
- Non-recurring items: tax quirks, currency swings, or refunds that flatter or depress a single period.
Nike’s own numbers show how misleading the headline can be. For fiscal Q4 2026, Nike reported a gross margin of 49.2%, an 890 basis point jump year-on-year. That looks like operating progress. It was not. Roughly 900 basis points of that came from an anticipated tariff refund, not from the business getting healthier.
Nike’s Q4 gross margin figure is a precise illustration of why GAAP vs non-GAAP earnings diverge so sharply during a turnaround: the 900 basis points contributed by a tariff refund appears in the reported number but tells you nothing about operational trajectory.
The full-year picture tells the same story. FY2026 diluted earnings per share came in at $2.10, on revenue that was flat at $46.4 billion. Return on invested capital, a measure of how efficiently a company turns capital into profit, sat at roughly 12% against a five-year average of 17%. Free cash flow was about $2.2 billion for the year, against a five-year average nearer $4.3 billion.
Now here is why the base year matters so disproportionately.
In a typical 10-year DCF, 60% to 80% of the total valuation sits in the terminal value, the years beyond the explicit forecast. A contaminated base year does not corrupt one line of your model. It corrupts the entire structure that everything else compounds from.
If you anchor your Nike model to FY2026 as-reported numbers, you are not building in a margin of safety. You are building on a foundation you already know is distorted, and no amount of careful forecasting downstream will fix an input you got wrong at the start.
When big ASX news breaks, our subscribers know first
How to normalise earnings and free cash flow for a company in transition
Normalisation is the fix, and it is more craft than formula. The goal is not to assume the best case. It is to strip out the distortion of the worst year and estimate what the business earns in a normal one.
Start with the lookback period. Trailing twelve months data is exactly what you want to avoid in a turnaround, because it captures the trough. Instead, you average across a full cycle. Nike’s trailing 10-year and 5-year average profit margins are 9.6% and 9.5% respectively, remarkably stable despite the recent year being dragged lower by inventory clean-up.
Here is the four-step process you can apply to any transitioning business:
- Select the lookback period. Use five and ten years to capture a full cycle, not the trough.
- Calculate average margins. Work out the mean profit margin across that window.
- Apply it to a forward revenue estimate. Multiply your normalised margin by a reasonable revenue base.
- Cross-check against free cash flow history. Confirm your normalised earnings figure is consistent with what the business has actually generated in cash.
Watch what happens when you apply this to Nike. Take the 9.5% five-year average margin against the $46.4 billion revenue base, and you get implied normalised earnings closer to $4.4 billion, well above the reported $3.1 billion. That gap is the analytical edge. It separates the patient investor from the one who anchors to the wrong number and concludes the business is permanently smaller than it is.
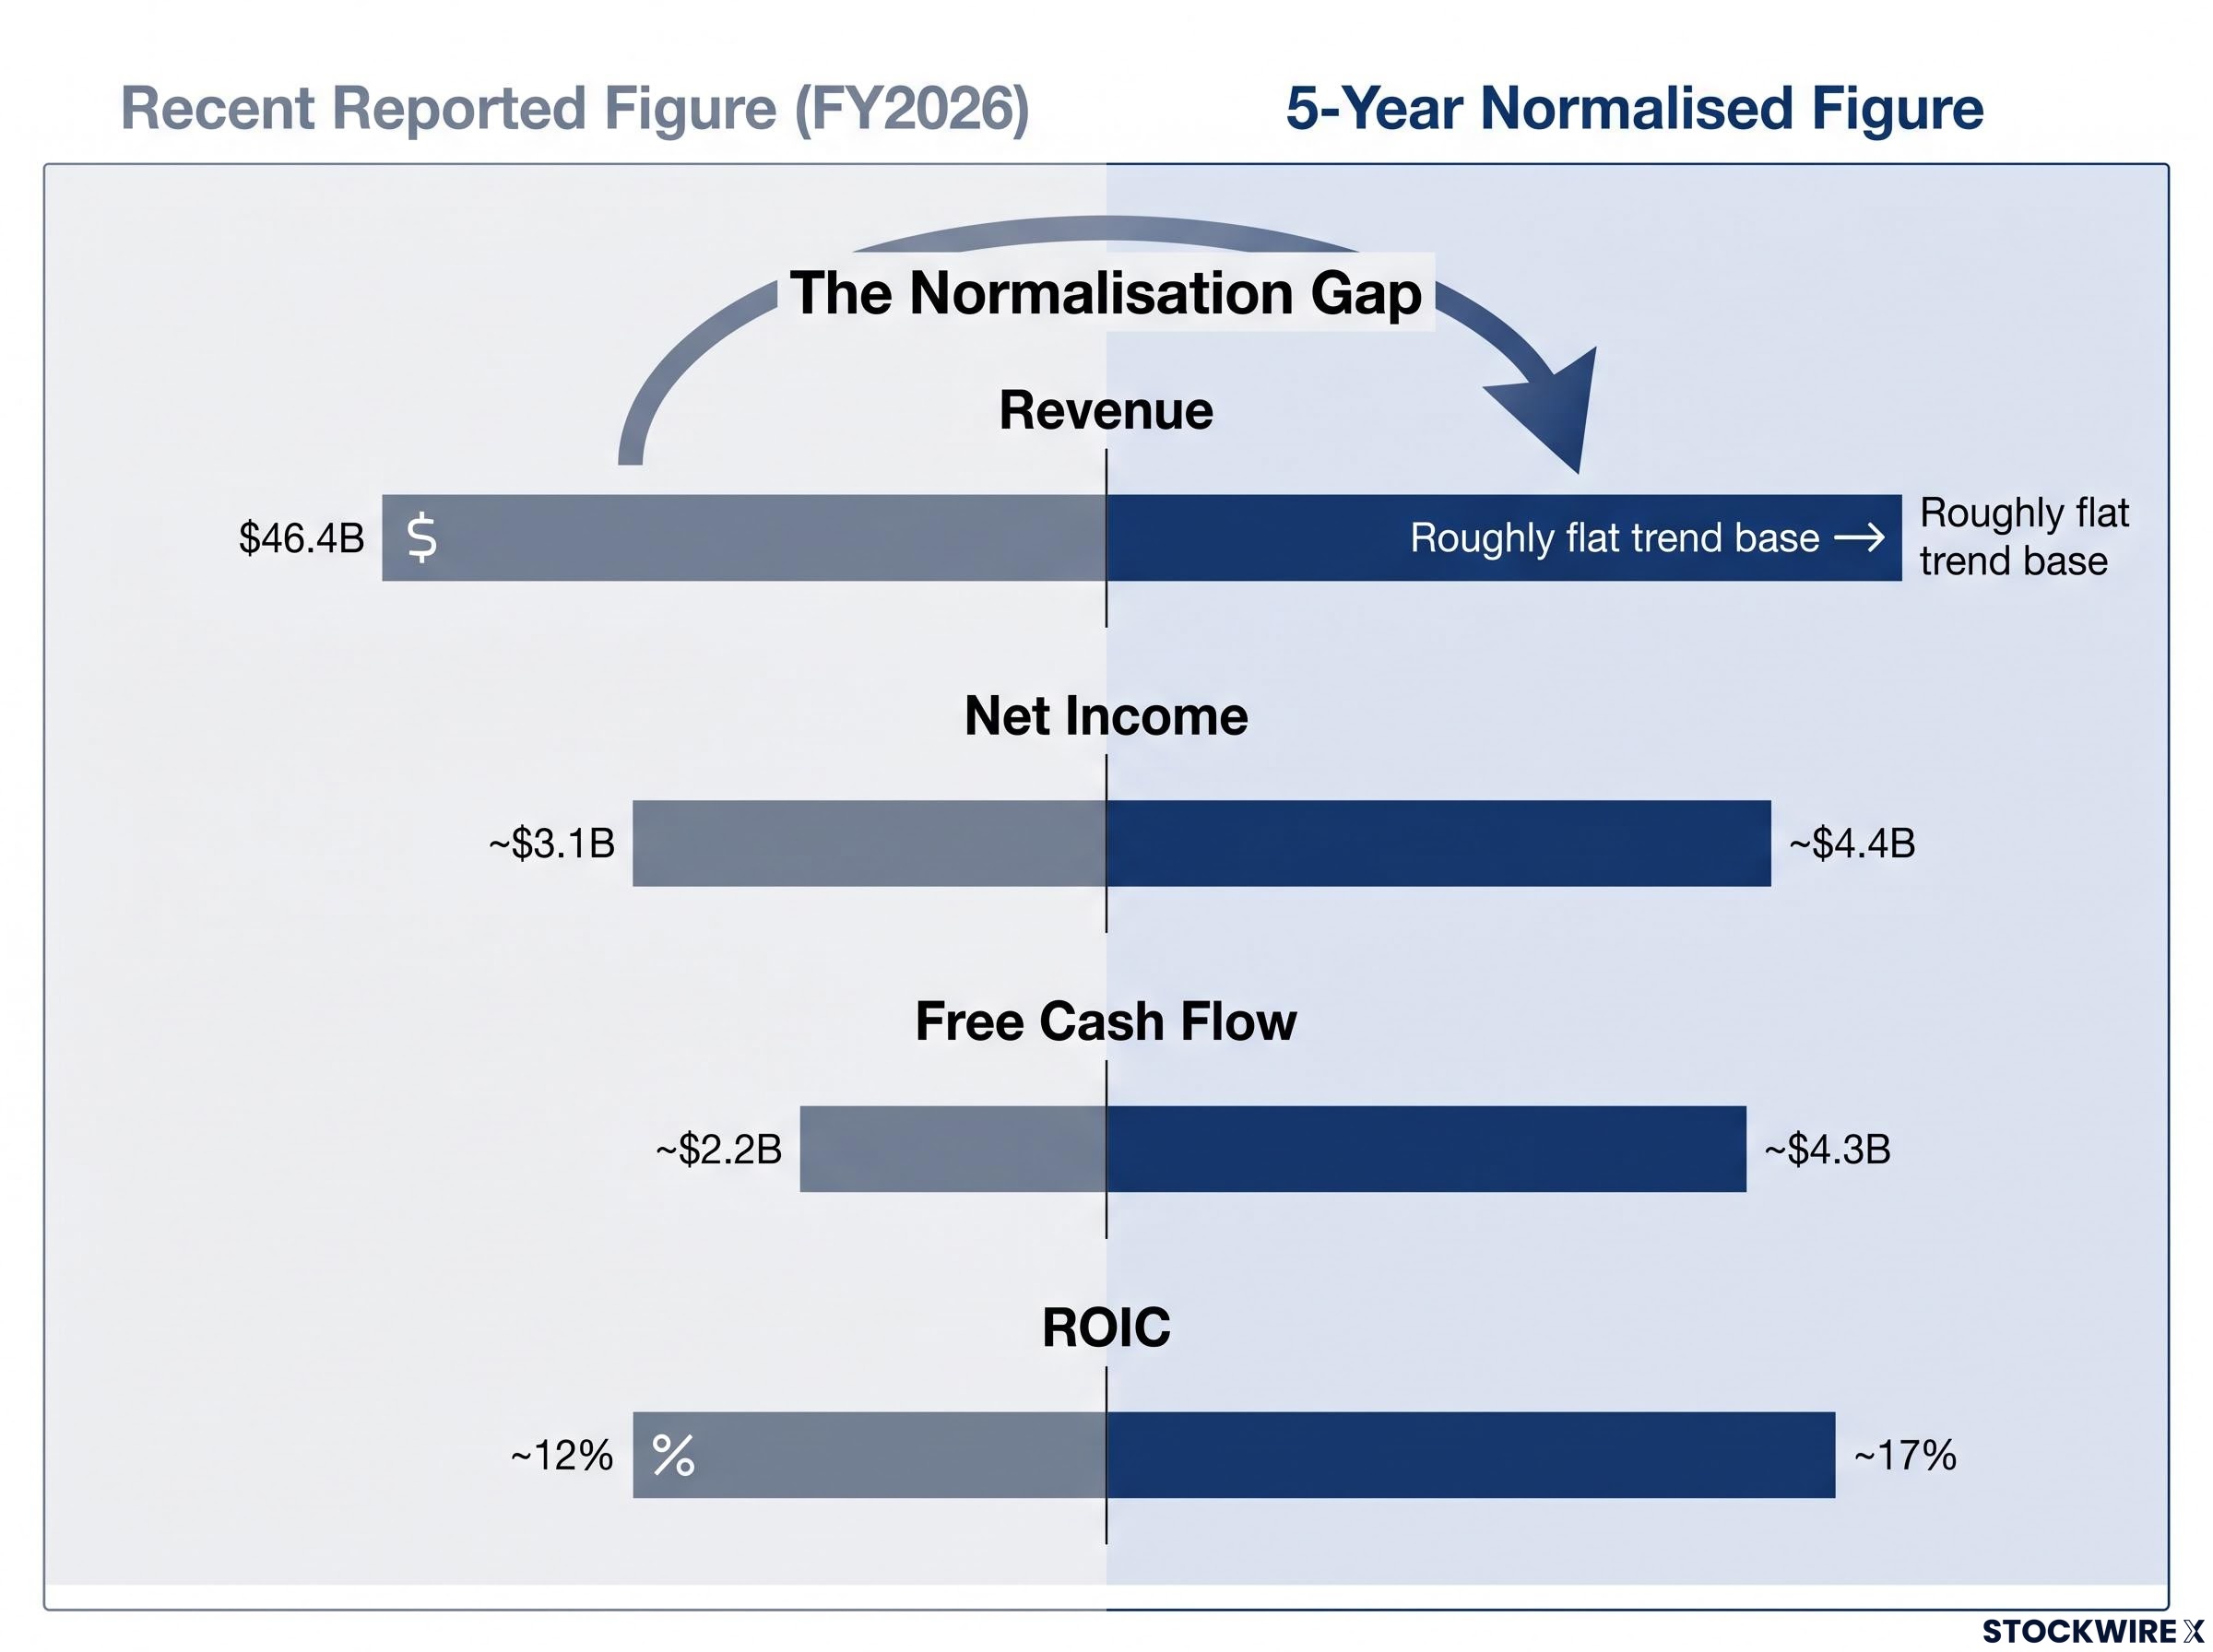
| Metric | Recent Reported Figure | 5-Year Normalised Figure |
|---|---|---|
| Revenue | $46.4B (FY2026) | Roughly flat trend base |
| Profit margin | Dragged lower by liquidation | 9.5% |
| Net income (implied) | ~$3.1B | ~$4.4B at normalised margin |
| Free cash flow | ~$2.2B | ~$4.3B |
| ROIC | ~12% | ~17% |
The revenue growth assumption needs the same treatment. Nike’s growth has averaged 3.7% annually over ten years, sat flat over five years, and turned negative over three. You do not extrapolate from the trough. You triangulate: weight the long-run average, acknowledge the recent softness, and land on a forward assumption that is defensible rather than hopeful.
That distinction is everything. Normalisation removes the distortion of the worst year. It does not assume the best one. If you cannot articulate that difference, you are not normalising; you are just being optimistic with extra steps.
Building the DCF: discount rates, scenario ranges, and what the model actually tells you
A turnaround DCF should never produce a single number. It should produce a spectrum, because the future genuinely is uncertain and a point estimate lies about that.
The terminal value drives 60-80% of a DCF result, which is why intrinsic value estimation demands more stress-testing of that single assumption than any other line in the model.
The way you build the spectrum is with three assumptions across three variables: revenue growth of 3%, 5%, and 7%; profit margins recovering to 9%, 10%, and 11%; and exit price-to-earnings multiples of 18x, 22x, and 26x. Run those through a conservatively modelled 10-year projection and you get a matrix of outcomes rather than a false precision.
For Nike, one such model produces two ranges depending on the return you demand. At a 9.5% required return, intrinsic value lands between roughly $46 and $100, with a midpoint near $68. At a stricter 15% required return, the range compresses to roughly $32 to $65, with a midpoint near $46.
| Scenario | Revenue Growth | Margin / Exit Multiple | Value at 9.5% | Value at 15% |
|---|---|---|---|---|
| Bear | 3% | 9% / 18x | ~$46 | ~$32 |
| Base | 5% | 10% / 22x | ~$68 | ~$46 |
| Bull | 7% | 11% / 26x | ~$100 | ~$65 |
As of 9 September 2026, Nike closed at $37.35. Place that against the matrix and something clear emerges. The stock sits below the low end of the midpoint range under the 9.5% assumption and near the very floor of the 15% scenario. The margin of safety is real. So is the uncertainty. Which of those wins depends almost entirely on one input.

Choosing your required rate of return: a personal, not technical, decision
The discount rate is where investors quietly go wrong, because they treat it as a technical output when it is really a personal one.
There are two defensible philosophies. The first is a market rate of 9% to 10%, aligned with the cost of equity for a large, diversified firm. Typical equity discount rates for businesses like this land in the 8% to 12% band. The second is a personal hurdle rate of 15% or more, reflecting your own opportunity cost, concentration risk, or the illiquidity of your broader wealth.
The consequences are not subtle.
According to McKinsey & Company, hiking a discount rate by just 3 to 5 percentage points above the true cost of capital can cut present value by 30% to 40%. This is not a technical footnote. It is the single most consequential input in the entire model.
Consider a real illustration. One Nike investor holds 75% of their net worth in real estate and a private business, so they apply a strict 15% hurdle rate to public equities to compensate for that concentration. They initiated at $70 to $75, dollar-cost averaged down as the stock fell, and used cash-secured puts to pull their effective cost basis into the mid-to-high $50s.
The point is not the specific trade. The point is that their required return flowed from their personal balance sheet, not from a formula. Your discount rate is downstream of your life, not upstream of the model.
Using cash-secured puts to manage your cost basis in a turnaround position
Educational note: This section is for informational purposes only and is not financial advice. Options carry real risk, and assignment can happen faster than you expect.
Once you have done the valuation work, a cash-secured put becomes a position management tool rather than a speculation. The distinction matters, because the same trade means completely different things depending on whether a model sits behind it.
The mechanics are straightforward. You sell a put option, which obligates you to buy 100 shares at a set strike price if the buyer chooses to exercise. You collect a premium upfront. If the stock stays above the strike, you keep the premium. If it falls below and you are assigned, you buy the shares, and your effective cost basis is the strike price minus the premium you received.
Tie the strike price to your valuation, not to a feeling:
- Establish your bear-case intrinsic value from the scenario matrix.
- Select a strike at or below that level, so assignment only happens at a price your thesis already supports.
- Size the position so that a 20% further decline in the stock does not push your holding beyond its intended allocation.
- Collect the premium and manage through to expiry or assignment.
The risks are genuine, and minimising them would be a disservice:
- Downside participation: once assigned, your risk is identical to owning the stock outright. It can keep falling, and the premium offers only a small cushion.
- Gap-down risk: an earnings miss or macro shock can drop the stock well below your strike overnight, before you can react.
- Opportunity cost: the cash collateral is tied up and cannot work elsewhere while the put is open.
What makes the Nike hold case more durable while you wait is the income. The dividend yield sits at roughly 4.2% at current levels, paying you to be patient. And the underlying thesis has a number attached: analysts project earnings recovering from around $1.50 currently to approximately $4.00 over a four-year horizon.
Selling a put at a strike anchored to your bear-case intrinsic value is a fundamentally different act than selling one because the stock has simply fallen a lot. Be honest with yourself about which one you are doing before you place the trade.
For investors wanting to work through the mechanics in more depth before placing a trade, our dedicated guide to cash-secured puts covers strike selection, premium yield calculations, and early assignment risk with worked examples from live market conditions.
The hardest part of turnaround valuation: knowing which risks are priced in and which are not
Here is the question that actually determines whether Nike is a bargain or a trap, and it is not one a spreadsheet can answer for you. Which of the company’s problems are cyclical, and which are structural?
The distinction is not academic. Cyclical risks pass, and normalisation already accounts for them. Structural risks change the normal itself, which means they lower the very margin assumption you are building your model on.
- Cyclical risks: temporarily depressed margins from inventory clean-up, China stock rationalisation, and broad macro softness.
- Structural risks: brand erosion in the West from competitors like On Running and Hoka, the “China Chic” consumer shift toward local brands, and multi-quarter distribution disruption as Nike reshapes its China marketplace.
China is where the two blur uncomfortably. Nike’s revenue there is down roughly 30% since 2021, at eight-year lows. Greater China sales dropped 17% on a constant-currency basis in Q4 FY2026, and management expects a further decline of around 20% in the quarter after Q3. Is that a cycle bottoming, or a permanent share loss? Your answer changes the model.
The implied growth rate embedded in Nike’s current price is a more precise diagnostic than any analyst target: it converts the $37.35 share price into a mathematical statement about the minimum revenue trajectory the market is demanding for investors to earn their required return.
On liquidity, the picture is manageable but worth stating. Net debt sits at approximately $15 billion against an enterprise value of roughly $70 billion at March 2026 pricing, or about 3.5 times the five-year average free cash flow. That is not distress, but it is not a fortress either.
The way you embed structural risk is precise: your bear case is not merely a slower recovery. It is a permanently lower normalised margin. State explicitly what margin you are assuming and why, because that single number carries your entire view of whether the brand’s earning power is intact.
Reading analyst downgrades without being anchored by them
When JPMorgan cuts Nike to Underweight and Bank of America moves to Neutral, that feels like new information. It usually is not.
Analyst price targets are a lagging indicator in a turnaround. They reflect recently reported numbers and near-term guidance, not a fresh reassessment of 10-year normalised cash flows. Across 2026, targets from major banks compressed from a $70 to $110 range down into a $40 to $55 cluster, tracking the cuts to near-term earnings guidance almost mechanically.
Notice what did not move nearly as much. The long-horizon recovery estimate, earnings reaching roughly $4.00 over four years, stayed relatively stable even as the targets fell. That gap tells you the downgrades were about sentiment and timing, not about a downward revision of the brand’s decade-out earning power.
Use analyst targets to understand where consensus sits and what the sentiment risk is. Do not use them to anchor your own intrinsic value. Those are two different jobs, and confusing them is how you end up buying high and selling low on the same thesis.
What a disciplined turnaround valuation process looks like end to end
Everything above collapses into a repeatable sequence you can run on the next turnaround you encounter:
- Normalise the inputs. Use multi-year averages, not the trough, to estimate real earning power.
- Build the scenario matrix. Three growth, margin, and exit-multiple assumptions produce a range, not a point.
- Set your discount rate from your personal opportunity cost, not a textbook default.
- Separate cyclical from structural risk, and embed the structural view in your bear-case margin.
- Read analyst sentiment for positioning, not for your intrinsic value.
- Decide position sizing and entry mechanics, including whether options fit your plan.
The DCF does not hand you a buy or sell signal. It gives you a structured way to understand what you would have to believe about the future for the current price to make sense.
Return to Nike one last time. At $37.35 on 9 September 2026, the stock sits at or below the floor of the DCF range under the 15% hurdle rate, and below the midpoint under the 9.5% assumption. The 4.2% dividend yield and $4.3 billion five-year average free cash flow make the hold case durable while you wait. The path to roughly $4.00 in earnings over four years is the bull case the market is not yet pricing.
Run this framework and you will not walk away knowing whether to buy Nike. You will walk away knowing exactly what you believe, and exactly what you would need to be wrong about for the investment to fail. That is a far more useful thing to hold than a price target.
This article is for informational purposes only and should not be considered financial advice. Investors should conduct their own research and consult with financial professionals before making investment decisions. Past performance does not guarantee future results, and financial projections are subject to market conditions and various risk factors.