How ASIC Cancels an AFS Licence and What Happens to Clients
1 hr ago

An algorithm selects up to 20 stocks each month, refreshes the list on the first trading day, and repeats. Since November 2023, according to InvestingPro’s internal performance reporting, that process has compounded to an approximately 217% cumulative return, outpacing the S&P 500 by roughly 143 percentage points. The gap between those two numbers is large enough to warrant a mechanical explanation rather than a headline. What follows is a complete breakdown of how the ProPicks AI strategy works: what the system analyses, how it builds and maintains portfolios, what the performance record actually shows (and what it cannot prove), and what separates this approach from traditional active management and static screening tools.
The most common misunderstanding is the simplest one. A conventional stock screener applies fixed filters, such as “P/E below 15” or “dividend yield above 3%,” and returns every company that clears those thresholds. ProPicks AI does something structurally different. It ranks and selects stocks based on learned patterns across multiple dimensions of financial data simultaneously, identifying the companies exhibiting the strongest combined signal across price momentum, valuation, and fundamental quality.
The distinction between a rules-based screener and a machine-learning model matters precisely because AI trading system risks are structurally different: a fixed-rule screener fails visibly when its criteria stop working, while a machine-learning model can degrade silently as the market regimes it was trained on become less predictive.
The system powers several predefined strategies, each producing a focused basket of up to 20 high-conviction stocks. These strategies target distinct styles and market segments:
Each strategy launched in November 2023 and has refreshed monthly since. The distinction matters because it changes how a reader should interpret the output. These are not lists of companies that passed a binary filter. They are ranked, model-selected positions where the AI determined the strongest probability of medium-term appreciation across a multi-factor signal.
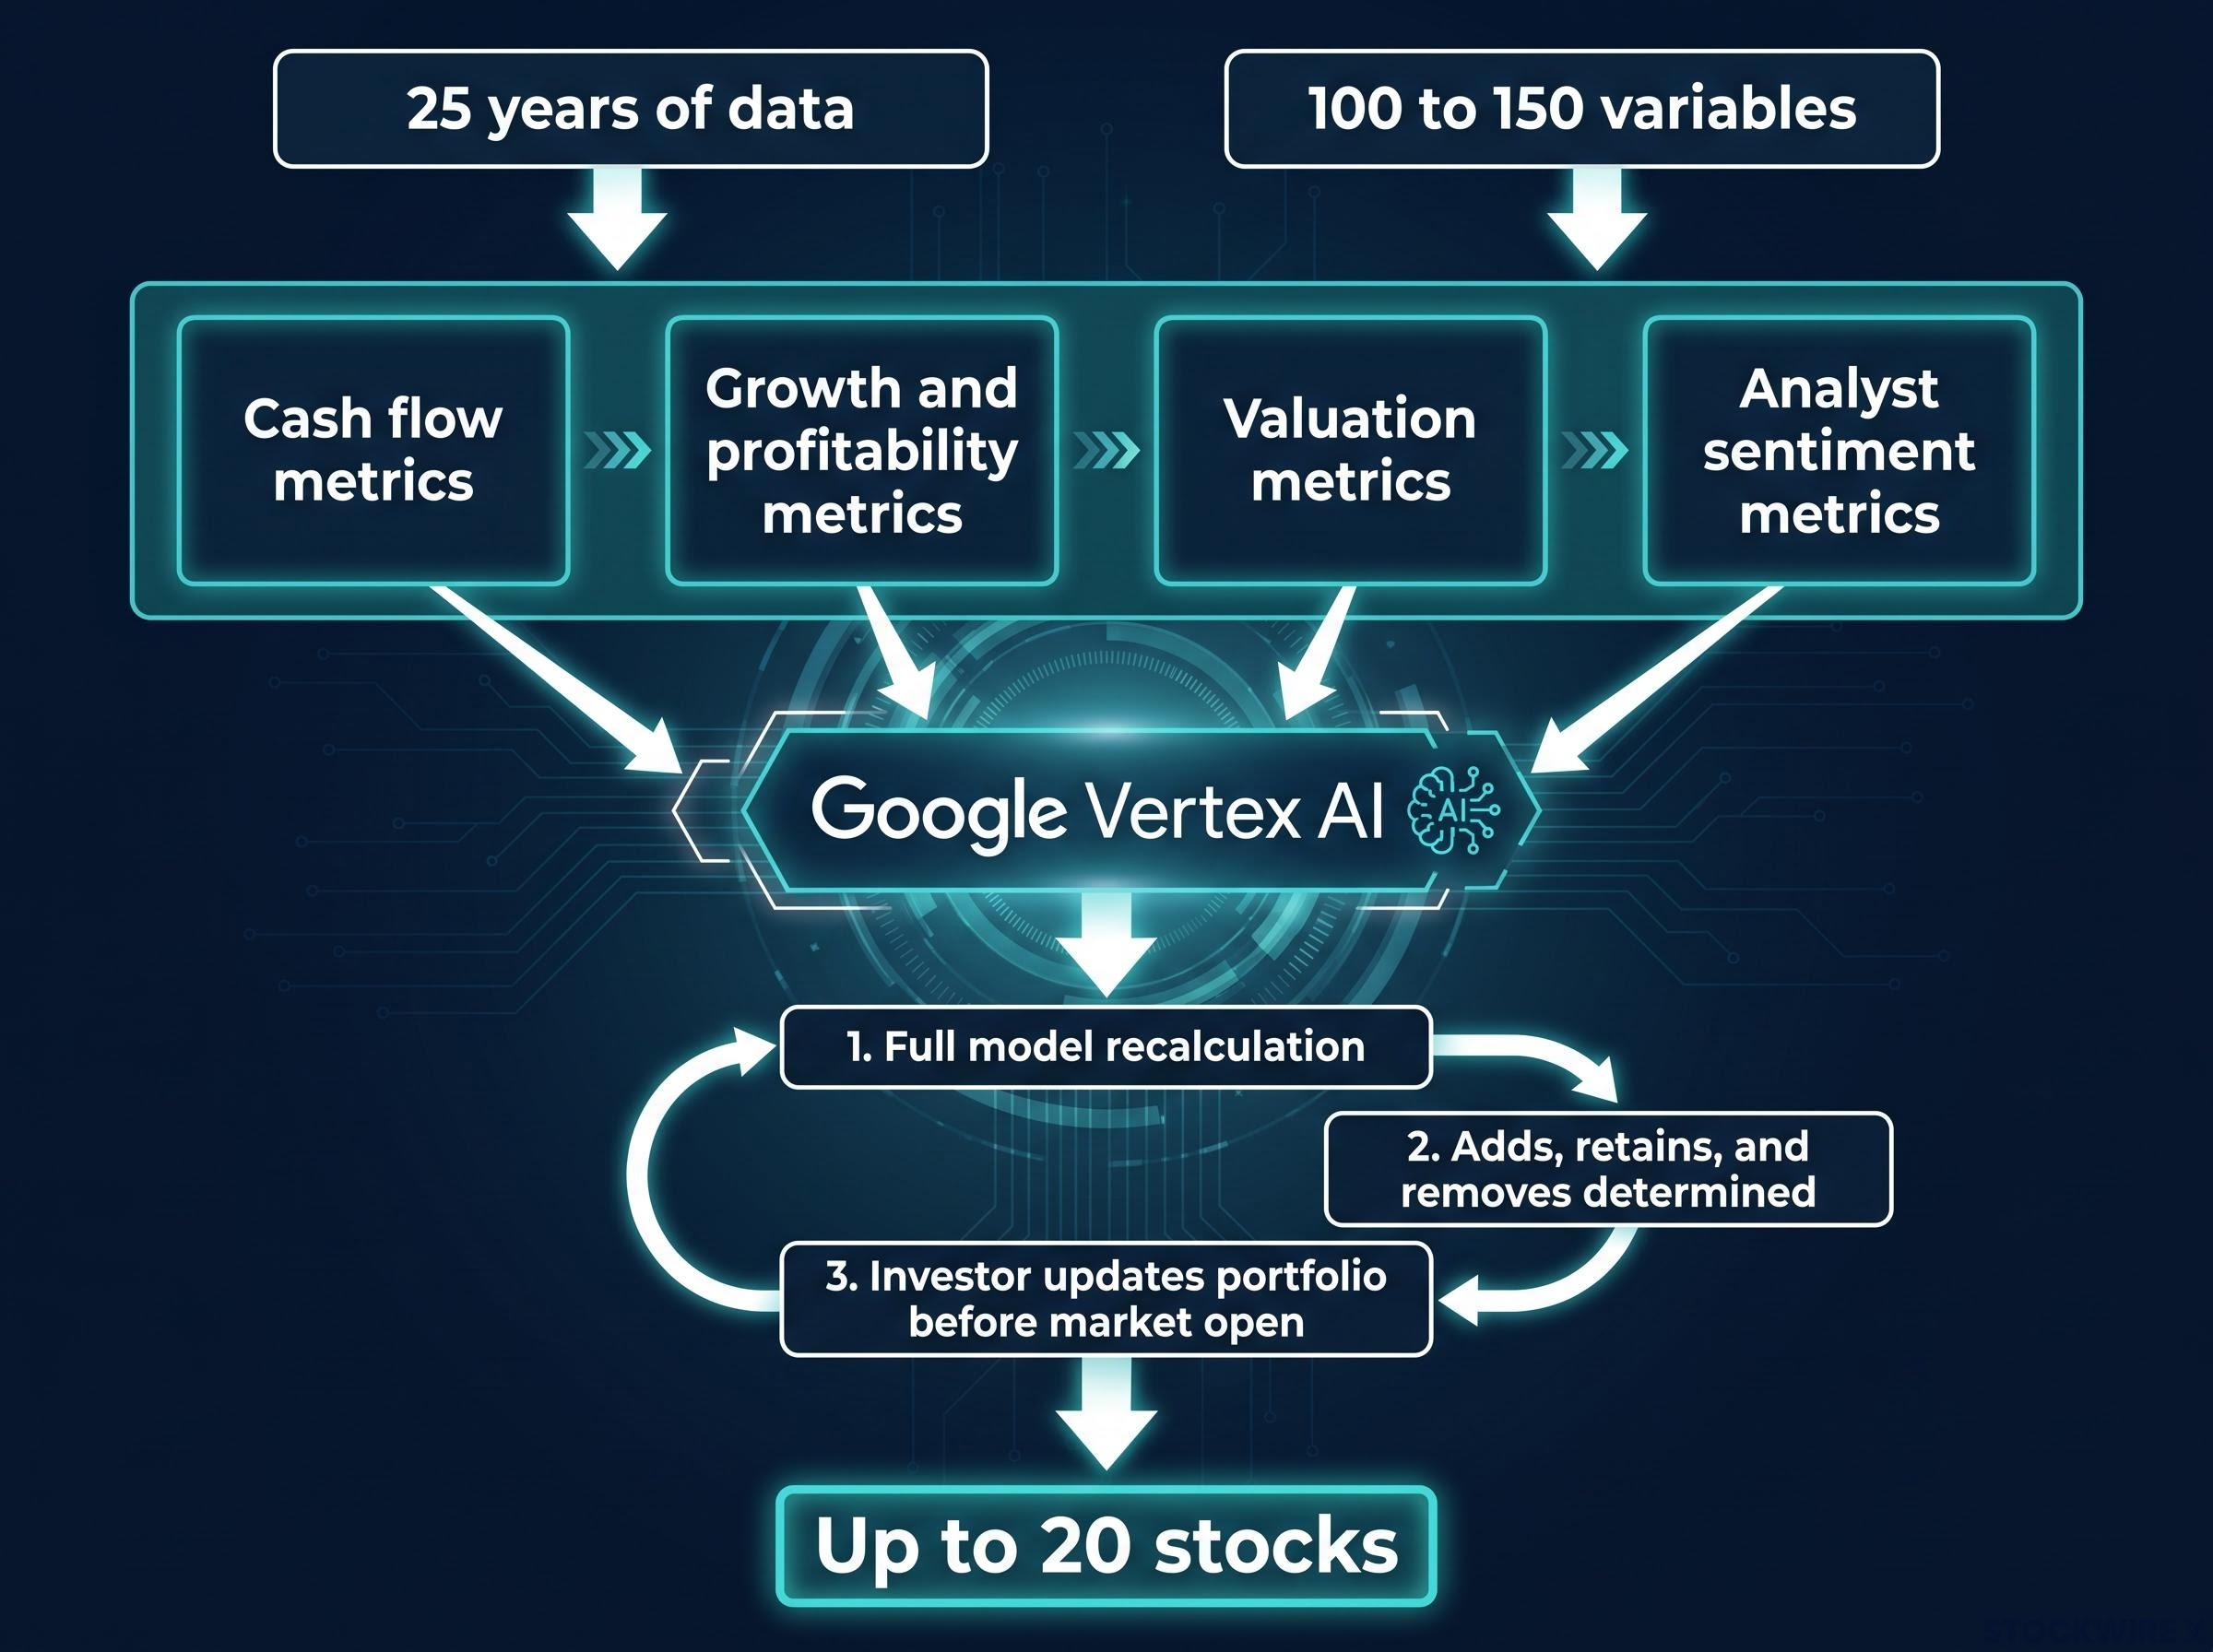
The raw material the model consumes is where the “institutional-grade” label earns its meaning. According to InvestingPro’s published descriptions, ProPicks AI is trained on over 25 years of financial history across thousands of companies. (Some platform-facing descriptions reference 15-plus years; the broader figure appears in InvestingPro’s own documentation and video walkthroughs.)
Each company in the eligible universe is evaluated against more than 100 to 150 financial and market-based variables, grouped into four broad categories:
The model does not apply fixed weightings to these variables. It learns which combinations of metrics have historically predicted outperformance and re-weights them dynamically as market conditions shift. The system tests its models against control groups on a recurring basis, continually adapting to current conditions rather than relying on a static formula locked in at launch.
Factor investing portfolio construction applies many of the same normalisation and ranking mechanics that underpin systematic AI models, including z-score standardisation across metrics, sector caps to prevent unintended concentration, and drift-based rebalancing triggers that respond to allocation deviation rather than calendar dates.
The analysis runs across thousands of companies simultaneously using over 100 financial and market variables, a task impractical to replicate with human analyst teams. Scale is the structural edge systematic approaches hold over discretionary stock picking.
In some implementations, the methodology relies on Google Vertex AI infrastructure, with data sourced from institutional-grade vendors.
On the first trading day of each month, the model re-runs in full. The sequence works as a three-step cycle:
Subscribers who begin tracking a strategy partway through a month are instructed to purchase only that month’s designated add stocks, then follow subsequent monthly add/remove instructions going forward.
The portfolio construction method is equal weighting. Investors divide total capital by the number of stocks in the strategy and invest an identical dollar amount in each position, regardless of market capitalisation or analyst conviction score. All performance figures published by InvestingPro assume exact equal allocation and monthly rebalancing.
| Dimension | What equal weighting does | What cap weighting would do differently |
|---|---|---|
| Size bias | Eliminates size bias; a $5B company carries the same weight as a $500B company | Larger companies dominate the portfolio, skewing returns toward mega-caps |
| Position importance | Every pick carries equal importance in assessing the model’s outputs | A single large-cap position can drive or drag the portfolio’s overall return |
| Diversification breadth | Provides more diversified exposure across all recommendations | Concentration risk increases as the largest holdings absorb most of the capital |
This methodology detail is not academic. The reported performance figures are only reproducible if an investor follows the equal-weighting and rebalancing rules exactly. Deviating from either will cause real portfolio results to diverge from the strategy’s stated returns.
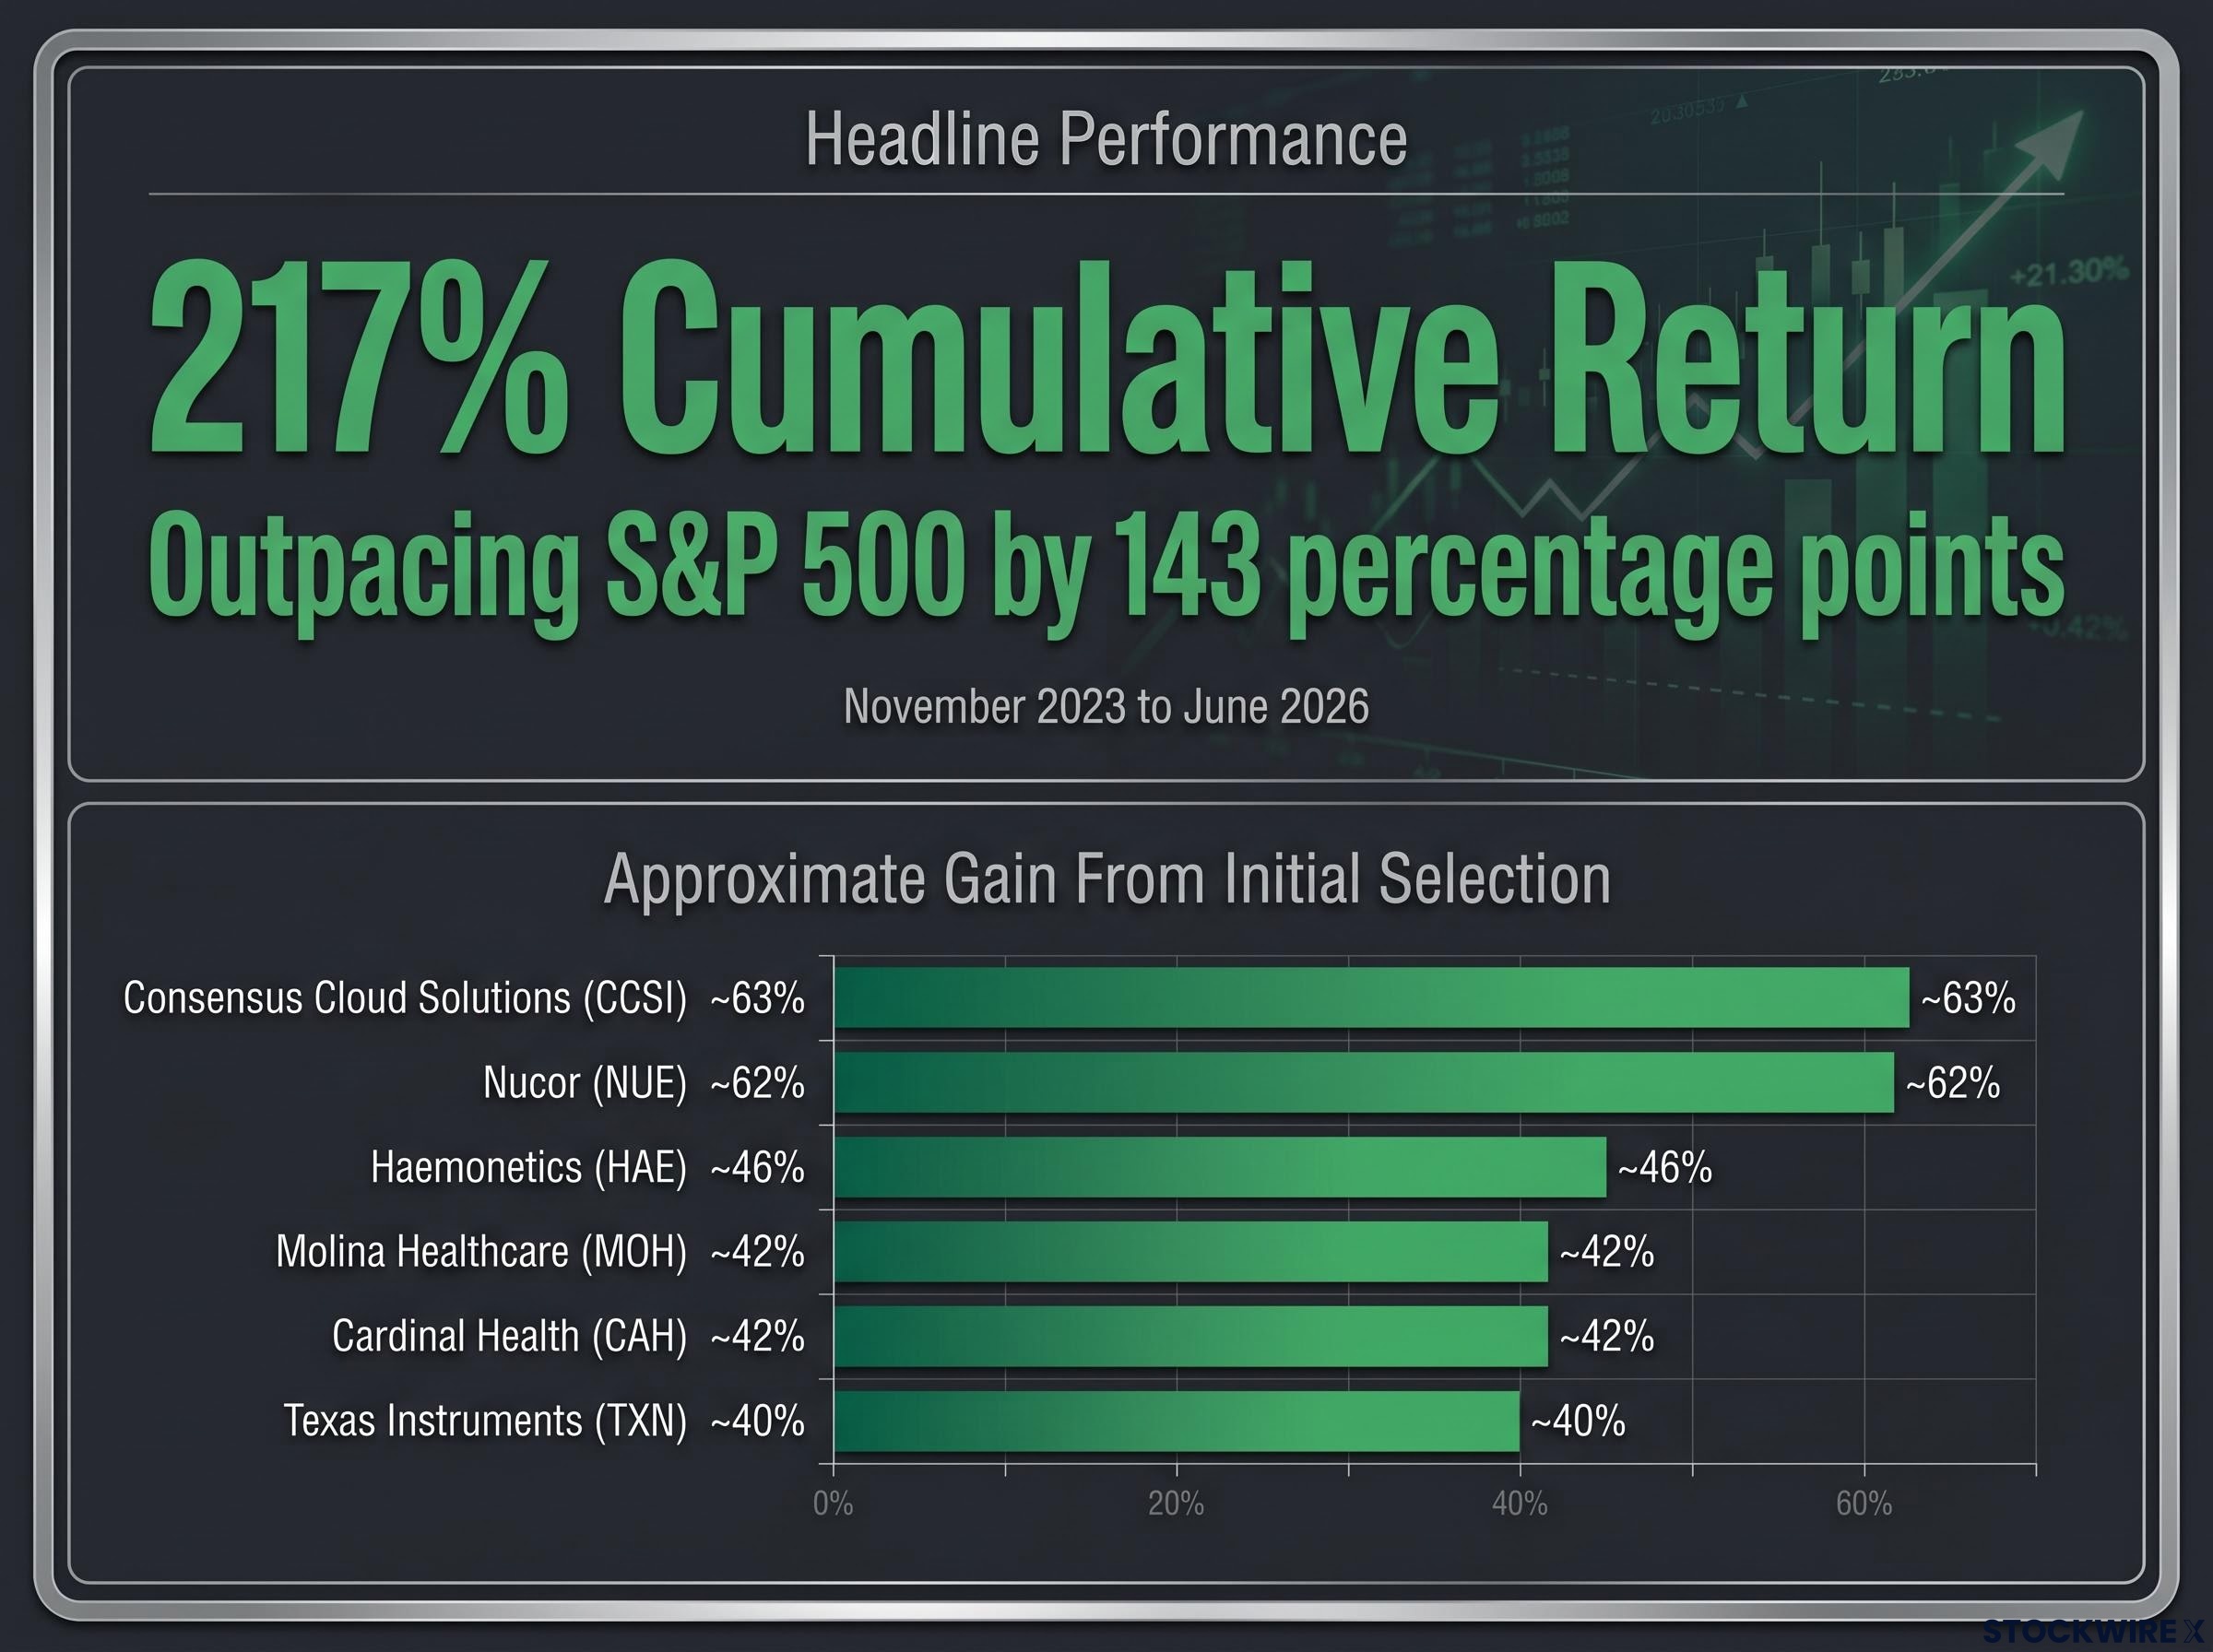
The headline figure carries genuine weight. According to InvestingPro’s internal performance reporting, ProPicks AI has delivered an approximately 217% cumulative return from its November 2023 launch through approximately 12 June 2026, outpacing the S&P 500 by roughly 143 percentage points over the same period.
“According to InvestingPro’s internal performance reporting, ProPicks AI has delivered approximately 217% cumulative since November 2023, outpacing the S&P 500 by roughly 143 percentage points.”
Individual stock selections provide concrete anchors for how the strategy has generated those returns. The following figures are measured from each stock’s respective initial selection date, as reported on the InvestingPro platform:
| Stock | Ticker | Approximate gain from initial selection |
|---|---|---|
| Consensus Cloud Solutions | CCSI | ~63% |
| Nucor | NUE | ~62% |
| Haemonetics | HAE | ~46% |
| Molina Healthcare | MOH | ~42% |
| Cardinal Health | CAH | ~42% |
| Texas Instruments | TXN | ~40% |
These are platform-reported figures from an internal dashboard, not independently audited returns. The distinction matters. Independent auditing would involve a third party verifying trade execution, timing, and allocation methodology against stated rules.
Real-world investors implementing the strategy face several execution frictions that reduce returns relative to the reported figures. Slippage (the difference between the intended execution price and the actual fill) compounds across monthly rebalances. Commissions and bid-ask spreads reduce net gains on each trade. In taxable U.S. accounts, monthly portfolio turnover generates short-term capital gains taxed at ordinary income rates, a cost that does not appear in the strategy’s reported performance.
The outperformance gap of 143 percentage points is large enough to be analytically significant. But readers should understand the difference between a strategy’s reported returns and what a real investor would have captured after execution friction and tax consequences.
The active versus passive performance evidence accumulated over two decades in SPIVA data tells a consistent story: 93.6% of large-cap US equity funds underperformed their benchmark over a 15-year horizon, which contextualises why the S&P 500 is a meaningful benchmark against which to measure any systematic outperformance claim.
The comparison is most useful when framed around three specific failure modes of conventional approaches, each of which the systematic model is designed to avoid.
Structural active fund underperformance in 2026 reached a two-decade extreme partly because regulatory position caps make it legally impossible for most funds to match benchmark weights when a single S&P 500 name exceeds 6-7% of index weight, creating a gap that systematic strategies unconstrained by those rules are better positioned to exploit.
Factor adaptability is the first. A static screen filtering for “P/E below 15” does not adapt when that metric loses predictive power in a given market regime. Growth-dominated markets, for instance, can render low-P/E screens persistently underperforming for years. ProPicks AI continuously re-evaluates which combinations of metrics are currently predictive based on historical outcomes, re-weighting dynamically rather than waiting for a human analyst to change the screening criteria.
Behavioural neutrality is the second. Human portfolio managers are subject to well-documented biases:
The AI model removes these inputs mechanically. Underperformers are dropped at each monthly rebalance without emotional attachment influencing the decision.
Analysis scale is the third. Running every financial model across thousands of companies simultaneously each month is impractical for human analyst teams. Coverage capacity constraints mean discretionary managers discover opportunities opportunistically. The systematic model ensures no qualifying company is overlooked due to bandwidth limitations.
| Dimension | Traditional active management | ProPicks AI |
|---|---|---|
| Factor adaptability | Fixed screens or analyst-driven factor selection; updated manually | Dynamic re-weighting based on which metric combinations are currently predictive |
| Behavioural discipline | Subject to anchoring, loss aversion, conviction overrides, and strategy drift | Mechanically removes underperformers; no emotional input in the rebalancing process |
| Analysis scale | Limited by analyst team capacity; coverage gaps are structural | Processes thousands of companies simultaneously using 100-plus variables each month |
The performance record documented above was generated in specific market conditions. The risks that accompany any systematic strategy deserve equal attention.
The IRS Topic 409 guidance on capital gains defines short-term gains as profits from assets held one year or less, taxed at ordinary income rates, which means a monthly-rebalancing strategy can generate a materially higher tax liability in a taxable brokerage account than a buy-and-hold approach producing the same gross return.
“Past performance does not guarantee future results. Investors should conduct independent due diligence before acting on any strategy outputs.”
Understanding the gap between a strategy’s reported return and an investor’s realised return is the difference between informed and uninformed participation. This is particularly relevant for U.S. retail investors making real allocation decisions in taxable brokerage accounts.
Approximately 30 months of live market exposure, from November 2023 through June 2026, is meaningful evidence. It is not proof. The period has included varied market conditions, but 30 months remains a short window for evaluating a systematic strategy against multiple full market regimes, including a sustained bear market or a prolonged period of factor reversal.
What the record does demonstrate is that a systematic, behaviourally neutral, institutionally scaled approach to stock selection can produce documented outperformance over a meaningful period while eliminating several documented failure modes of traditional active management. It also introduces its own specific risks: model degradation in novel regimes, execution friction, tax drag from monthly turnover, and tracking error from imperfect implementation.
For a U.S. retail investor, understanding the mechanics, the attribution methodology, and the execution requirements is the prerequisite for using the strategy as intended. The 217% cumulative return and the 143-percentage-point gap over the S&P 500 are the orienting facts. The mechanical picture surrounding those facts, from data inputs to rebalancing rules to risk categories, is what separates informed engagement from passive acceptance of a headline number.
This article is for informational purposes only and should not be considered financial advice. Investors should conduct their own research and consult with financial professionals before making investment decisions. Past performance does not guarantee future results. Financial projections and reported performance figures are subject to market conditions and various risk factors.
ProPicks AI is a machine-learning stock selection system from InvestingPro that evaluates over 100 financial and market variables across thousands of companies, then selects up to 20 high-conviction stocks per strategy each month, rebalancing on the first trading day of every month.
According to InvestingPro's internal performance reporting, ProPicks AI has delivered approximately 217% cumulative return from its November 2023 launch through approximately June 2026, outpacing the S&P 500 by roughly 143 percentage points over the same period.
The model evaluates more than 100 to 150 variables grouped into four categories: cash flow metrics, growth and profitability metrics, valuation metrics, and analyst sentiment metrics, drawing on over 25 years of financial history.
Key risks include model degradation if future market conditions differ from the training data, execution friction from slippage and commissions, short-term capital gains tax in taxable accounts due to monthly turnover, and tracking error if investors deviate from exact equal weighting or rebalancing rules.
Equal weighting ensures every selected stock carries the same portfolio importance regardless of company size, eliminates size bias, and provides more diversified exposure across all recommendations, which is also a requirement for replicating the strategy's reported performance figures.