When Micron reports fourth-quarter results on 30 September 2026, the options market has already made a prediction that no price chart on your screen will show you. It is pricing in a specific dollar move, a specific range of outcomes, and a specific level of fear, all in numbers you can read if you know where to look.
That matters right now because semiconductor stocks are among the most volatile names on the market during this AI memory boom, and Micron sits at the centre of it. A single earnings release can gap the stock by a hundred dollars overnight, and the way options are priced tells you how the market is bracing for it.
Here is the framework for reading those signals. You will learn how to interpret the implied move, why premiums collapse the moment results land, what the pricing of calls versus puts reveals about crowd sentiment, and how platform probability figures can quietly mislead you into managing your positions badly.
Sizing up the September 30 implied move
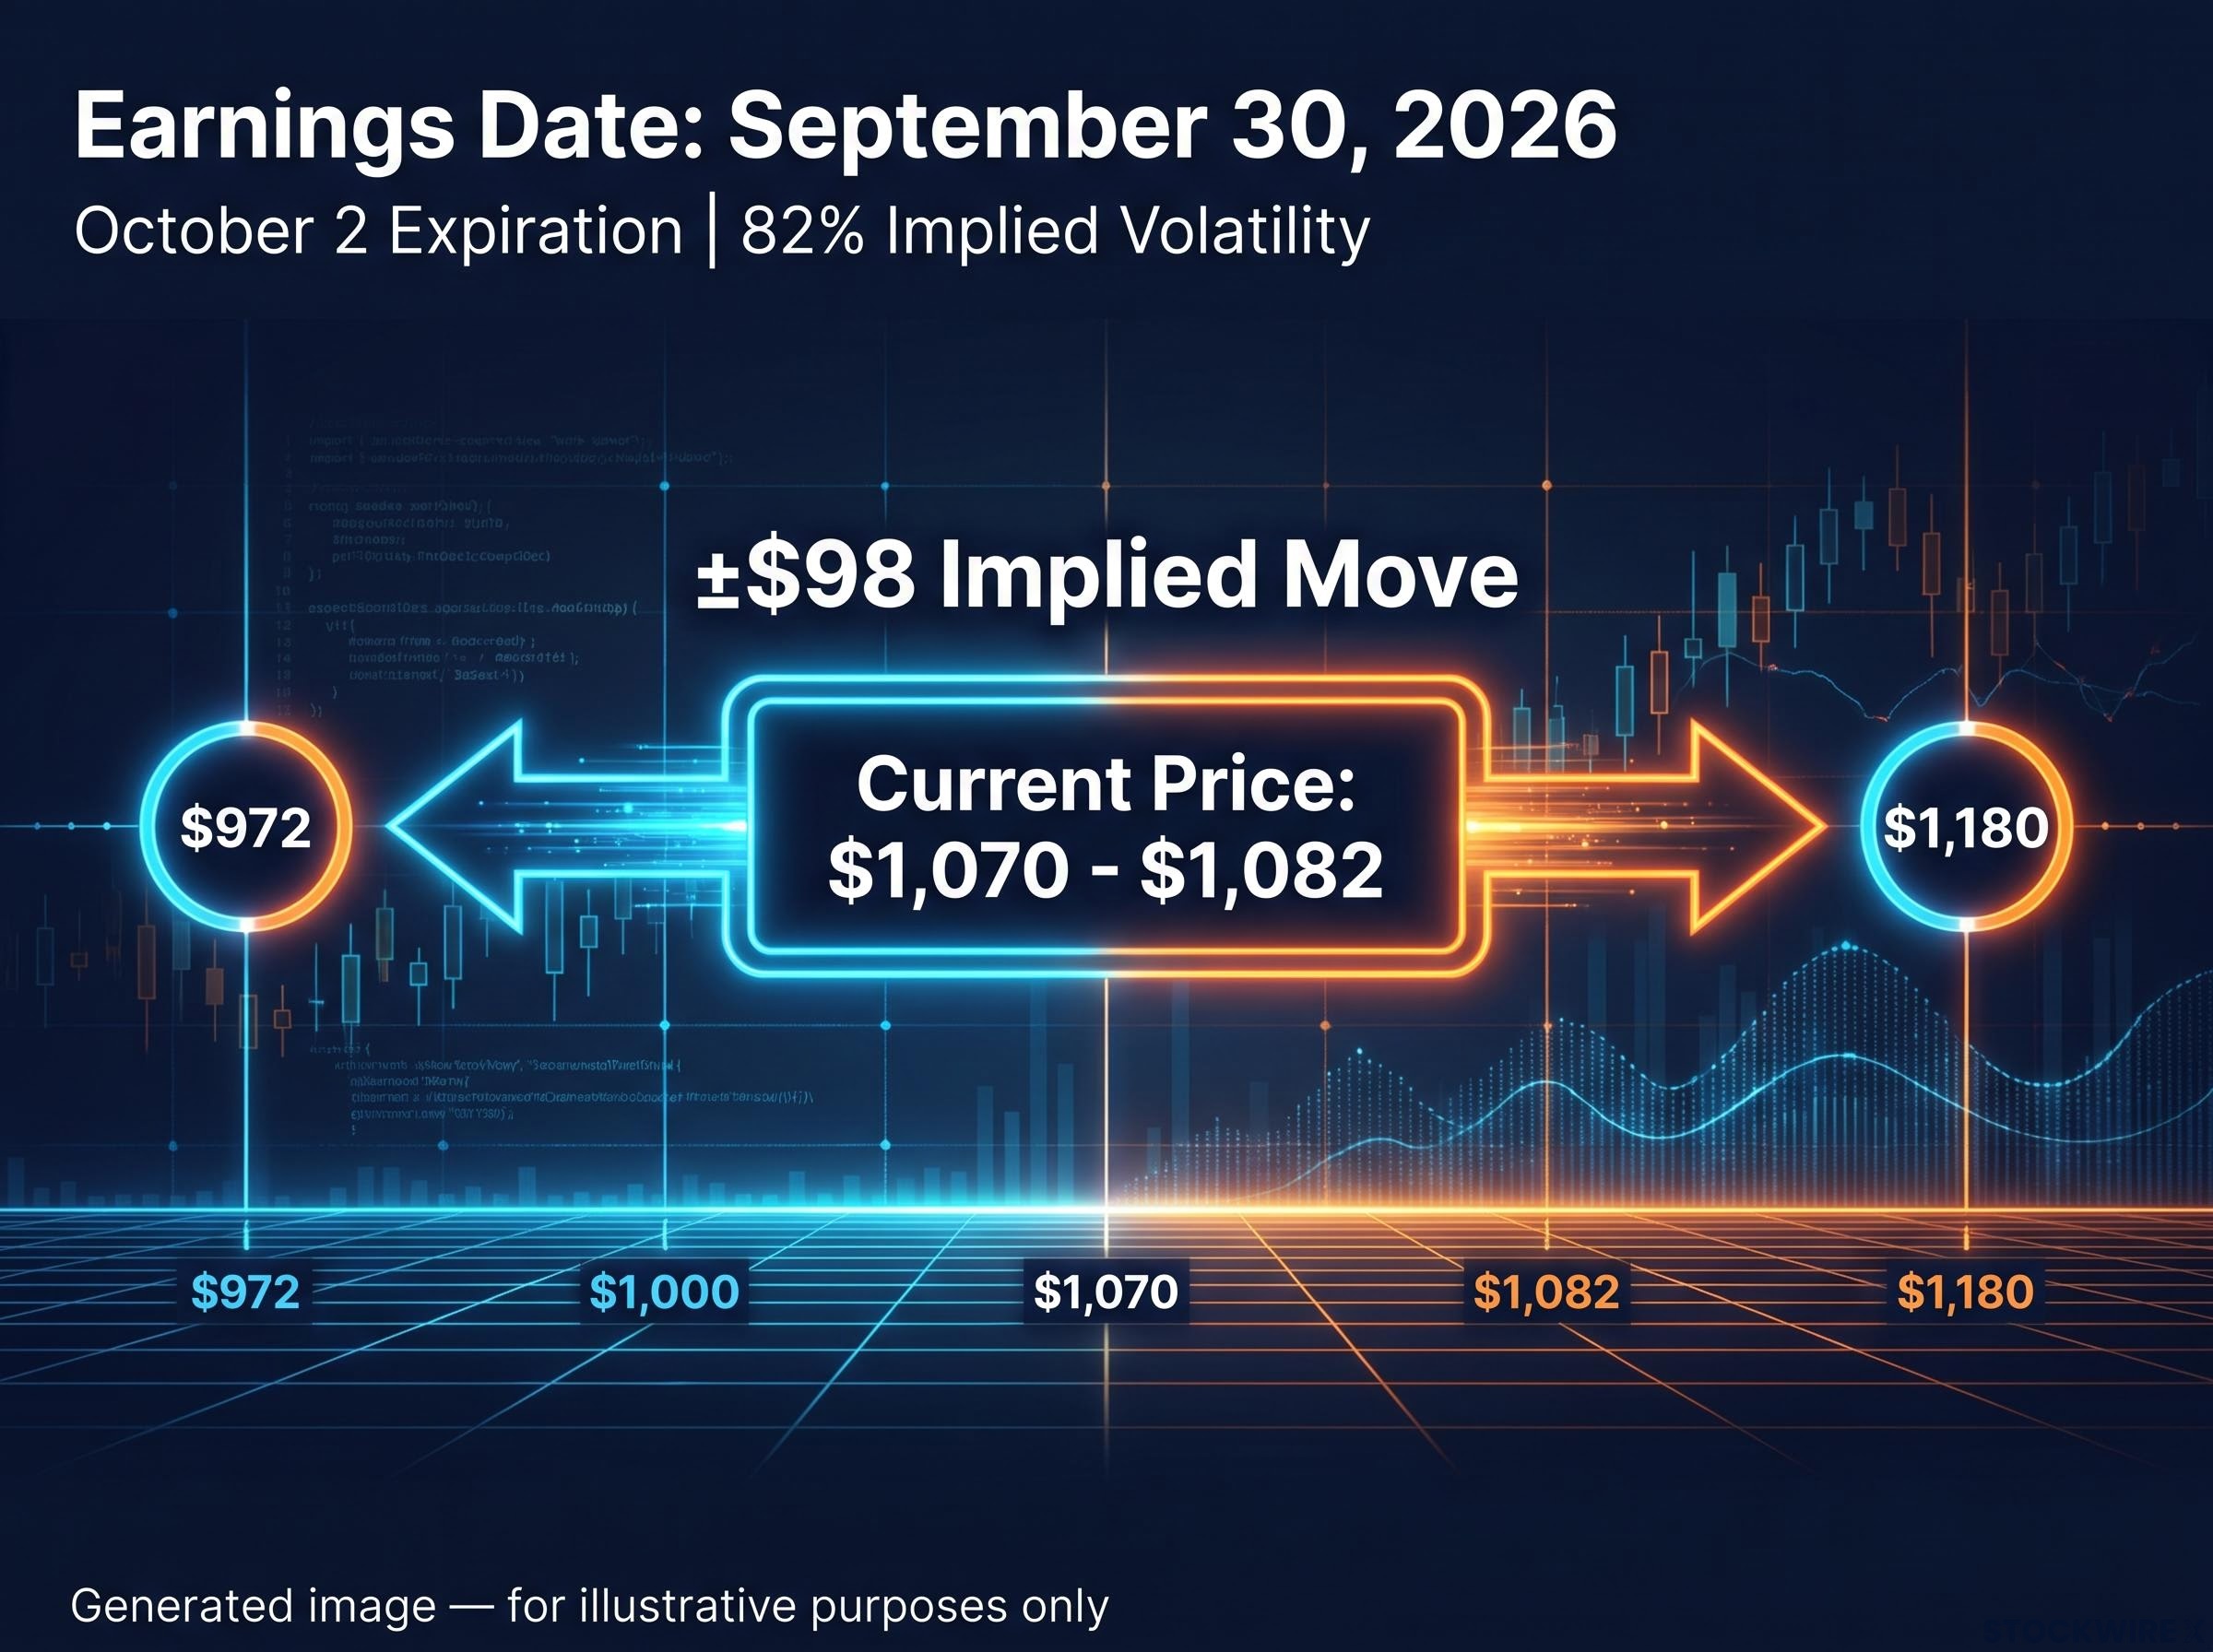
Start with the number that anchors everything else. Implied volatility on the October 2 expiration cycle, the one that captures the earnings event, is running at roughly 82%. On a stock trading between $1,070 and $1,082, that produces an expected move of approximately plus or minus $98 for the cycle.
Read that carefully. The market is saying Micron could realistically finish somewhere between roughly $972 and $1,180 just from this one report.
Now zoom out. Over the following 60 days, the total implied move is around plus or minus $200. The 8-day earnings cycle alone accounts for close to half of that entire two-month range. In other words, the market expects a single evening to matter as much as the eight weeks that follow it combined.
That 82% implied volatility is telling you something practical about your own positioning. If half of the stock’s two-month movement is packed into one overnight session, your position size has to actively account for gap risk. A stop-loss on the underlying will not protect you from a move that happens while the market is closed.
The 82% figure is itself a model output derived by reverse-engineering live option prices, and grasping implied volatility basics helps you understand why that number is a collective market expectation about movement magnitude, not a directional forecast about which way Micron will move.
Against these options figures sit Micron’s fundamentals. Wall Street consensus, according to Zacks Investment Research, puts Q4 revenue at roughly $50.86 billion with adjusted earnings per share near $31.44. The company itself guided to revenue of $50.0 billion give or take $1.0 billion, with gross margin near 86%. Demand is structurally tight: Micron has stated its entire 2026 high bandwidth memory output is already committed under contract.
| Metric | Financial estimate | Options market expectation |
|---|---|---|
| Consensus revenue | $50.86B | Implied move: ±$98 |
| Consensus adjusted EPS | $31.44 | October 2 IV: ~82% |
| Guided gross margin | ~86% | 60-day implied move: ±$200 |
AI data centres are projected to consume 70% of all memory chips in 2026, according to Micron Chief Business Officer Sumit Sadana, speaking at COMPUTEX 2026.
That structural demand is exactly why the premiums are so rich. The market is not just pricing a data point; it is pricing how long the shortage lasts.
The AI semiconductor sector outlook underpins why options premiums are so rich in the first place: Bank of America projects memory chip revenue to surge approximately 300% year-over-year in 2026, with HBM supply constraints expected to persist through 2028, sustaining the structural scarcity that inflates event-driven volatility.
When big ASX news breaks, our subscribers know first
Understanding how earnings IV crush deflates premium
Volatility can feel like a mystery, but around earnings it behaves in a mechanical and largely predictable way. The key concept is implied volatility crush, and once you understand it, high pre-earnings premiums stop looking like opportunity and start looking like a trap.
Implied volatility crush describes the rapid normalisation of option prices once the uncertainty of a binary event resolves. Before the report, premiums are inflated because market makers price in the possibility of a large overnight gap. After results land, that uncertainty disappears almost instantly, and the premium deflates with it.
Here is why that matters for you personally. Pre-earnings implied volatility reflects fear of a move, not the direction of one. So both calls and puts carry that inflated cost, and both lose the event premium the moment it is no longer needed.
The mechanics unfold in a clear sequence:
- Ahead of the report, implied volatility climbs as traders price in gap risk, inflating every option premium.
- That elevated volatility is compensation for uncertainty, not a forecast of which way the stock moves.
- The instant results are released, the event component of volatility is removed, and premiums fall sharply.
- Long option holders lose if the realised move is smaller than the implied move, even when their directional call was correct.
- Premium sellers benefit, because the inflated value they collected decays rapidly, provided the stock stays inside the implied range.
This is why buying an option purely because you have a directional view is so often a losing trade. If you buy a $1,170 call expecting good news, and Micron rallies but by less than the market implied, the collapse in volatility can wipe out your position even as you were right about direction.
The technical drivers here are vega and theta. Vega measures how much an option’s price moves when volatility changes, so long options lose value as volatility drops. Theta measures time decay, which accelerates once the catalyst has passed and the remaining time value evaporates.
The takeaway is uncomfortable but useful. Directional accuracy and profit are two separate things around earnings, and naked long options force you to win on both. That reframing should make you think twice before overpaying for premium the day before a release.
With Micron running at 82% implied volatility, IV regime and strategy selection diverge sharply from what everyday price movement suggests: elevated single-stock IV of this magnitude puts premium-selling structures, not directional long options, in their structural sweet spot.
Reading the upside call skew for market sentiment
Options prices are not just costs. They are a map of where money is positioned, and the pricing of Micron’s calls versus its puts tells you something the headlines do not.
Look at two strikes sitting roughly equidistant from the current price. The $1,170 call, about $100 above the pre-announcement price, is trading near $18 to $19, according to platform data from Tasty Live. The $970 put, about $100 below, is trading closer to $12.
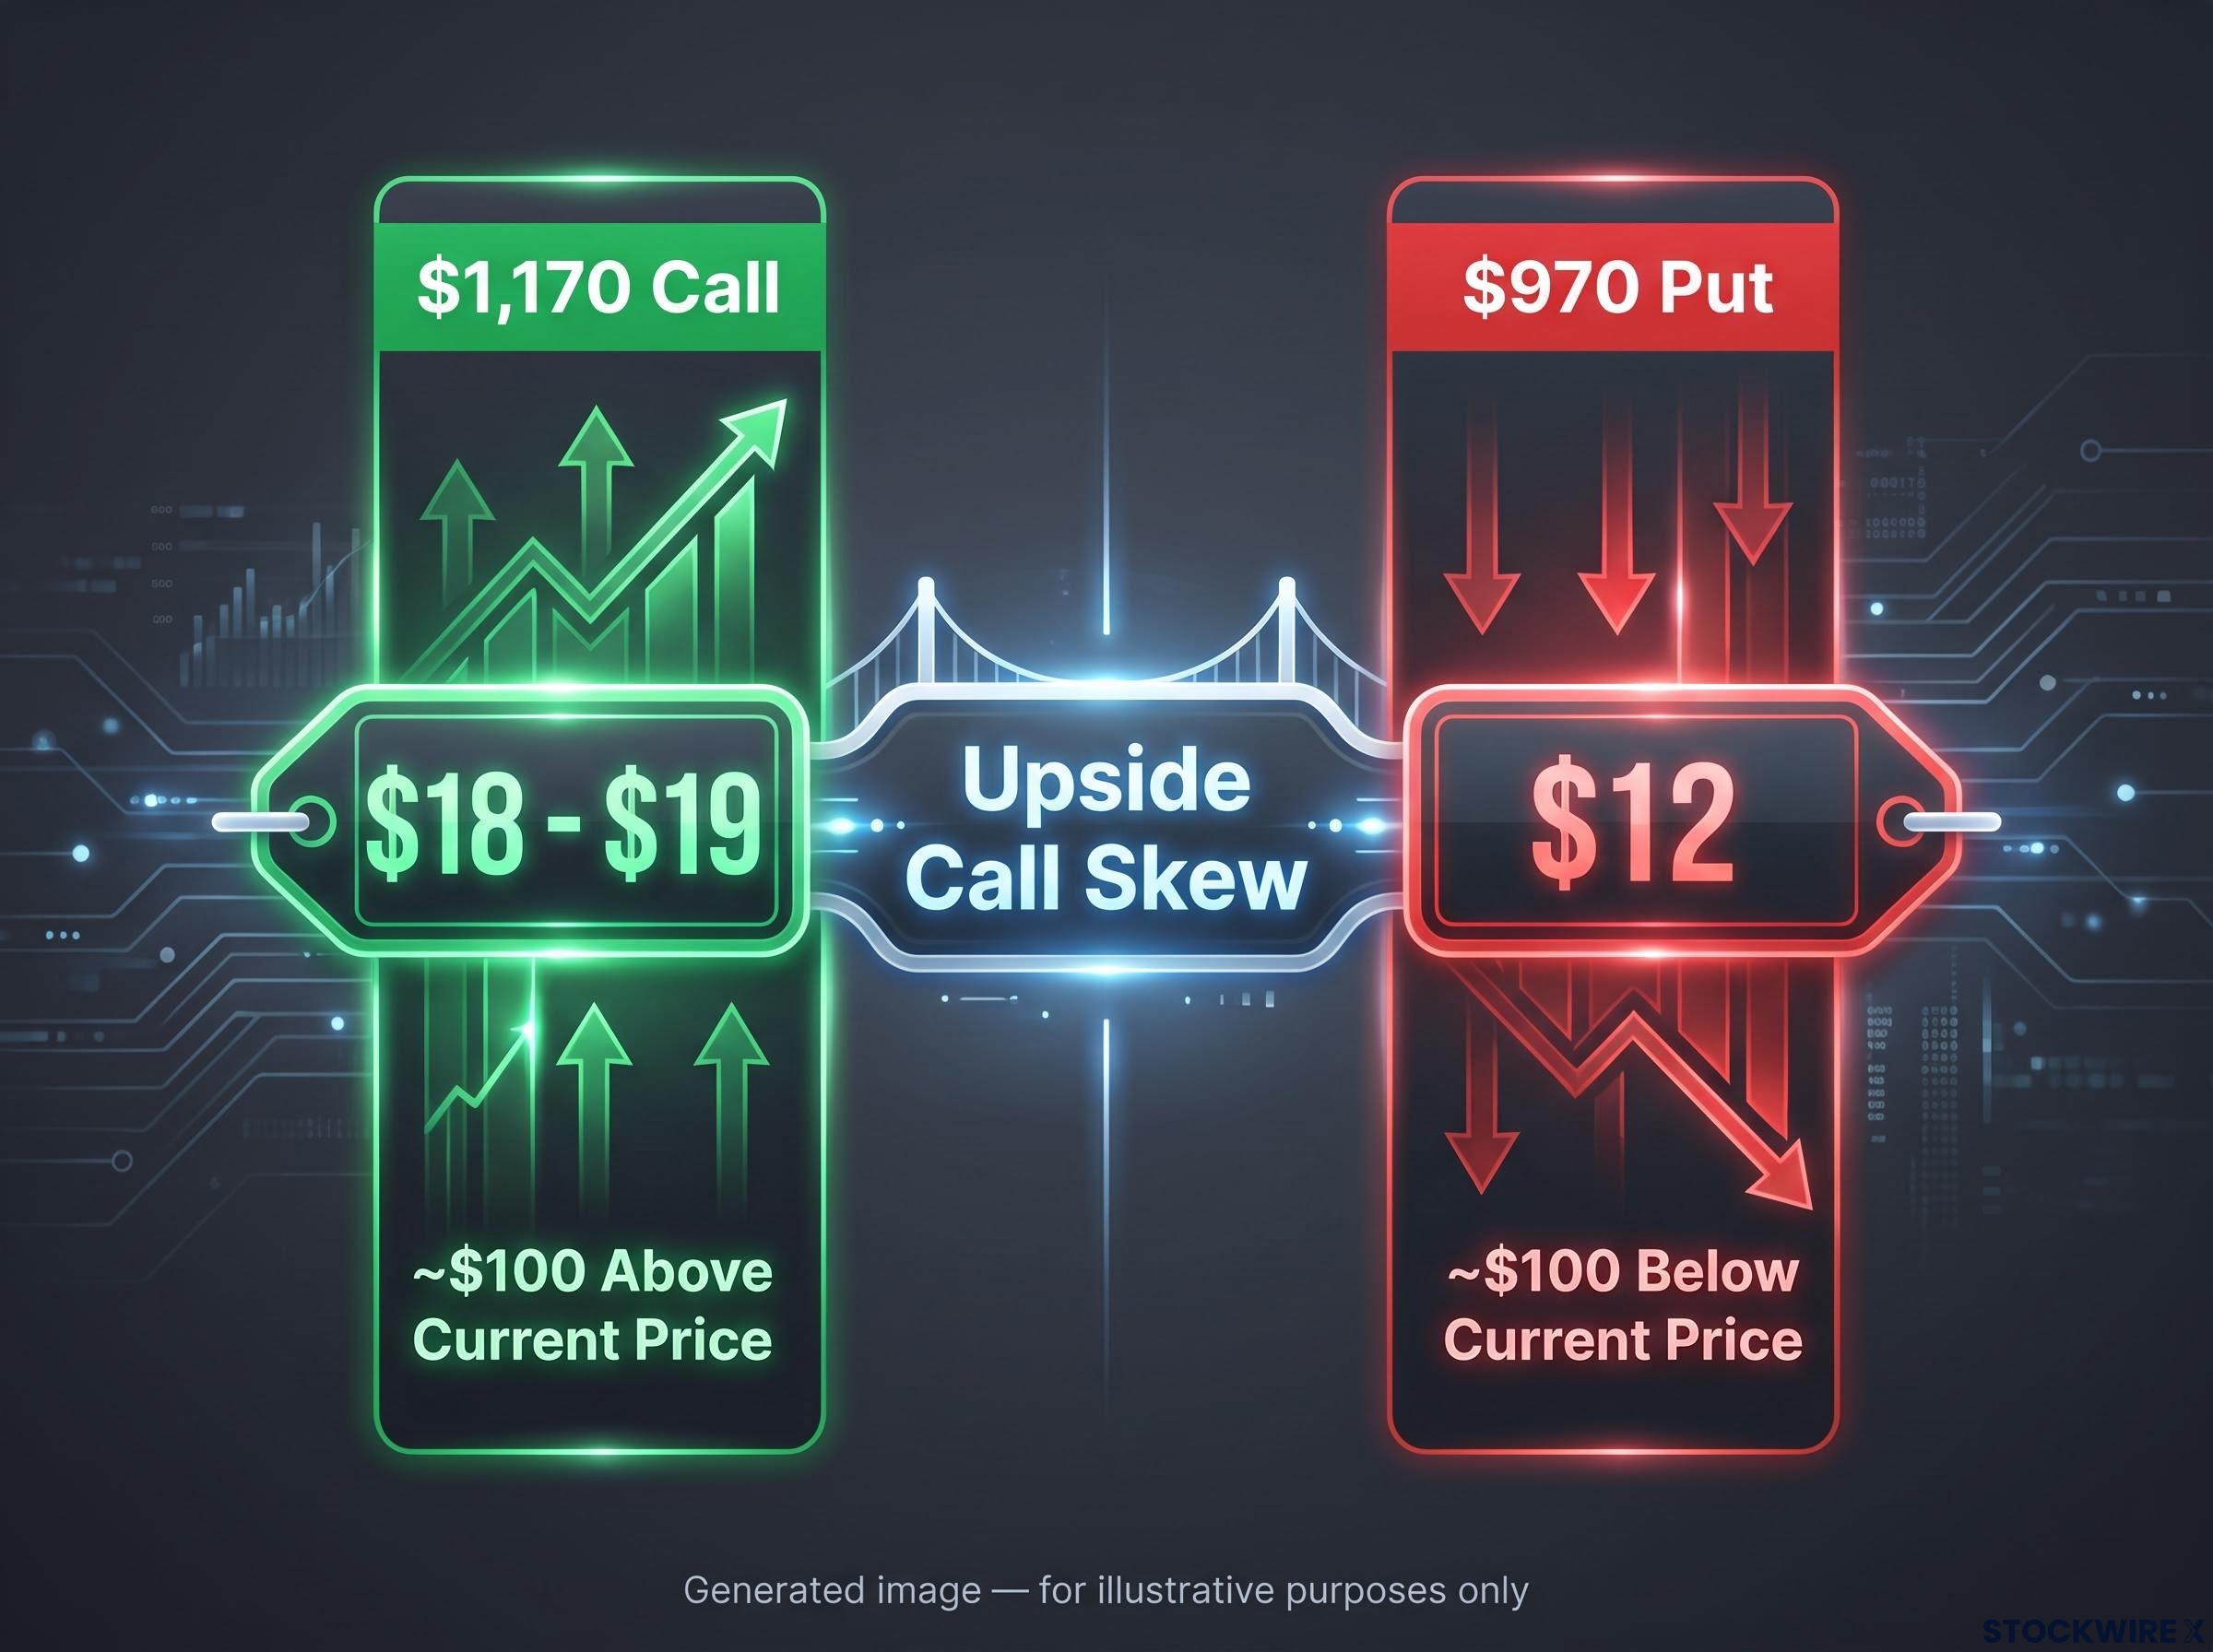
That gap is upside call skew, and it is the clue worth studying. Traders are paying meaningfully more to bet on Micron rising than to protect against it falling.
The bullish reading is straightforward. Investors are willing to pay lottery-ticket premiums for AI-driven upside, and the structural story supports the enthusiasm. Micron has raised its high bandwidth memory total addressable market forecast to cross $100 billion in 2027, according to Futurum Group, up from a $35 billion baseline in 2025. When the pot is that large, expensive calls suggest traders fear missing the move more than they fear a decline.
Options desks at major banks have made this point in the context of other AI beneficiaries. RBC Capital Markets strategist Amy Wu Silverman has described rich upside skew as evidence that investors will pay a premium for lottery-ticket payoffs into events, signalling bullish positioning.
The contrarian read on crowded call demand
There is another interpretation, and it should make you cautious. Skew reflects supply and demand for specific strikes, not the odds of a beat.
Derivatives strategists at Susquehanna and Bernstein have stressed that mechanical forces can distort skew independently of conviction:
- Structured product issuance and dealer hedging can push particular strikes rich, inflating call prices without any fundamental signal.
- When dealers are short upside calls, they may be forced to buy stock as it rallies, amplifying the move in a feedback loop that gets priced into skew.
- In fast-turning semiconductor cycles, heavy call demand can reflect speculative crowding rather than informed money.
Here is what expensive upside calls should tell you. Traders are genuinely afraid of missing the AI memory boom, but that crowded positioning is itself a vulnerability. If Micron merely meets expectations, those rich calls face a brutal double blow: no upside surprise to reward them, and a volatility crush to deflate them. A crowded trade unwinding is often more violent than the move that created it.
Navigating the model traps in probability metrics
Your trading platform will show you tidy probability percentages next to every strike. They look authoritative. They are also model outputs that can quietly lead you astray if you treat them as guarantees.
Take the $970 put. Platform data puts its probability of finishing in the money by October 2 at around 21%. Now look further out: the $1,250 to $1,255 range, which includes Micron’s prior all-time high of $1,255, carries roughly a 10% probability of expiring in the money.
A 10% chance sounds remote. You might glance at it and assume the stock is unlikely to trade there at all before expiration. That assumption is the trap.
The probability of expiring in the money is not the same as the probability of touch. The $1,250 to $1,255 range has a 10% chance of finishing there by expiry, but roughly a 20% chance of being touched at any point during the 8-day window.
That distinction has direct consequences for how you manage positions. If you set a stop-loss on your underlying stock based on a 10% expiry probability, you are ignoring the fact that the stock has roughly double that chance of reaching the level intraday. Blind reliance on expiry odds will shake you out of trades early, at exactly the wrong moment.
These probabilities are built from option-pricing models using current price, strike, time, and implied volatility. They assume a lognormal price distribution and constant volatility, assumptions that strain around a binary event.
The dangers of conditional probabilities
The deeper issue is that these figures are conditional on today’s elevated volatility. The model assumes the current 82% implied volatility persists through expiration. That is not what happens.
Once earnings are out, the volatility crush changes the entire distribution. The odds calculated before the report no longer describe the stock after it. A probability that looked reassuring on 29 September may be meaningless by 1 October, because the mathematical inputs that produced it have collapsed.
Treat platform probabilities as rough guides, not decision rules. Combine them with an understanding of how the distribution shifts after the event, and size your positions for the worst-case gap rather than the model’s comfortable middle.
Delta polarisation near expiry adds a second layer of risk that compounds the volatility crush: as October 2 approaches, any spread position’s net delta expands dramatically, meaning a position that felt directionally neutral on 29 September can behave like an outright stock exposure by the close on 2 October.
This article is for informational purposes only and should not be considered financial advice. Investors should conduct their own research and consult with financial professionals before making investment decisions. Past performance does not guarantee future results, and these figures are speculative and subject to change based on market developments and company performance.
Synthesising the options board before the bell
Put the three signals together and you have a complete read on what the market expects. The 82% implied volatility tells you the size of the move being priced, the upside call skew tells you where the crowd is leaning, and the probability metrics, read correctly, tell you the real path-dependent risk you face.
The lesson running through all of it is that a binary event like earnings demands you manage volatility risk alongside directional risk. Being right on Micron’s results is not enough if a volatility crush or an intraday touch works against you first.
Before the close on 30 September 2026, weigh your own positioning against that plus or minus $98 implied move. Ask whether your position size survives a full overnight gap, whether you are on the crowded side of the skew, and whether your stops reflect probability of touch rather than probability of expiry. Those three questions are the difference between reading the board and being read by it.