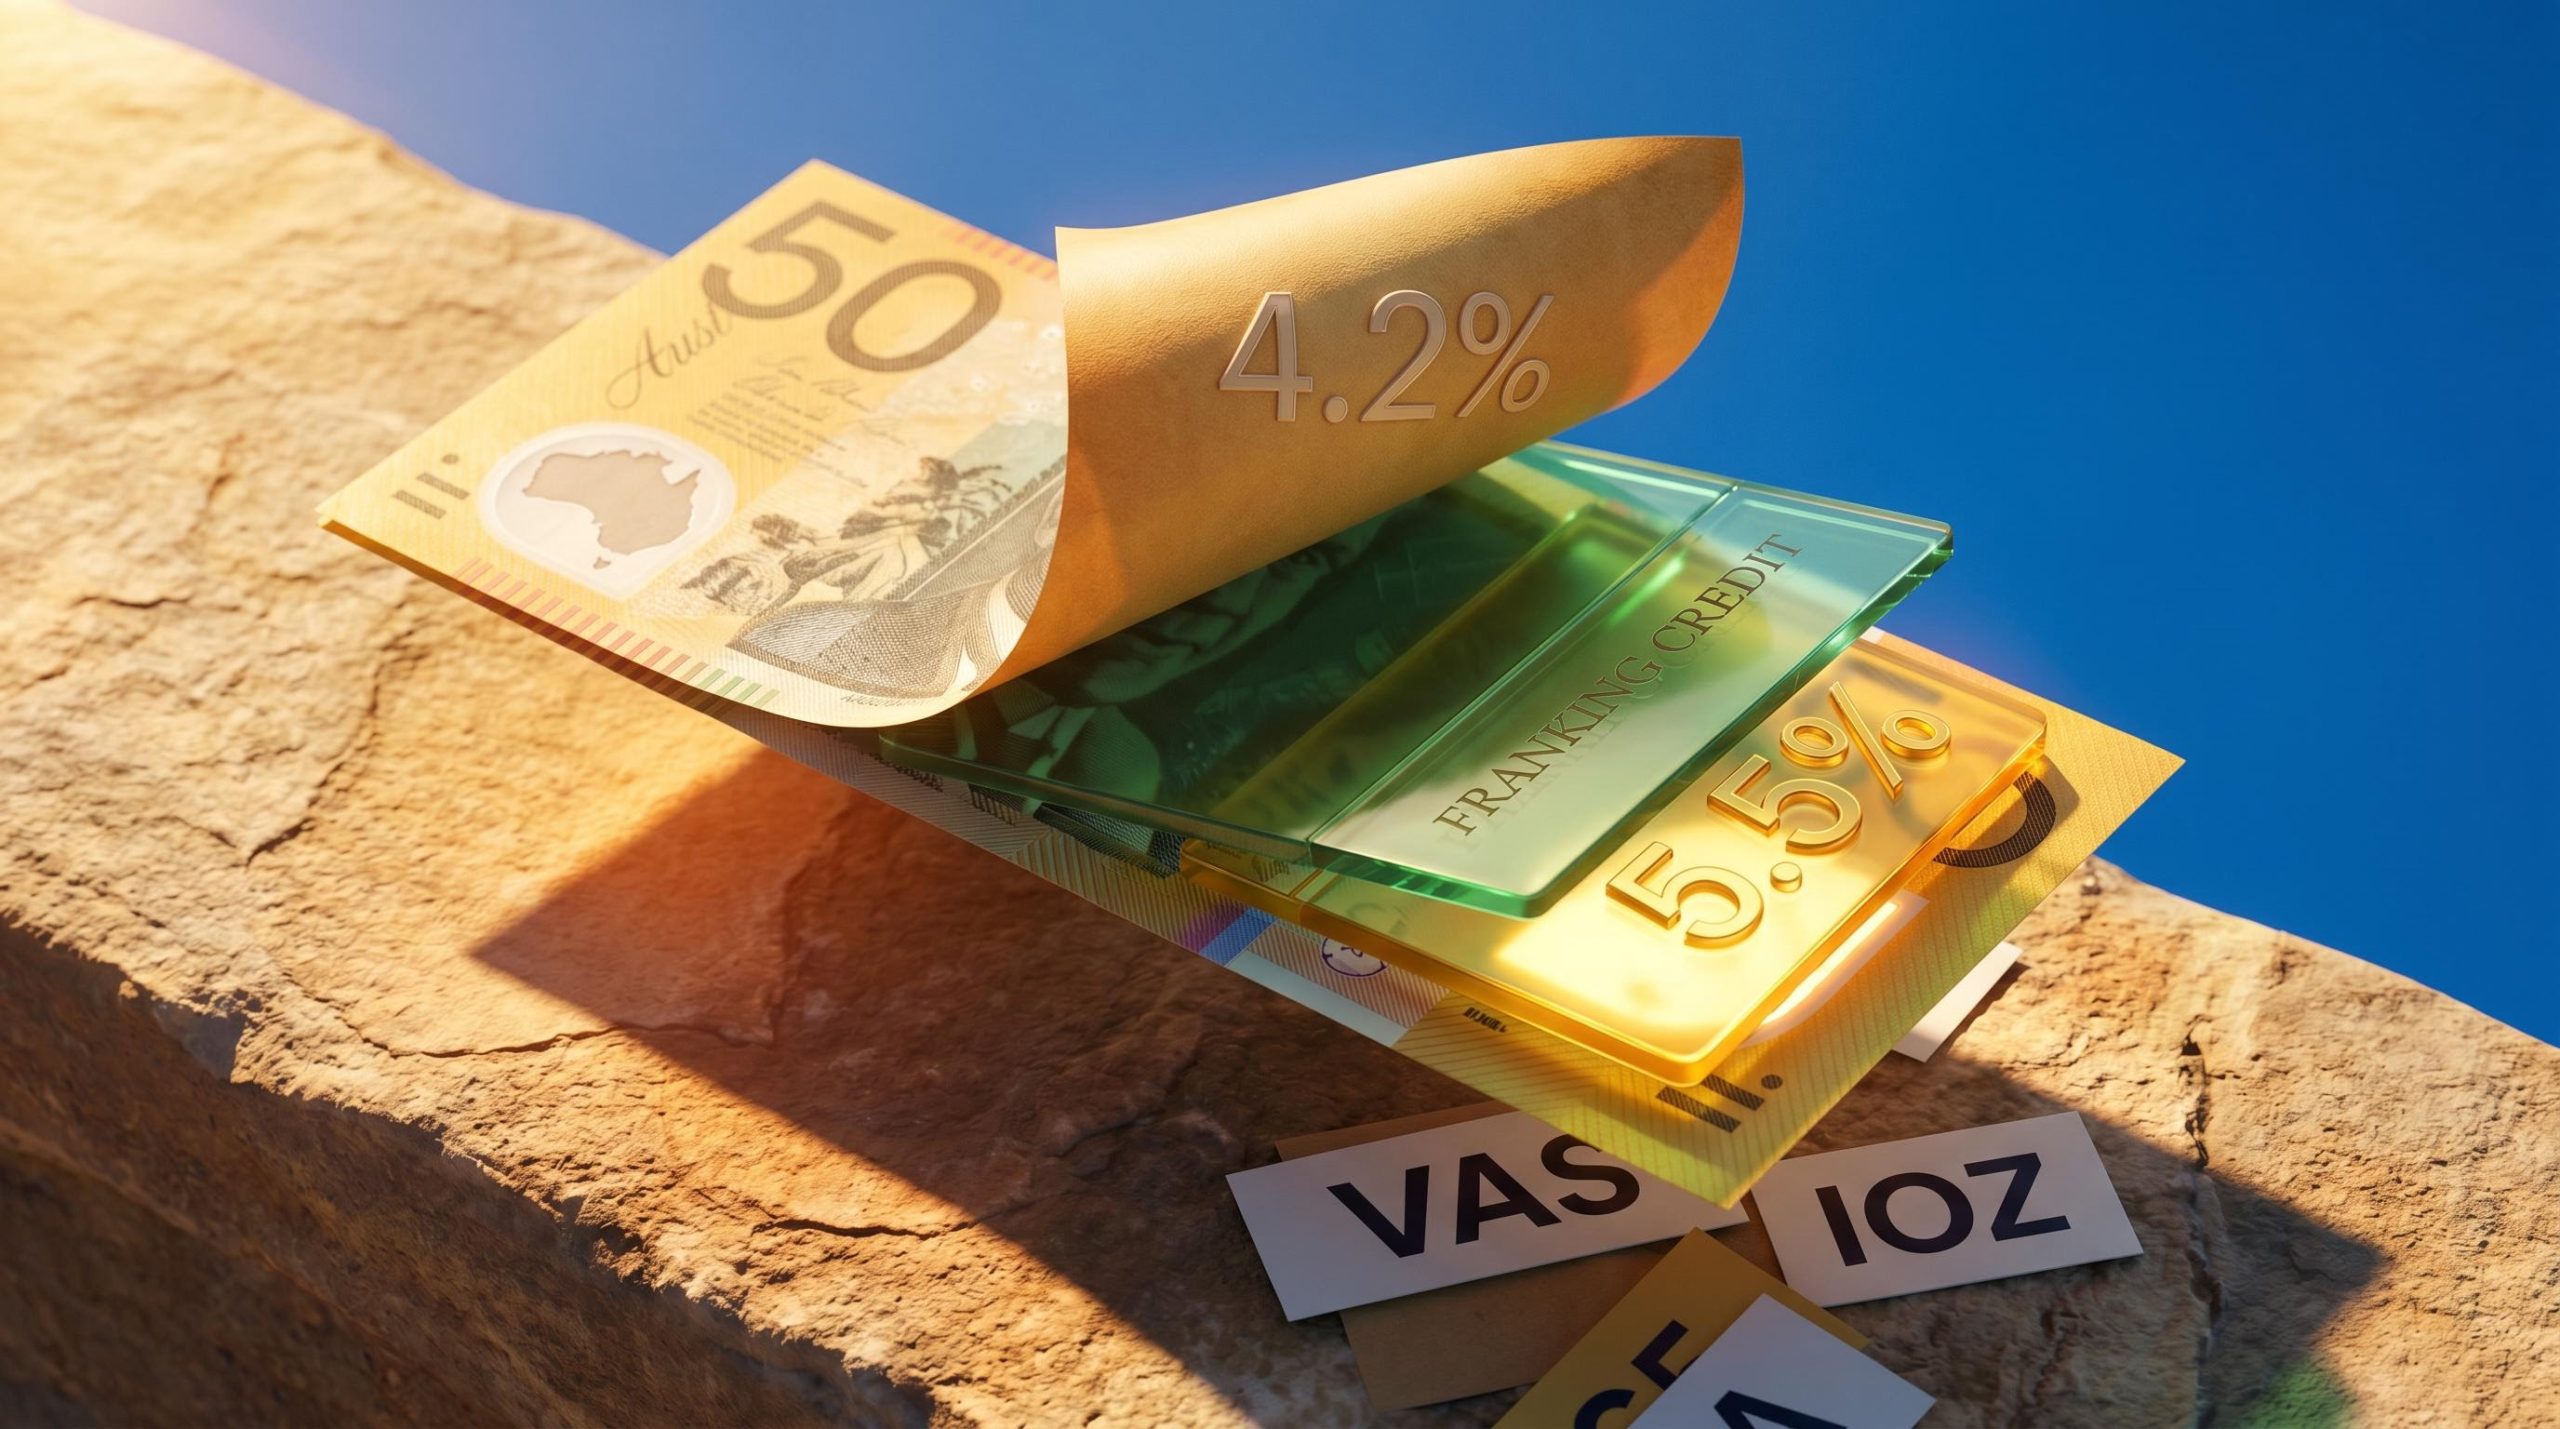
An ASX portfolio yielding 4.2% in cash terms does not tell the full story. Once franking credits are factored in, that same portfolio delivers a grossed-up yield closer to 5.5%, giving Australian dividend investors a structural after-tax advantage that investors in the United States or the United Kingdom simply do not have access to. With the Association of Superannuation Funds of Australia’s (ASFA) comfortable single retirement benchmark sitting at $54,840 per year as of the December 2025 quarter, more Australians are running the numbers on whether dividend income alone can fund their lifestyle, and whether their current savings trajectory will get them there.
This guide explains how Australia’s dividend imputation system works in plain terms, maps out the specific capital targets required to generate $50,000 to $150,000 in annual dividend income under 2026 yield conditions, and addresses the tax, concentration, and inflation risks that determine whether a dividend income strategy holds up over decades.
How Australia’s dividend imputation system creates an unfair advantage (in your favour)
Most investors around the world pay tax twice on the same corporate profit: once when the company earns it and again when the dividend lands in their personal account. Australian residents do not.
Under the dividend imputation system, introduced in 1987 under the Hawke government, companies that pay the 30% corporate tax rate on their profits before distributing dividends pass that pre-paid tax to shareholders as a franking credit. That credit directly offsets the shareholder’s personal tax liability, dollar for dollar.
The result is that dividends are effectively taxed only once. In the US and the UK, no equivalent mechanism exists. Shareholders there absorb both layers of taxation, reducing the after-tax income their portfolios generate from the same underlying corporate earnings.
The grossed-up dividend calculation follows a straightforward formula: the cash dividend multiplied by 30 and divided by 70, reflecting the 30% corporate tax already remitted by the company, meaning a $1,000 fully franked dividend becomes $1,428.57 of total value for an SMSF in pension phase or a low-income retiree once the ATO refunds the attached credit in cash.
The mechanism becomes especially powerful at lower income levels. Where franking credits exceed an investor’s total tax liability, the Australian Taxation Office (ATO) refunds the excess in cash. A retiree receiving fully franked dividends as their sole income can receive a cheque from the ATO rather than a bill.
The Parliamentary Budget Office dividend imputation explainer confirms that shareholders whose franking credits exceed their total tax liability are entitled to receive the difference as a direct cash refund from the ATO, a feature that places Australia among a very small number of jurisdictions globally that operate a full dividend imputation framework.
A 4.2% cash yield grosses up to approximately 5.5% with franking credits. The equivalent pre-tax yield a US investor would need to match this is higher still once personal dividend tax is applied.
Australia and New Zealand are among the only countries globally that maintain a full dividend imputation framework. The distinction matters for every capital calculation that follows:
- Corporate tax paid: Australian companies attach franking credits representing the 30% corporate tax already remitted to the ATO
- Shareholder credit: Australian residents receive those credits as an offset against personal income tax, eliminating double taxation
- Refundability: Where credits exceed total personal tax owed, the ATO refunds the difference in cash, a feature unique to a handful of jurisdictions worldwide
Understanding the grossed-up yield concept is the foundation of every capital figure in this guide. Without it, investors consistently underestimate how much income their portfolio is actually delivering after tax.
When big ASX news breaks, our subscribers know first
Defining your income target: ASFA benchmarks and lifestyle tiers
The phrase “financial freedom” means nothing until it carries a dollar figure. ASFA publishes quarterly retirement income benchmarks that translate lifestyle expectations into specific annual budgets. The most recent figures, from the December 2025 quarter (updated February 2026), apply to homeowners aged 65-84.
| Lifestyle Tier | Household Type | Annual Income Required | Monthly Equivalent |
|---|---|---|---|
| Modest | Single | $35,503 | $2,959 |
| Modest | Couple | $51,299 | $4,275 |
| Comfortable | Single | $54,840 | $4,570 |
| Comfortable | Couple | $77,375 | $6,448 |
| Premium | Single or Couple | $100,000+ | $8,333+ |
The premium tier, covering international travel and periodic vehicle upgrades, sits above ASFA’s comfortable benchmark and typically requires $100,000 or more annually. Younger investors pursuing early financial independence may need to target above the comfortable level, given they face more years of inflation exposure than a retiree entering the system at 65.
Knowing the specific income number is the single input that converts a vague aspiration into a capital goal. The next section makes that conversion explicit.
Portfolio size by income goal: the numbers behind dividend independence
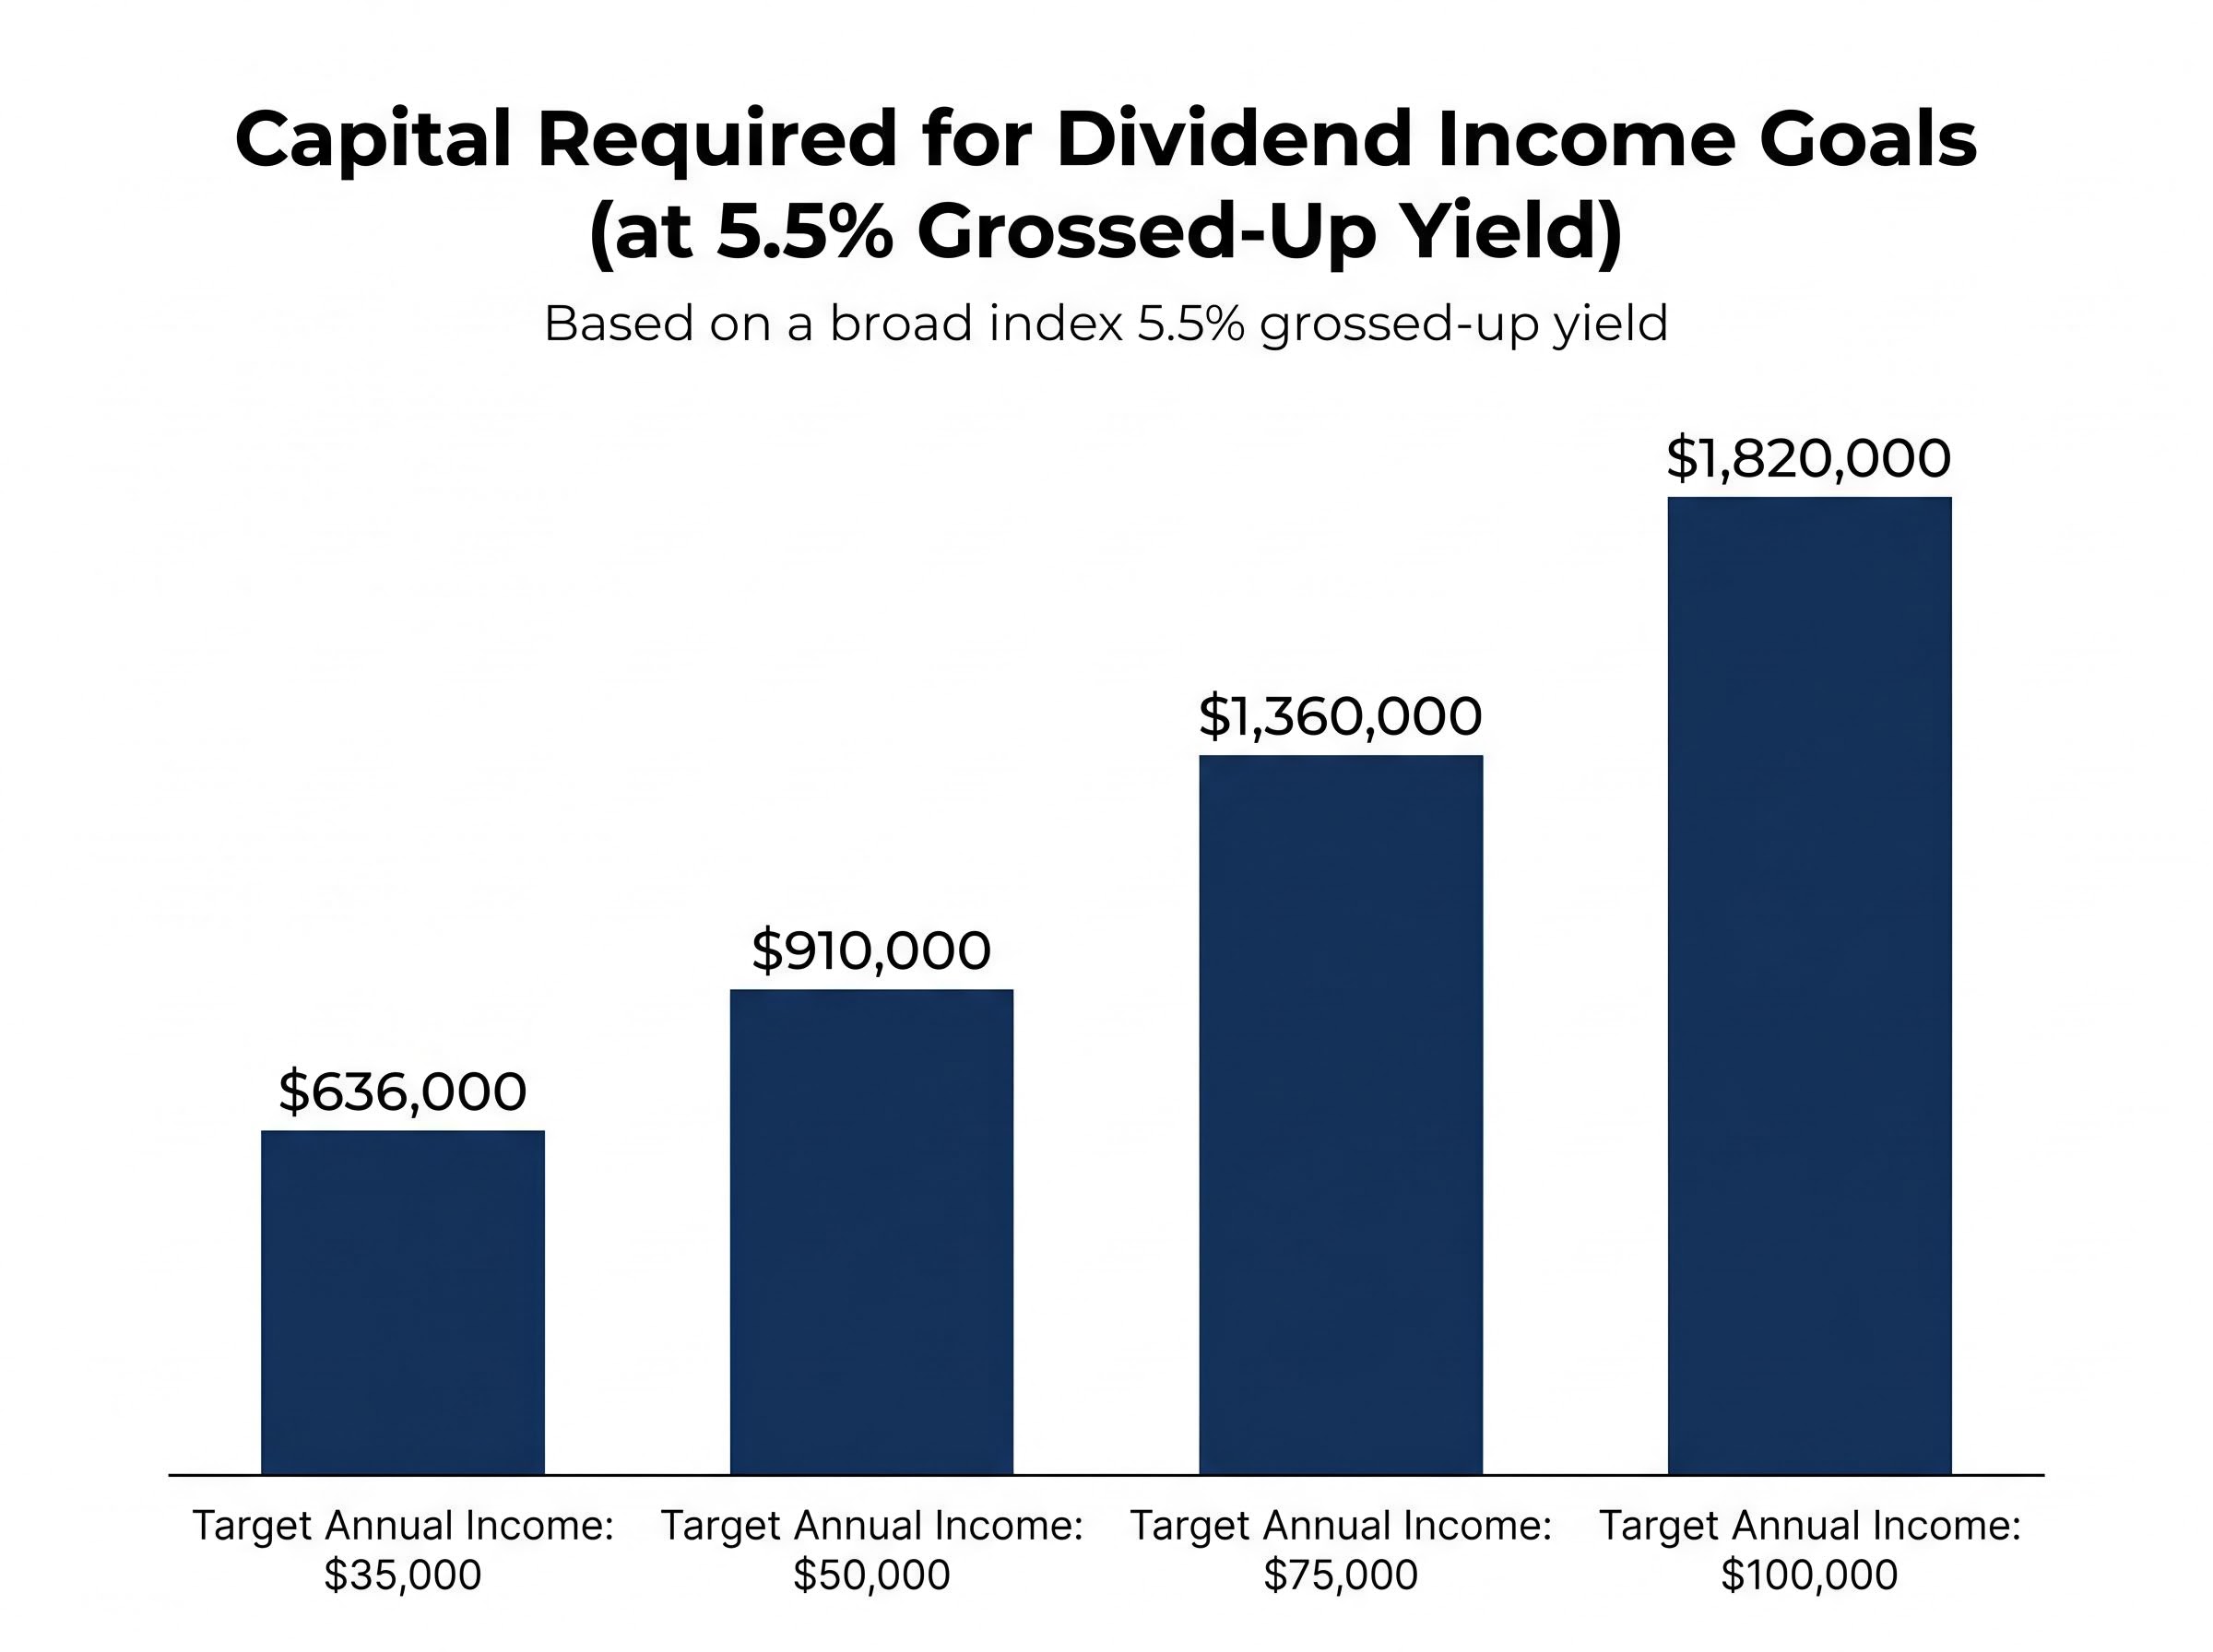
The arithmetic behind dividend independence is straightforward once the yield assumption is set. Using the 5.5% grossed-up yield that Morningstar cited for the ASX 200 as at February 2025, the formula is: Annual Income Required divided by Grossed-Up Yield equals Capital Required.
That 5.5% figure reflects a broad, index-level portfolio with approximately 70% franking across distributions. It does not assume yield chasing or concentrated sector bets. Two ETFs that approximate this profile are Vanguard Australian Shares Index ETF (VAS), with a trailing 4.1% distribution yield and 71% franking (grossing up to approximately 5.3%), and iShares Core S&P/ASX 200 ETF (IOZ), at 4.0% trailing yield with roughly 70% franking.
| Target Annual Income | Capital at 5.5% Yield | Capital at 7.0% Yield | Monthly Income | ASFA Tier Reference |
|---|---|---|---|---|
| $35,000 | $636,000 | $500,000 | $2,917 | Modest single |
| $50,000 | $910,000 | $715,000 | $4,167 | Between modest and comfortable single |
| $75,000 | $1,360,000 | $1,071,000 | $6,250 | Comfortable couple |
| $100,000 | $1,820,000 | $1,429,000 | $8,333 | Premium |
| $150,000 | $2,730,000 | $2,143,000 | $12,500 | Above premium |
The difference between the two columns is significant. An investor willing to accept a higher-yield portfolio tilt reduces the capital barrier to $50,000 in annual income from $910,000 to approximately $715,000. But that lower entry point comes with trade-offs.
What happens when you chase higher yields
Higher-yield ETFs such as BetaShares Australian Dividend Harvester Fund (INCM), at 7.8% trailing distribution yield, and BetaShares Australian Top 20 Equity Yield Maximiser Fund (BHY), at 9.1% trailing net distribution yield, achieve those figures through option overlays or concentrated high-yield stock selection, not superior earnings quality.
The trade-off is structural. Higher starting income often comes at the cost of lower capital growth, which compounds inflation risk over a retirement spanning two or three decades.
BHP illustrates how concentrated income sources can deteriorate quickly. The miner’s full-year dividend fell 17.6% in FY24 and its 1H25 interim dividend dropped a further 18.8% as commodity prices weakened. An investor relying on resource-sector yield for living expenses would have seen their income contract sharply in under 18 months.
The tax reality: who benefits most from franking credits
Franking credits are not equally valuable to every investor. The benefit scales with how much personal tax the credits can offset or, at the lower end, refund entirely.
The ATO’s tax-free threshold remains $18,200 (confirmed from 1 July 2024, unchanged by the Stage 3 tax cuts). For an investor with no other income, fully franked dividends up to approximately $30,000 annually can result in a near-zero net tax liability once franking credits are applied against the assessment. In practice, this means a substantial portion of dividend income arrives effectively tax-free.
An investor receiving $30,000 in fully franked dividends as their sole income can end the year with a tax refund rather than a tax bill.
Superannuation adds another layer. During the accumulation phase, investment income within super is taxed at 15%. In the pension phase, that rate drops to 0%, making super the most tax-efficient wrapper available for dividend income once preservation age is reached.
Three investor profiles illustrate how the benefit varies:
- Investor with no other income, receiving under $30,000 in fully franked dividends: Franking credits fully offset or exceed the tax assessment. The ATO refunds the excess in cash. Maximum benefit.
- Investor with part-time employment income: Franking credits reduce the total tax bill but do not eliminate it entirely. The benefit is partial, depending on the combined marginal rate.
- Retiree drawing income from a super pension phase account: Investment income inside the fund is taxed at 0%. Franking credits may generate a full refund to the fund, compounding the tax advantage.
Many Australians targeting dividend independence run dual portfolios: one inside super for long-term tax efficiency and one outside super for pre-preservation-age access. Understanding which income bands interact best with franking credits allows investors to sequence their drawdown strategy and avoid paying tax that careful structuring could legally eliminate.
Building toward the target: accumulation timelines and compound growth
The capital figures in the table above can appear daunting in isolation. Mapping them to a monthly contribution and time horizon makes the target tangible.
At an 8% assumed total annual return, a conservative planning baseline given the ASX’s long-term total return has historically exceeded that figure, an investor contributing $1,500 per month could accumulate approximately $900,000 over roughly 19 years. Increasing the contribution to $2,000 per month shortens the timeline to approximately 17 years. An investor starting this trajectory in their late twenties could reach financial independence before age 50.
During the accumulation phase, dividend reinvestment plans (DRPs) accelerate the compounding process:
- What a DRP does: Automatically reinvests dividend payments into additional shares rather than paying cash, increasing the number of units held without requiring a separate purchase decision
- When to switch it off: At the point where the investor transitions from building wealth to funding living expenses, DRPs are turned off so that dividends flow as cash income
- What the transition looks like: The portfolio shifts from a growth engine to an income engine without selling any holdings; only the destination of the dividend changes
The switch from reinvesting dividends to receiving them as income is the moment the portfolio starts paying the investor rather than building itself.
The dual portfolio structure discussed in the tax section supports this transition. External holdings can begin paying income before preservation age, while super continues compounding. Most ETF distributions are paid quarterly (January, April, July, October), and individual ASX stocks typically pay biannually (February-March interim, August-September final), which means blending the two can smooth monthly cash flow.
Superannuation balance benchmarks by age reveal that the average Australian aged 50-54 holds approximately $198,400 in super, more than $430,000 below the ASFA comfortable retirement threshold, which means the dual portfolio strategy described here, combining external holdings for pre-preservation access with compounding super contributions, is not optional for most households on a dividend independence trajectory.
The risks that can derail a dividend income strategy (and how to manage them)
A strategy built entirely on optimistic assumptions is not a plan. Four specific risks deserve honest assessment, ranked by the certainty that they will affect a dividend portfolio over a multi-decade horizon.
- Dividend cuts and concentration risk: The top ASX income payers are heavily weighted toward the major banks and large miners. These sectors can cut dividends simultaneously during downturns, as occurred in 2020. Livewire Markets (May 2024) and Morningstar (October 2024) both recommend broadening income sources via global equities, infrastructure, and fixed income rather than relying solely on Australian fully franked shares.
- Inflation eroding real purchasing power: At 3% annual inflation, a $50,000 income requirement today grows to approximately $67,000 within 10 years and roughly $90,000 within 20 years. A portfolio that delivers flat nominal income loses purchasing power every year.
- Sequence-of-returns risk in early retirement: Dividends are often perceived as smoother than share prices, but payouts can and do fall during recessions. A retiree drawing fixed income from a portfolio that cuts dividends in the first decade faces compounding damage to their capital base. Advisers recommend a cash buffer of 2-3 years of expenses plus an allocation to total-return investments to mitigate this risk, according to Money magazine Australia (February 2025).
- Franking credit policy change: No legislation altering refundability has been enacted since January 2024, but the AFR (18 March 2024) characterises franking refunds as “a live political issue.” Morningstar (July 2024) argues franking is “a bonus, not a guarantee” and should not be the sole assumption underpinning a financial independence plan.
Inflation and dividend growth over the long run
Australia’s major banks provide partial evidence that dividend growth can outpace inflation. CBA grew its full-year dividend by 4.4% in FY24. NAB delivered 3.6% growth, ANZ 3.8%, and Westpac 4.0% across the same period. These figures sit at or above the long-run inflation rate.
Recent halves tell a more modest story, with growth rates ranging from roughly 1% to 4% across the big four. And BHP’s dividend declines of 17.6% (FY24) and 18.8% (1H25) illustrate that dividend growth is not universal, even among the largest income generators on the ASX.
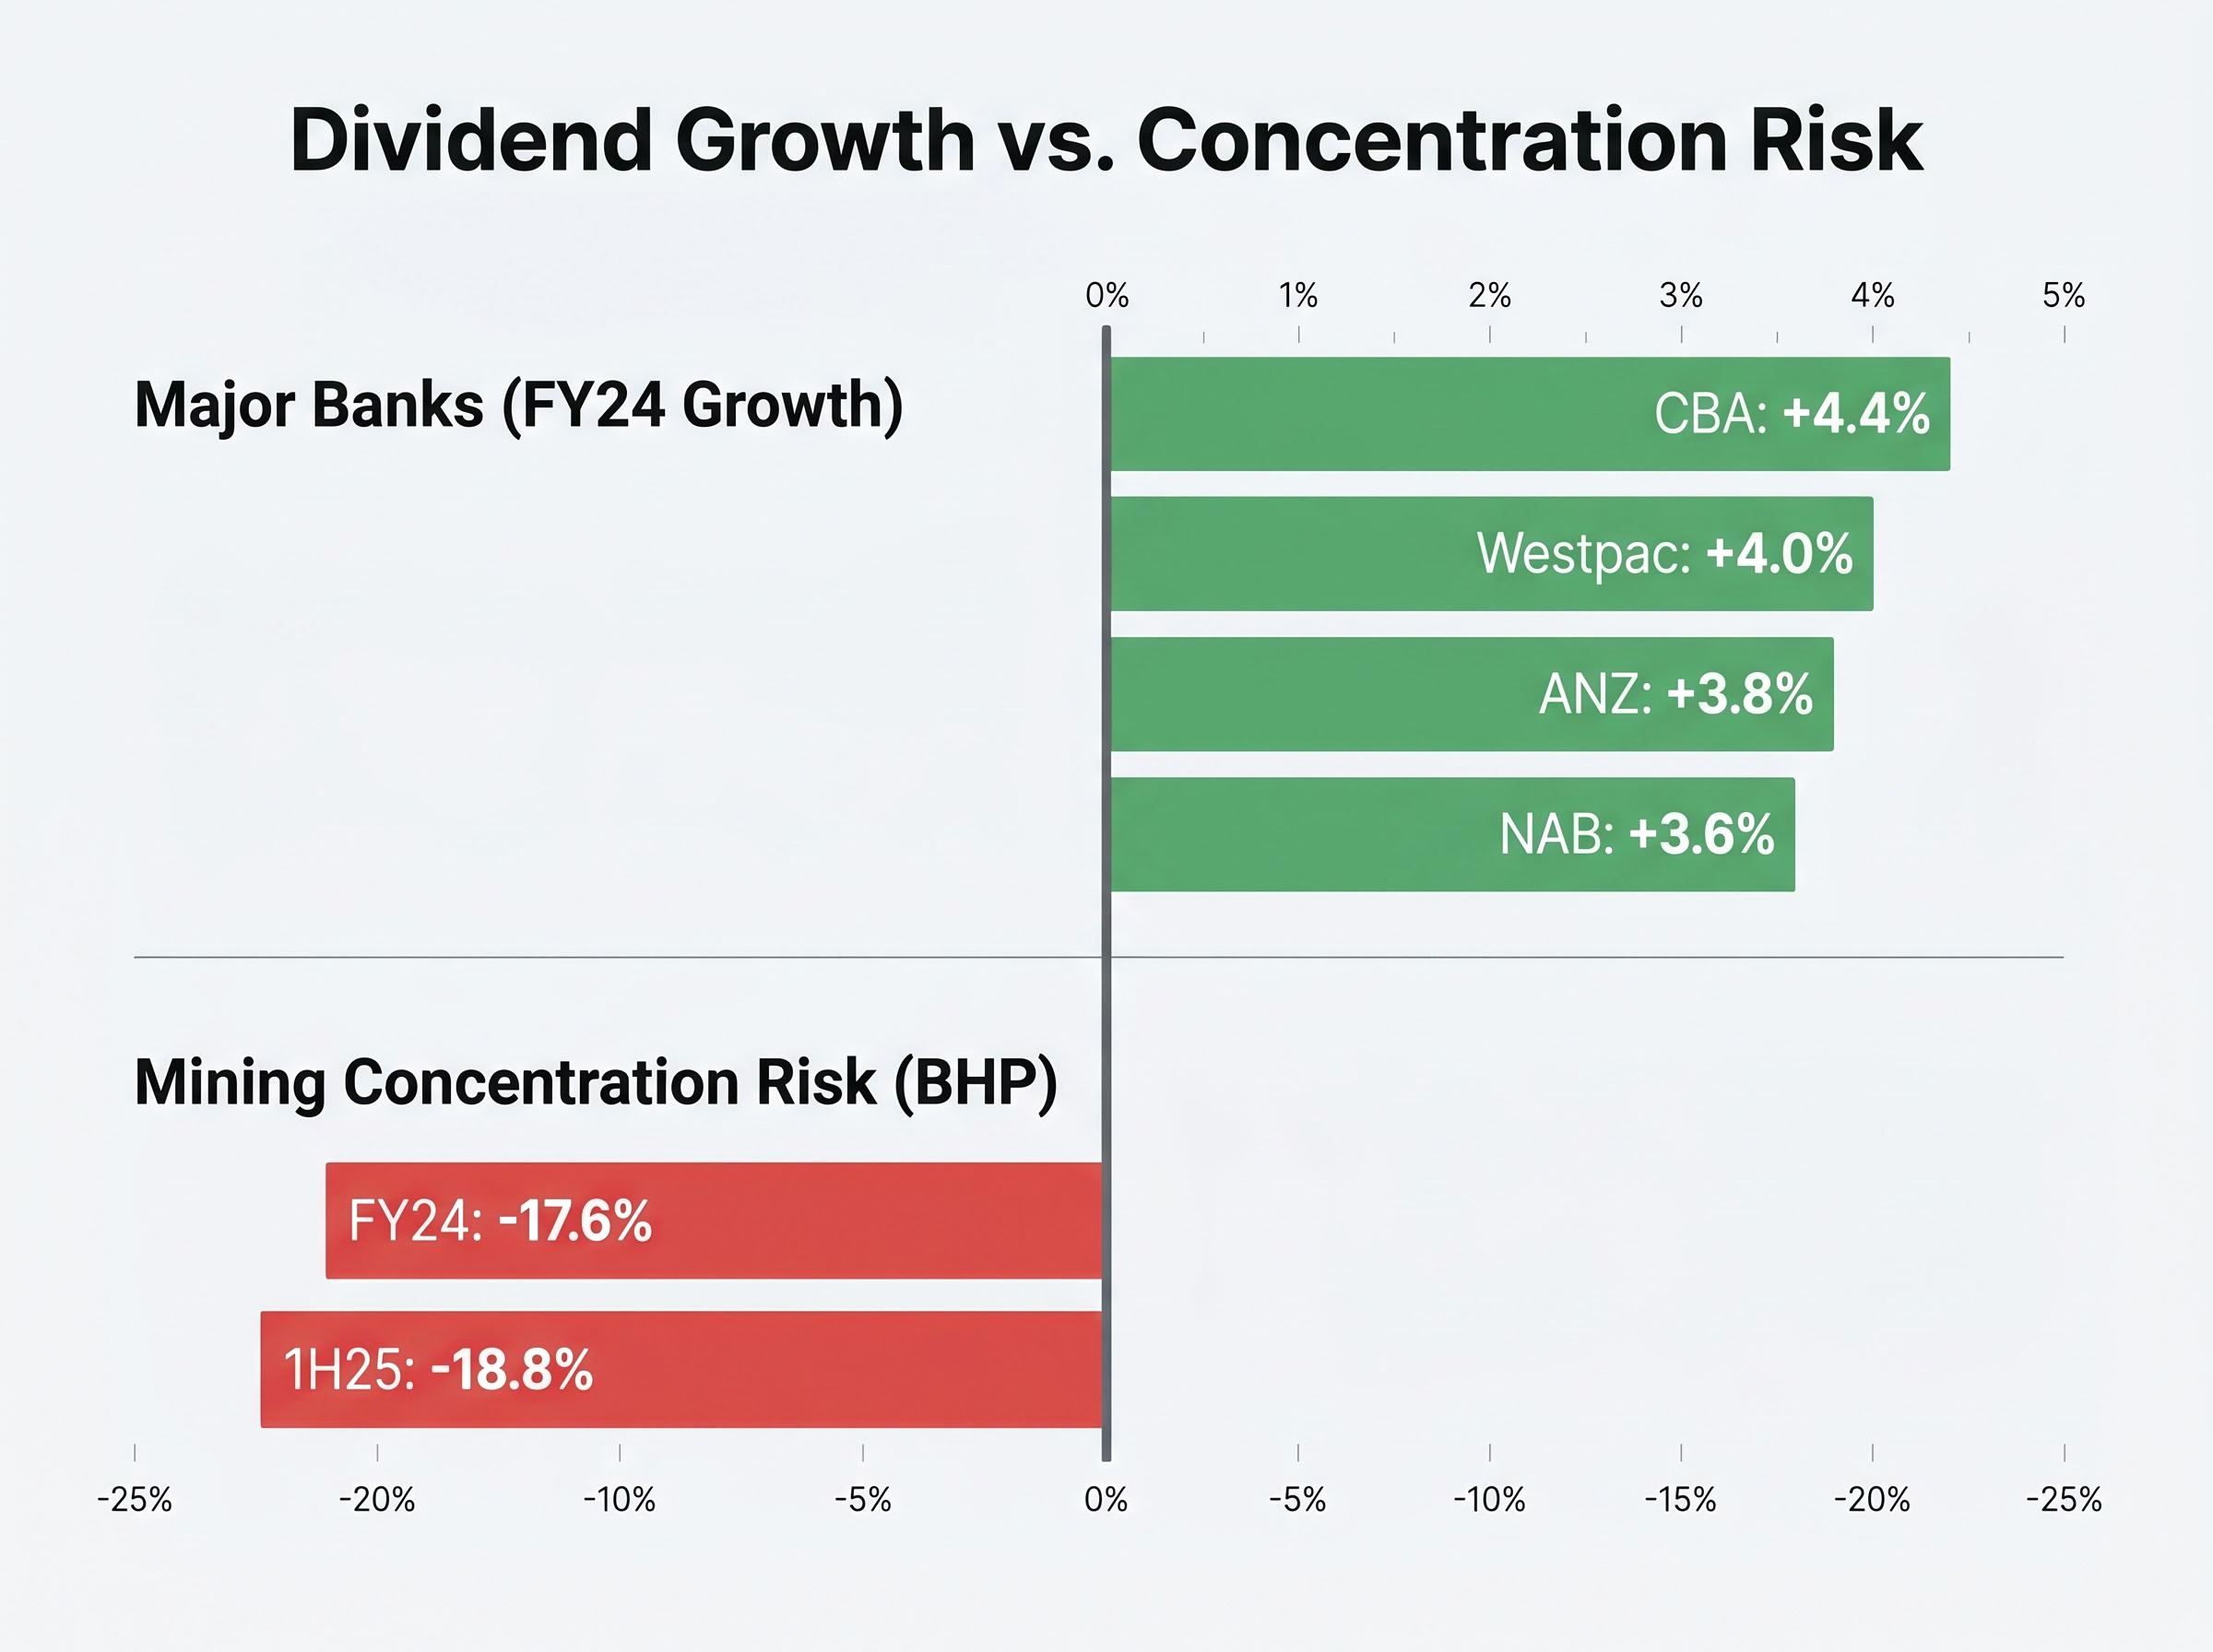
Dividend growth is best understood as a partial inflation hedge, not a guaranteed one. Portfolios that rely on a handful of resource-sector names for yield enhancement carry meaningful risk that income will not keep pace with rising costs.
For investors who want a detailed evidence base before committing to a yield-tilted portfolio, our deep-dive into high-dividend stock risk in 2026 examines how the MSCI World High-Dividend Yield Index performed peak to trough in early 2026 versus the broader market, why Financials, Utilities, and Real Estate routinely make up 65-85% of high-yield indexes, and what the total return data shows about yield-focused strategies across market cycles.
What a realistic dividend income portfolio looks like in 2026
A well-constructed dividend income portfolio in 2026 is not a collection of the highest-yielding names available. It is a two-layer structure built for durability.
The first layer is a broad index ETF core providing diversification and franking:
A detailed ASX dividend ETF comparison across VHY, SYI, IHD, and DVDY reveals a 30.7 percentage point gap in one-year total returns as at 31 March 2026, a spread driven entirely by index methodology differences rather than market conditions, which illustrates why ETF selection within the income category is not a commodity decision.
- VAS: Trailing 4.1% distribution yield, 71% franking, grossed up to approximately 5.3% (Vanguard, March 2025)
- IOZ: Trailing 4.0% distribution yield, approximately 70% franking (BlackRock, April 2025)
- These funds spread exposure across the full ASX 200, limiting the damage from any single dividend cut. A two-ETF portfolio approach is estimated to outperform approximately 90% of active stock pickers over a 20-year horizon.
The second layer is a yield-enhancement allocation using higher-income products or individual stocks:
- INCM: Trailing 7.8% distribution yield, suitable as a minority allocation for investors who understand the option-overlay mechanism that generates the elevated payout
- BHY: Trailing 9.1% net distribution yield, employing a similar yield-maximisation strategy on the top 20 ASX names
- Individual high-yield stocks can supplement this layer, though position limits and sector diversification remain important controls
Blending quarterly ETF distributions with biannual direct-share dividends creates a more even monthly cash flow pattern, reducing the need to hold excessive cash buffers between payment dates.
The target sustainable grossed-up yield for planning purposes sits between 5.5% and 7%, depending on risk appetite and the proportion allocated to yield-enhancement products. Capital targets should be aligned to specific ASFA-anchored income goals. A cash buffer and structural diversity across sectors and geographies are non-negotiable before declaring financial independence.
Dividend income from ASX shares is one of the most tax-advantaged income streams available to Australian residents. The key is building enough of it, in a diversified enough structure, to withstand the years when the income dips.
This article is for informational purposes only and should not be considered financial advice. Investors should conduct their own research and consult with financial professionals before making investment decisions. Past performance does not guarantee future results. Financial projections are subject to market conditions and various risk factors.