
Here is an uncomfortable piece of arithmetic. Every dollar parked in a savings account since 1940 has lost roughly 96 cents of its real purchasing power. On the same set of obligations, the US government’s real debt burden has shrunk by almost exactly that proportion.
One party held the savings. Another party held the debt. The outcome was never a coin toss.
This did not happen by accident. Across the 140 years from 1800 to 1940, cumulative US inflation totalled only about 28%. In the roughly 80 years since, it has run to approximately 2,200%. The shift from stability to persistent erosion was a structural choice, and the machinery driving it is not obscure economics. It is simple arithmetic operating in full view.
After this, you will be able to read the official inflation figure differently. Not as a neutral price statistic, but as a ledger entry in a transaction where one side holds the debt and the other side holds the savings. This explainer covers how inflation functions as a redistribution system, who carries the cost, and what the Treasury General Account reveals about how the whole thing operates in practice today.
How inflation silently moves money from savers to borrowers
Picture yourself as the saver. You have done what prudent people are told to do: set money aside in cash, a bank certificate of deposit, or Treasury bonds. Your balance is fixed in dollars, and that feels like safety.
Inflation quietly rewrites the deal. When the general price level rises, every fixed nominal claim, meaning any promise to pay a set dollar amount in the future, buys less than it did when you agreed to it. You receive exactly the dollars you were promised. They simply purchase less.
The counterparty on the other side of that arrangement wins by the identical amount. Whoever owes you a fixed sum repays it in cheaper dollars, and the largest such debtor in the world sits in Washington.
As of April 2026, gross federal debt stood at $39.0 trillion, with debt held by the public at $31.3 trillion, according to the Treasury Bulletin published in June 2026. The overwhelming majority of these obligations are nominal, meaning the dollar amounts owed do not rise with inflation. That makes the US Treasury the single largest beneficiary of any process that shrinks the real value of nominal debt.
Here is who sits where in the transaction, and which way real value flows:
- Savers and pensioners hold nominal claims (cash, deposits, bonds, fixed pensions) and lose real value as prices rise.
- The US Treasury holds nominal liabilities and gains real value as the debt’s real cost falls.
- The Federal Reserve sets the monetary rules of the game, influencing the pace at which this transfer occurs.
None of this requires a conspiracy. It is the automatic result of nominal contracts meeting a rising price level, running continuously in the background.
The arithmetic of the transfer, made concrete
Consider two people. One holds $100,000 in a savings account. The other, the government, holds $100,000 in nominal debt. Apply the current headline inflation rate of 3.4% year-over-year, recorded for August 2026 by the Bureau of Labor Statistics (BLS) on 11 September 2026.
At 3.4% annual inflation, every $100,000 in nominal savings loses approximately $3,400 in real purchasing power each year, while every $100,000 in nominal government debt loses the same amount in real cost to the Treasury.
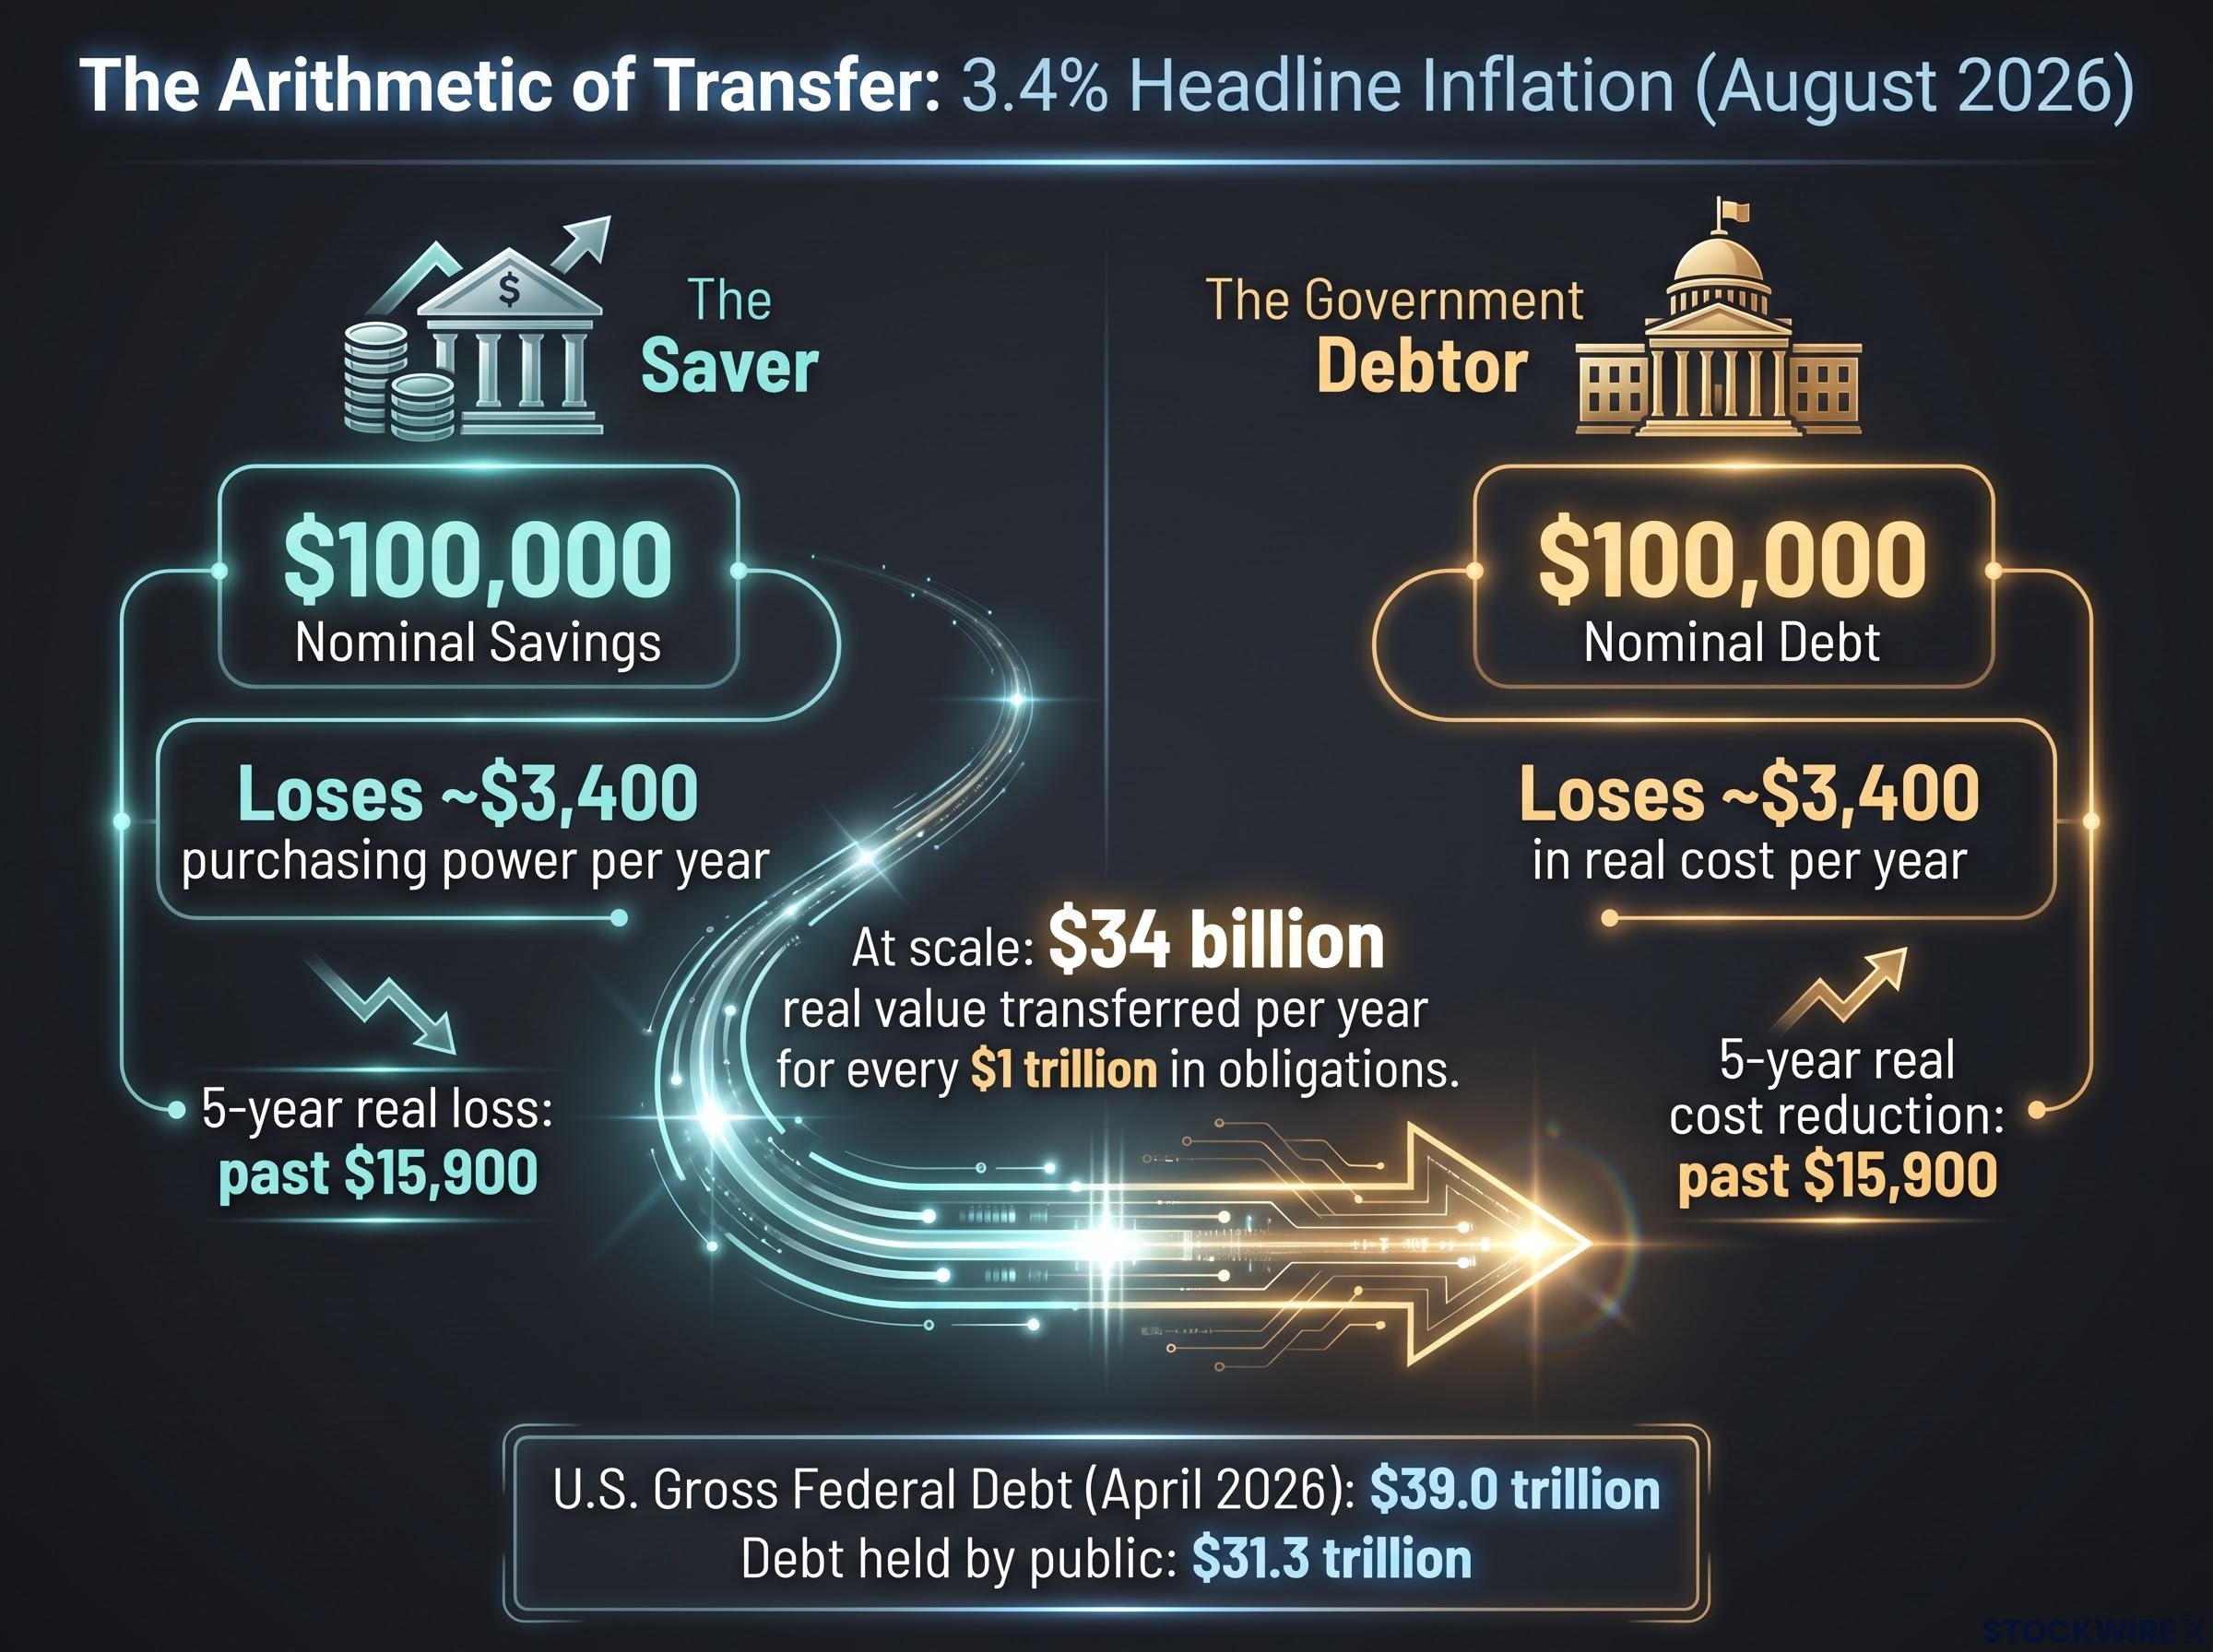
Compound that over five years and the saver’s real loss climbs past $15,900, before accounting for any interest earned. Scale it up: across $1 trillion in outstanding obligations, a 3.4% rate quietly transfers roughly $34 billion in real value per year to the debtor.
For you, the read is direct. A savings account paying 2% in a 3.4% inflation environment is not preserving your wealth. It is handing over roughly 1.4% of real value every year to the borrowing side of the deal, guaranteed.
Federal Reserve Survey of Consumer Finances data puts the real cost of idle cash into stark relief: middle-wealth households hold around 15% of total assets in cash while households above $1 million hold just 6%, a structural allocation gap that compounds silently across the same 30-year horizon this article’s arithmetic describes.
When big ASX news breaks, our subscribers know first
140 years of price stability versus 80 years of persistent erosion
It helps to remember that money was not always like this. For most of American history, prices barely moved.
From 1800 to 1940, cumulative inflation ran to only about 28% across the entire 140-year stretch, an average of roughly 0.2% a year. A dollar saved early in that period held its worth in a way that would feel almost unimaginable now. Prices could fall as easily as they rose. Long-term saving in nominal dollars was a reasonable plan.
Then the regime changed. Since 1940, cumulative inflation has reached approximately 2,200%, averaging about 3.7% annually. A 1940 dollar is worth less than five cents in today’s purchasing power.
| Era | Annual average inflation | Cumulative inflation | Value of a 1940 dollar |
|---|---|---|---|
| 1800-1940 (140 years) | ~0.2% | ~28% | Baseline reference |
| 1940-present (~80 years) | ~3.7% | ~2,200% | Under 5 cents |
That 2,200% figure is not a historical curiosity. It is the lived experience of every retiree who saved in nominal dollars and every pensioner whose fixed benefit was set in a currency that has since lost 96% of its 1940 value.
The gap between the two eras looks small on paper. The difference between 0.2% and 3.7% a year does not sound dramatic. Over multi-decade horizons, it decides who keeps their wealth and who watches it drain away.
Financial repression: the policy toolkit behind the numbers
The regime shift was not an act of nature. Economists Carmen Reinhart and Kenneth Rogoff have documented how advanced economies deliberately used inflation, paired with caps on interest rates, to erode enormous war debts without ever formally defaulting.
The tactic has a name: financial repression. In plain terms, governments hold nominal interest rates below the inflation rate, so savers earn negative real returns while the state’s debt quietly shrinks in real value.
The United States ran exactly this playbook after the Second World War, when federal debt sat near 100% of GDP. The United Kingdom did the same, keeping yields on government bonds low while allowing positive inflation, which handed domestic savers and pension funds real losses through the 1950s and 1960s. In both cases, the debt fell dramatically, and conservative savers footed the bill.
The United States is not the only modern example: financial repression is currently being operationalised through the Treasury’s expanded long-bond buyback programme, which effectively suppresses long-end yields below what an unfettered market would demand, replicating the post-war yield-cap playbook in a different institutional wrapper.
Who pays the inflation tax, and by how much
Inflation does not spread its cost evenly. Some people barely feel it. Others carry a disproportionate share, and the reason comes down to what they own.
If your wealth sits mostly in real assets, meaning equities, property, or inflation-linked instruments, you have some natural protection because those values tend to climb with the price level. If your wealth sits in nominal assets, meaning cash, CDs, bonds, and fixed pensions, you absorb the full erosion.
The people most exposed cluster into four groups:
- Retirees on fixed pensions and annuities, whose benefits do not keep pace with rising prices.
- Low-income households, who spend a larger share of their budgets on necessities that often rise faster than the headline index.
- Savers concentrated in cash and CDs, earning yields below inflation.
- Holders of long-duration nominal bonds, locked into fixed payments for years or decades.
Research by economists including Dirk Krueger and Fabrizio Perri shows that older and lower-income households are precisely the groups most concentrated in nominal assets and least likely to hold inflation-hedging assets like shares and real estate. They sit on the losing side of the transfer by default.
Asset ownership concentration compounds the distributional asymmetry: IMF research estimates that around 70% of the gains from government-deficit-driven asset price surges flow to the top 10% of households through their portfolio holdings, meaning the same inflation that erodes nominal savers’ wealth simultaneously inflates the real assets held by those already wealthy.
The problem compounds through measurement. The BLS publishes an experimental index, the Consumer Price Index for the Elderly (CPI-E), which tracks the prices seniors actually face. It consistently runs above headline CPI, largely because healthcare and housing consume a larger slice of a retiree’s budget.
If you are a retiree relying on Social Security cost-of-living adjustments and a fixed defined-benefit pension, that gap is not a technicality. When the official CPI used to set your adjustment undershoots the real price increases you face, your cost-of-living raise undershoots too, and your real standard of living declines a little more each year.
When inflation runs above the nominal yield on government bonds and bank deposits, the real return to savers turns negative while the state’s real debt burden shrinks. Retirees living off fixed pensions and annuities experience declining purchasing power. This is the observation Martin Wolf of the Financial Times has made repeatedly.
Not everyone reads the same facts the same way. There are three broad interpretations of what this redistribution actually represents:
- The Austrian and monetarist critique treats it as a covert tax on savers, a way for the state to manage its own debt at the expense of prudent households.
- The New Keynesian framing treats moderate inflation as a socially necessary adjustment, preferable to fiscal crisis or brutal austerity.
- The mainstream consensus notes that predictable, expected inflation is largely priced into contracts and yields, which limits the redistributive damage when inflation matches what markets anticipated.
The disagreement is about the label and the ethics, not the mechanism. On the mechanism itself, the evidence points one way.
The Treasury General Account: the liquidity lever most savers have never heard of
There is a second layer to how the government shapes monetary conditions, and it runs almost entirely below public awareness. It lives in an account most savers have never heard of.
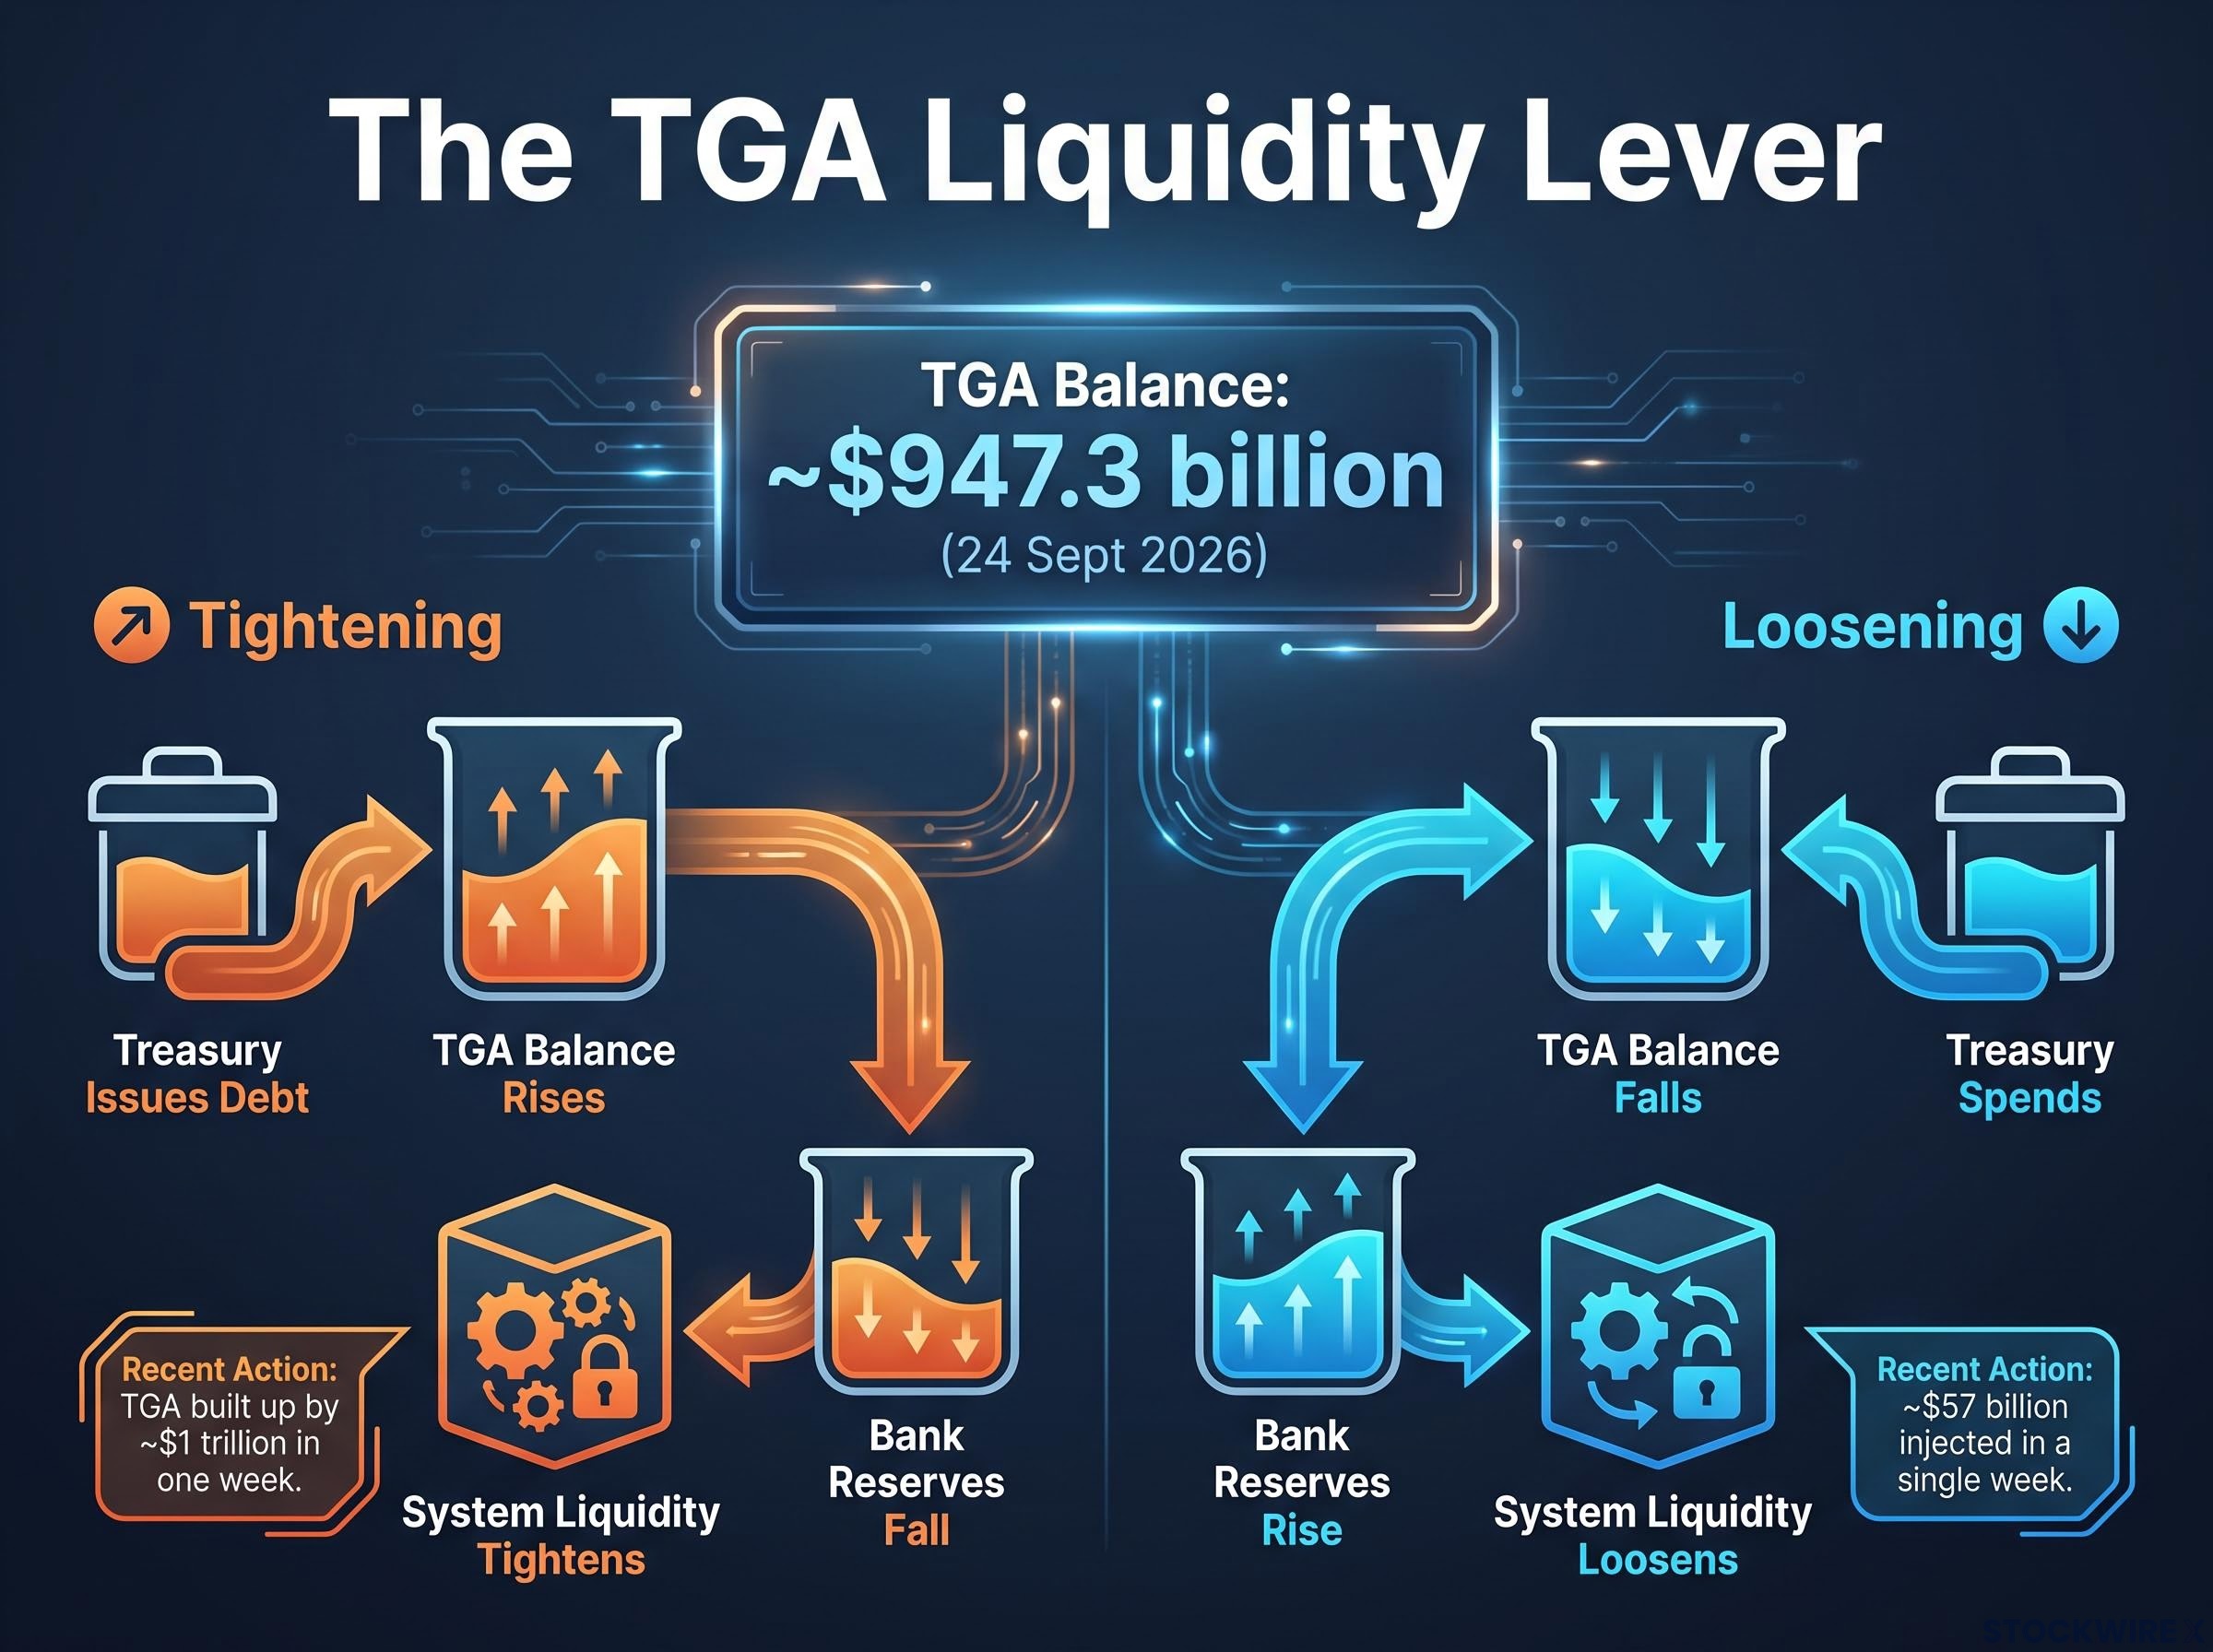
The Treasury General Account (TGA) is the US government’s operating bank account, held at the Federal Reserve. When the Treasury issues debt and takes in the proceeds, the TGA balance rises. When the Treasury spends on benefits, contracts, and grants, the balance falls and the money flows into the banking system as reserves.
Those swings are not trivial. Every large movement in the TGA directly changes bank reserves and short-term money markets, which means Treasury’s cash management decisions ripple straight into liquidity conditions.
The Federal Reserve analysis of TGA fluctuations confirms that large swings in the account directly affect the supply of bank reserves, creating monetary impulses that operate independently of the Fed’s stated policy rate decisions.
| Scenario | Effect on TGA balance | Effect on bank reserves | Effect on system liquidity |
|---|---|---|---|
| Treasury issues debt | Rises | Falls | Tightens |
| Treasury spends | Falls | Rises | Loosens |
| Large TGA drawdown | Falls sharply | Rises sharply | Loosens sharply |
The current scale is striking. As of 24 September 2026, the Federal Reserve’s weekly H.4.1 release reported the TGA balance at approximately $947.3 billion. That is a liquidity reservoir roughly the size of the entire Netherlands economy, one that can be deployed into or withdrawn from the financial system on a weekly basis, sitting outside the Fed’s official policy decisions and largely outside public view.
The movements are real and recent. According to the original source analysis, the Treasury injected roughly $57 billion into the financial system in a single week through the TGA. The prior week, the TGA balance had built up by about $1 trillion while bank reserves declined at the same time.
For you as a saver or investor, the takeaway is this. The effective monetary stance of the US government cannot be read from the Fed’s stated policy rate alone. Tracking TGA movements adds a second dimension to judging real liquidity conditions, and by extension the true trajectory of inflation and asset prices.
Why TGA swings complicate the Fed’s inflation-fighting narrative
Here is where an institutional tension opens up. Suppose the Fed is publicly raising rates to fight inflation, projecting discipline. At the same time, the Treasury draws down the TGA and injects liquidity into the system.
The net effect on monetary conditions becomes ambiguous. The public-facing story of a hawkish, inflation-fighting Fed may not capture the full picture, because a loosening channel is operating in parallel.
Officials at a Federal Reserve Bank of New York conference discussed the outer edge of this dynamic: the possibility of the Treasury lending surplus cash into overnight lending markets, the same channels commercial banks use for short-term funding. Such an arrangement would allow monetary loosening without any formal Fed action at all.
Opinions on whether this is a problem split three ways. Critics see it as blurring the line between fiscal and monetary policy. Defenders argue the Fed’s toolkit, including interest on reserves and reverse repos, is enough to neutralise TGA-driven swings. The more assertive framing, put forward in the original source, holds that the Treasury has effectively assumed a central-bank-like role in certain periods.
What the historical record says about who wins and who loses over decades
None of this is theoretical. The pattern has played out repeatedly, and each episode names the same winner and the same loser.
Start with the post-war United States. Debt-to-GDP peaked near 100%, and over the following decades it fell dramatically. Reinhart and Rogoff document how that reduction came not from default but from a blend of growth, moderate inflation, and capped nominal yields. Savers holding Treasury bonds and bank deposits earned returns below inflation and absorbed the real cost of shrinking the national debt.
The 1970s show what happens when inflation runs hotter than the managed variety. CPI reached high single digits and, at times, double digits. Holders of fixed-rate bonds and savings accounts suffered severe real losses, while borrowers with fixed-rate mortgages came out ahead, repaying loans in dollars worth far less. Retirees on unindexed pensions saw their real living standards fall sharply.
| Precedent | Debt context | Mechanism used | Savers’ outcome | Government debt outcome |
|---|---|---|---|---|
| US post-WWII | ~100% debt-to-GDP | Inflation, growth, capped yields | Negative real returns | Fell sharply, no default |
| US 1970s | High nominal debt | High inflation | Severe real losses | Real burden eroded |
| UK post-WWII | Very high war debt | Financial repression | Negative real returns | Debt-to-GDP declined |
The United Kingdom followed the same route after the war, keeping bond yields low while permitting positive inflation, delivering real losses to domestic savers and pension funds. And at the extreme end, several Latin American episodes, in Brazil and Argentina at various points, saw uncontrolled inflation wipe out domestic savers’ real wealth almost entirely while governments stabilised their fiscal positions.
Every episode follows the same distribution. The party that owed money in nominal terms came out ahead in real terms. The party owed the money bore the purchasing-power loss. And in each case, the single largest beneficiary was the sovereign debtor.
Financial repression and inflation have served as the primary tools advanced economies use to reduce sovereign debt without formal default, as documented across decades of historical data by Reinhart and Rogoff.
For you, this record is not backdrop. It is the evidence base for judging whether current US policy is likely to run the same course, and for deciding how much of your long-term savings should sit in nominal dollars at all.
Seeing clearly in a system designed to be opaque
Three layers stack on top of one another here. First, the basic redistribution: inflation moves real value from nominal savers to nominal debtors, automatically. Second, the inequity of who pays: retirees, low-income households, and cash-heavy savers carry more than their share. Third, the TGA, a parallel liquidity lever that deepens the opacity of the government’s true monetary stance.
The August 2026 headline rate of 3.4% is the current operating speed of the mechanism. The $947.3 billion TGA balance is standing proof that the government’s toolkit reaches well beyond its stated policy rate. And the 2,200% cumulative figure since 1940 is the long-run evidence of the scale involved.
The practical implications come down to three:
- Check whether your savings vehicles are nominal or inflation-linked, because that single distinction decides which side of the transfer you sit on.
- Understand the gap between headline CPI and your personal effective inflation, especially if you are a senior facing heavy healthcare and housing costs.
- Factor TGA dynamics into any read of the Fed’s real monetary stance, rather than trusting the policy rate alone.
There is a fair counterargument worth keeping. When inflation is predictable and moderate, much of it is already priced into contracts and yields, which limits the redistribution. Yet for savers concentrated in cash, CDs, and fixed pensions, the mechanism operates whether or not anyone chooses to call it a wealth transfer.
Moderate inflation combined with low real rates reduces the real value of public debt, and the party on the other side of that transaction is every saver holding a nominal claim. This is the logic Olivier Blanchard has laid out repeatedly.
If you finish this still treating a savings account as the safe option, the central point has slipped past. Safety here is nominal, not real, and the government has an 80-year track record of ensuring nominal savings erode in its favour.
For investors ready to move beyond identifying the problem and into constructing a response, our full explainer on building an inflation hedge portfolio covers the layered asset allocation approach that competes with a 3.4% CPI environment, including specific dividend yield, real asset, and TIPS positioning at current market rates.
This article is for informational purposes only and should not be considered financial advice. Investors should conduct their own research and consult with financial professionals before making investment decisions. Past performance does not guarantee future results, and historical patterns are subject to change based on future economic conditions and policy decisions.