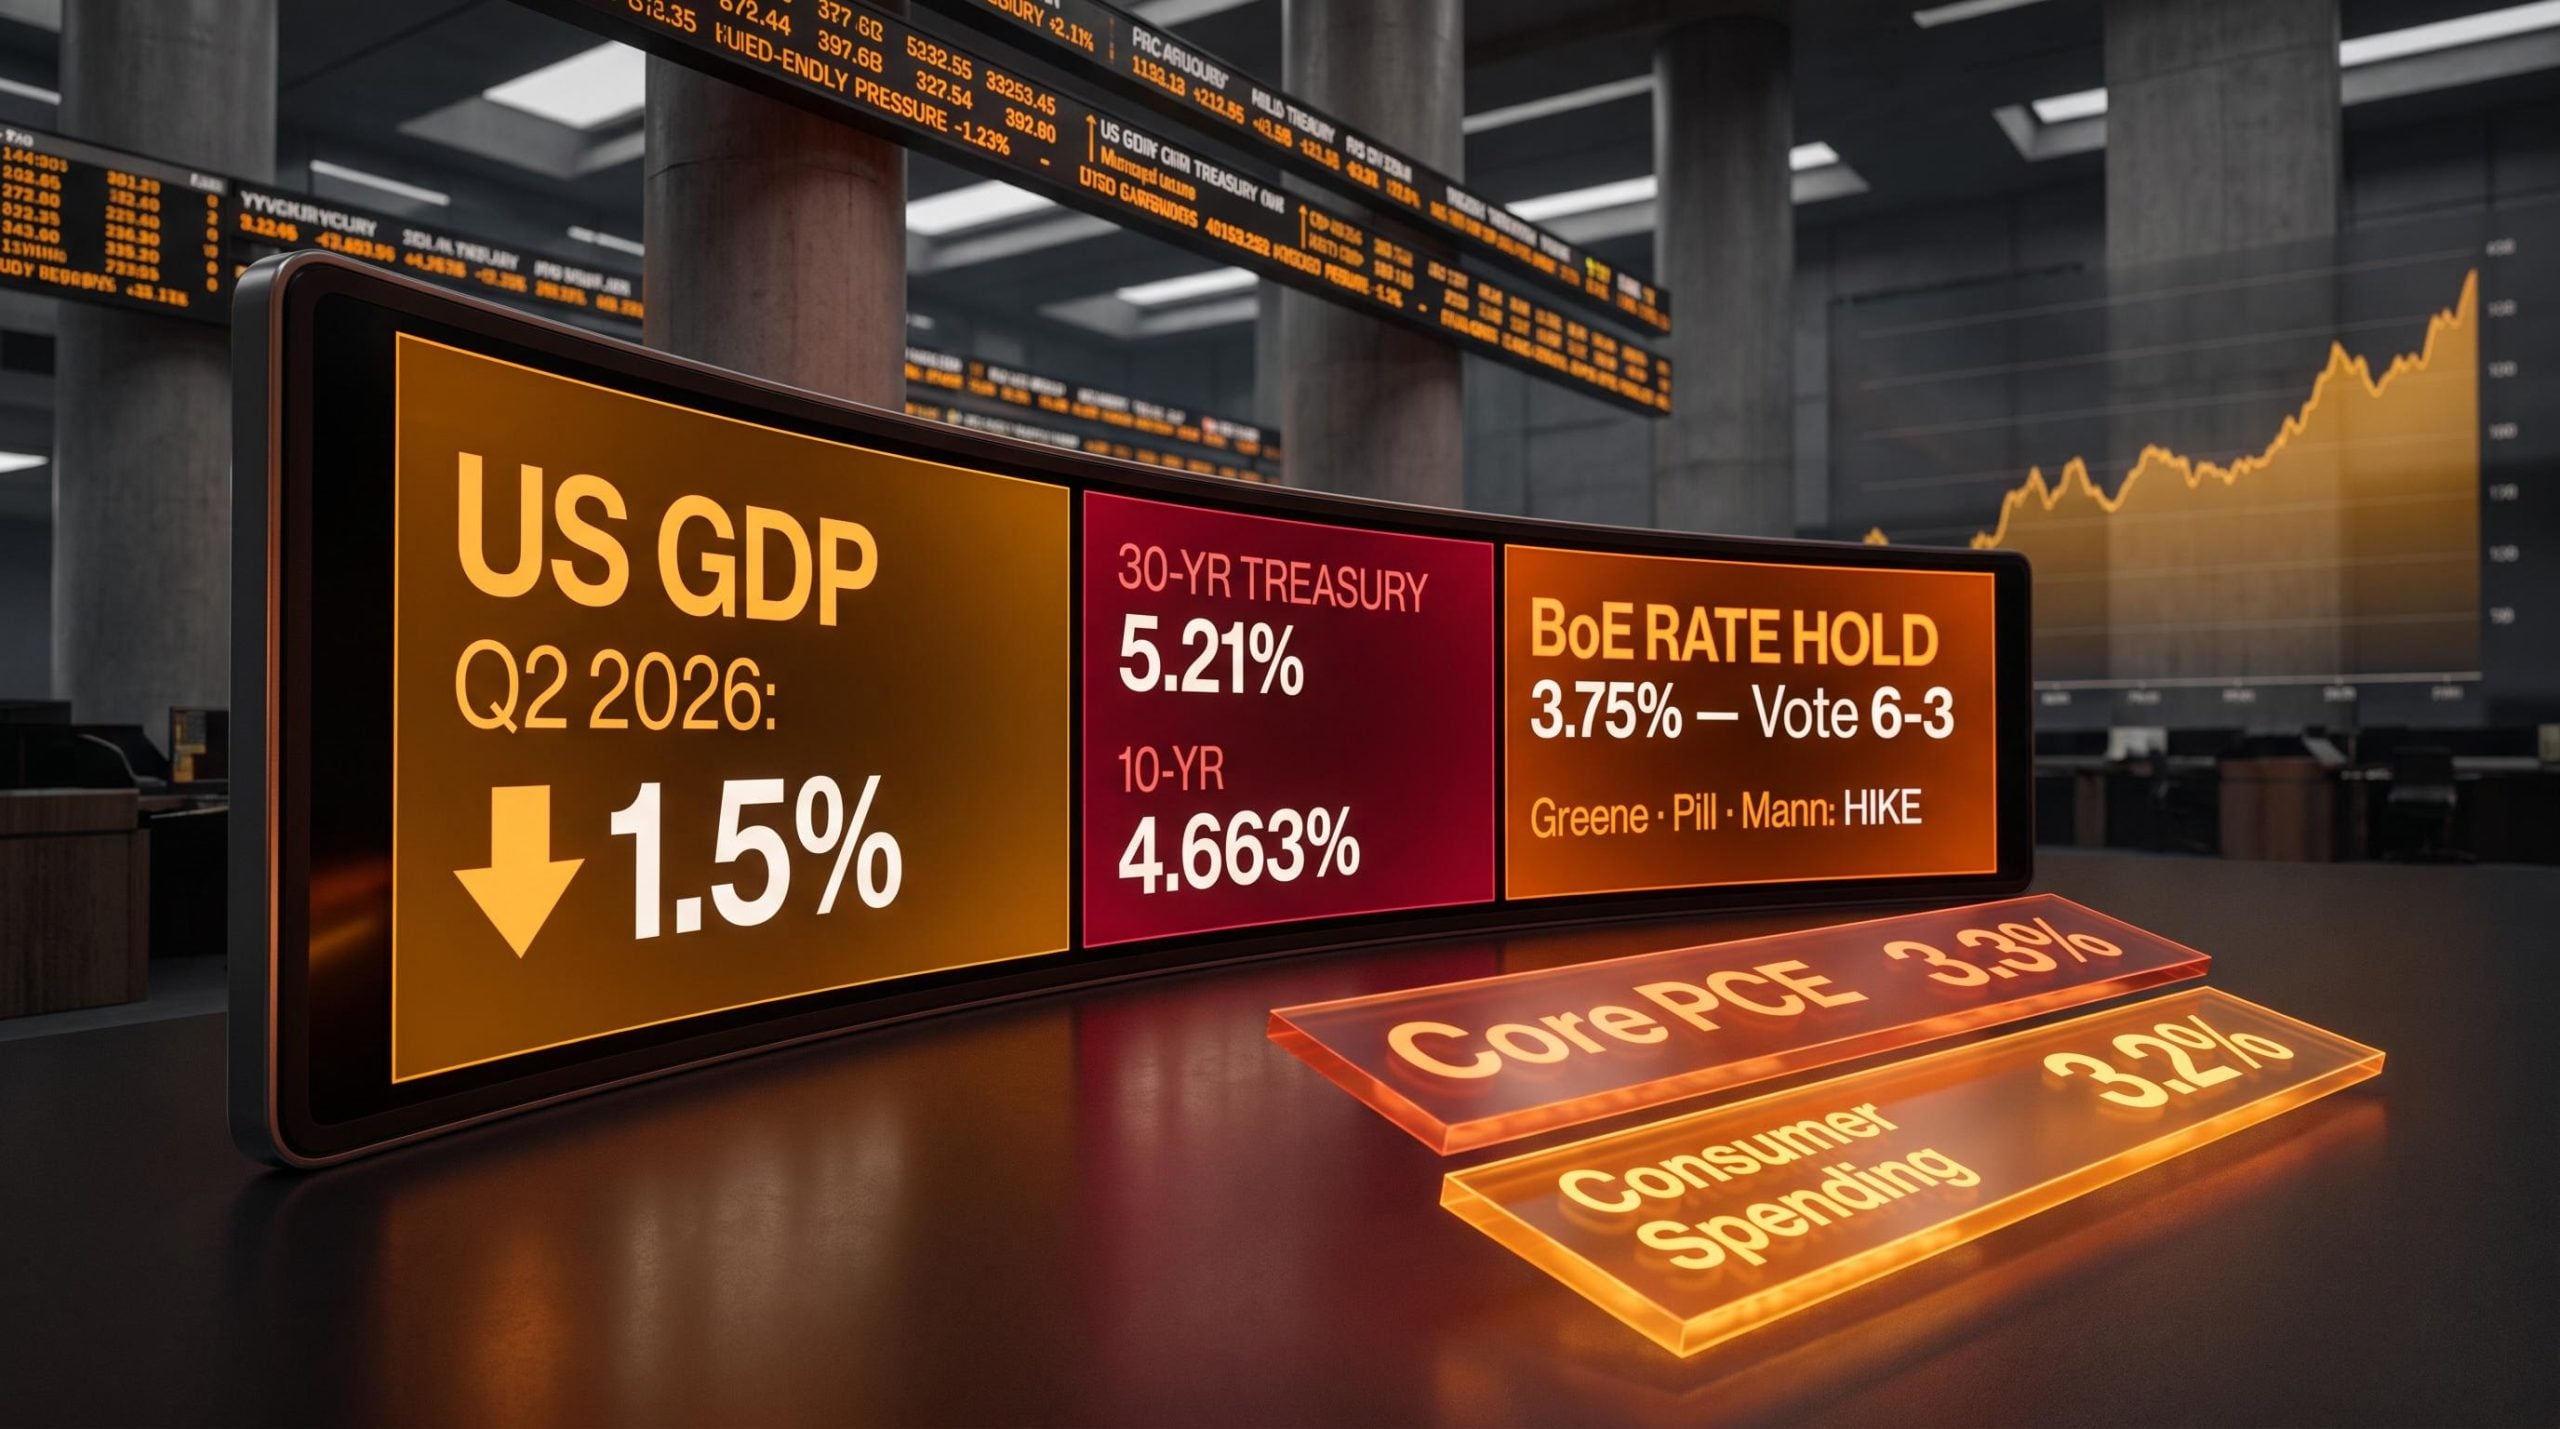
Three major federal programmes, the Infrastructure Investment and Jobs Act, the CHIPS Act, and the Inflation Reduction Act, have collectively unlocked more than $500 billion in private-sector manufacturing commitments since their passage. The industrial sector sits directly in the path of that capital. For investors evaluating exposure to infrastructure spending, automation, and the energy transition, the sector rewards careful vehicle selection, honest risk assessment, and an understanding of its cyclical character. As of mid-2026, industrial ETFs such as XLI have delivered roughly 11-12.9% year-to-date returns, making industrials one of the more actively discussed equity allocations of the year. This guide covers what the industrial sector actually includes, which investment vehicles offer the most practical entry points, what the real risks are, and why the long-term structural growth case for industrial sector investing remains intact.
What the industrial sector actually covers (and why it matters to investors)
The industrial sector is broader than most investors assume. It extends well beyond factories and heavy machinery into construction, transportation, aerospace and defence, and specialised engineering services. Together, these sub-segments produce the goods and infrastructure that virtually every other part of the economy depends on.
The five main sub-segments, along with representative publicly traded companies, include:
- Manufacturing: Production of machinery, equipment, and industrial goods. Representative company: Caterpillar (CAT).
- Aerospace and defence: Commercial aviation, military systems, and engine manufacturing. Representative company: GE Aerospace.
- Construction: Residential, commercial, and public infrastructure building. The U.S. construction industry is projected to grow approximately 4% in real terms for 2025, supported by federal investment.
- Clean-energy infrastructure: Grid modernisation, renewables, and energy storage. Representative company: GE Vernova (GEV).
- Engineering services: Large-scale project design, procurement, and construction management. Representative company: Fluor Corporation (FLR).
Investors who underestimate this breadth often misprice their exposure. A position in a broad industrial ETF is not simply a bet on manufacturing; it is a position across transportation logistics, defence contracting, power generation, and construction activity simultaneously.
The cyclical engine: how the economy drives industrial returns
The industrial sector’s performance is closely tied to the broader economic cycle. During expansions, rising business confidence and capital expenditure drive demand for equipment, infrastructure, and services across the sector. During contractions, those same spending decisions get delayed or cancelled.
Interest rates are the primary transmission mechanism. Because the sector is capital-intensive, tightening credit conditions compress margins and push back large equipment and infrastructure purchases. Commodity pricing and consumer confidence add secondary pressure. This cyclicality is the defining structural feature investors must account for before allocating capital to any industrial vehicle.
When big ASX news breaks, our subscribers know first
Choosing your entry point: ETFs, equities, and bonds compared
Three primary vehicle types are available to U.S. investors seeking industrial exposure, ranging from broadest to most concentrated:
- Sector ETFs: The most accessible entry point, offering built-in diversification across sub-sectors and reducing single-company concentration risk. Low minimum investment and high liquidity make ETFs suitable for most portfolio sizes.
- Individual equities: The most targeted approach, allowing investors to concentrate on specific sub-segments (such as clean energy or aerospace). This requires analysis of company fundamentals, order-book visibility, and sensitivity to sub-segment-specific macroeconomic variables.
- Bonds: For income-oriented or defensive positioning within the sector, industrial corporate bonds offer exposure with a different risk and return profile than equities.
The concentration risk mechanics that distinguish a single-stock position from a broad ETF holding are illustrated clearly by recent single-stock drawdowns: a 68.9% decline in a 1% ETF position produces only a 0.69% portfolio drag, while the same decline in a concentrated holding eliminates most of the capital allocated to it.
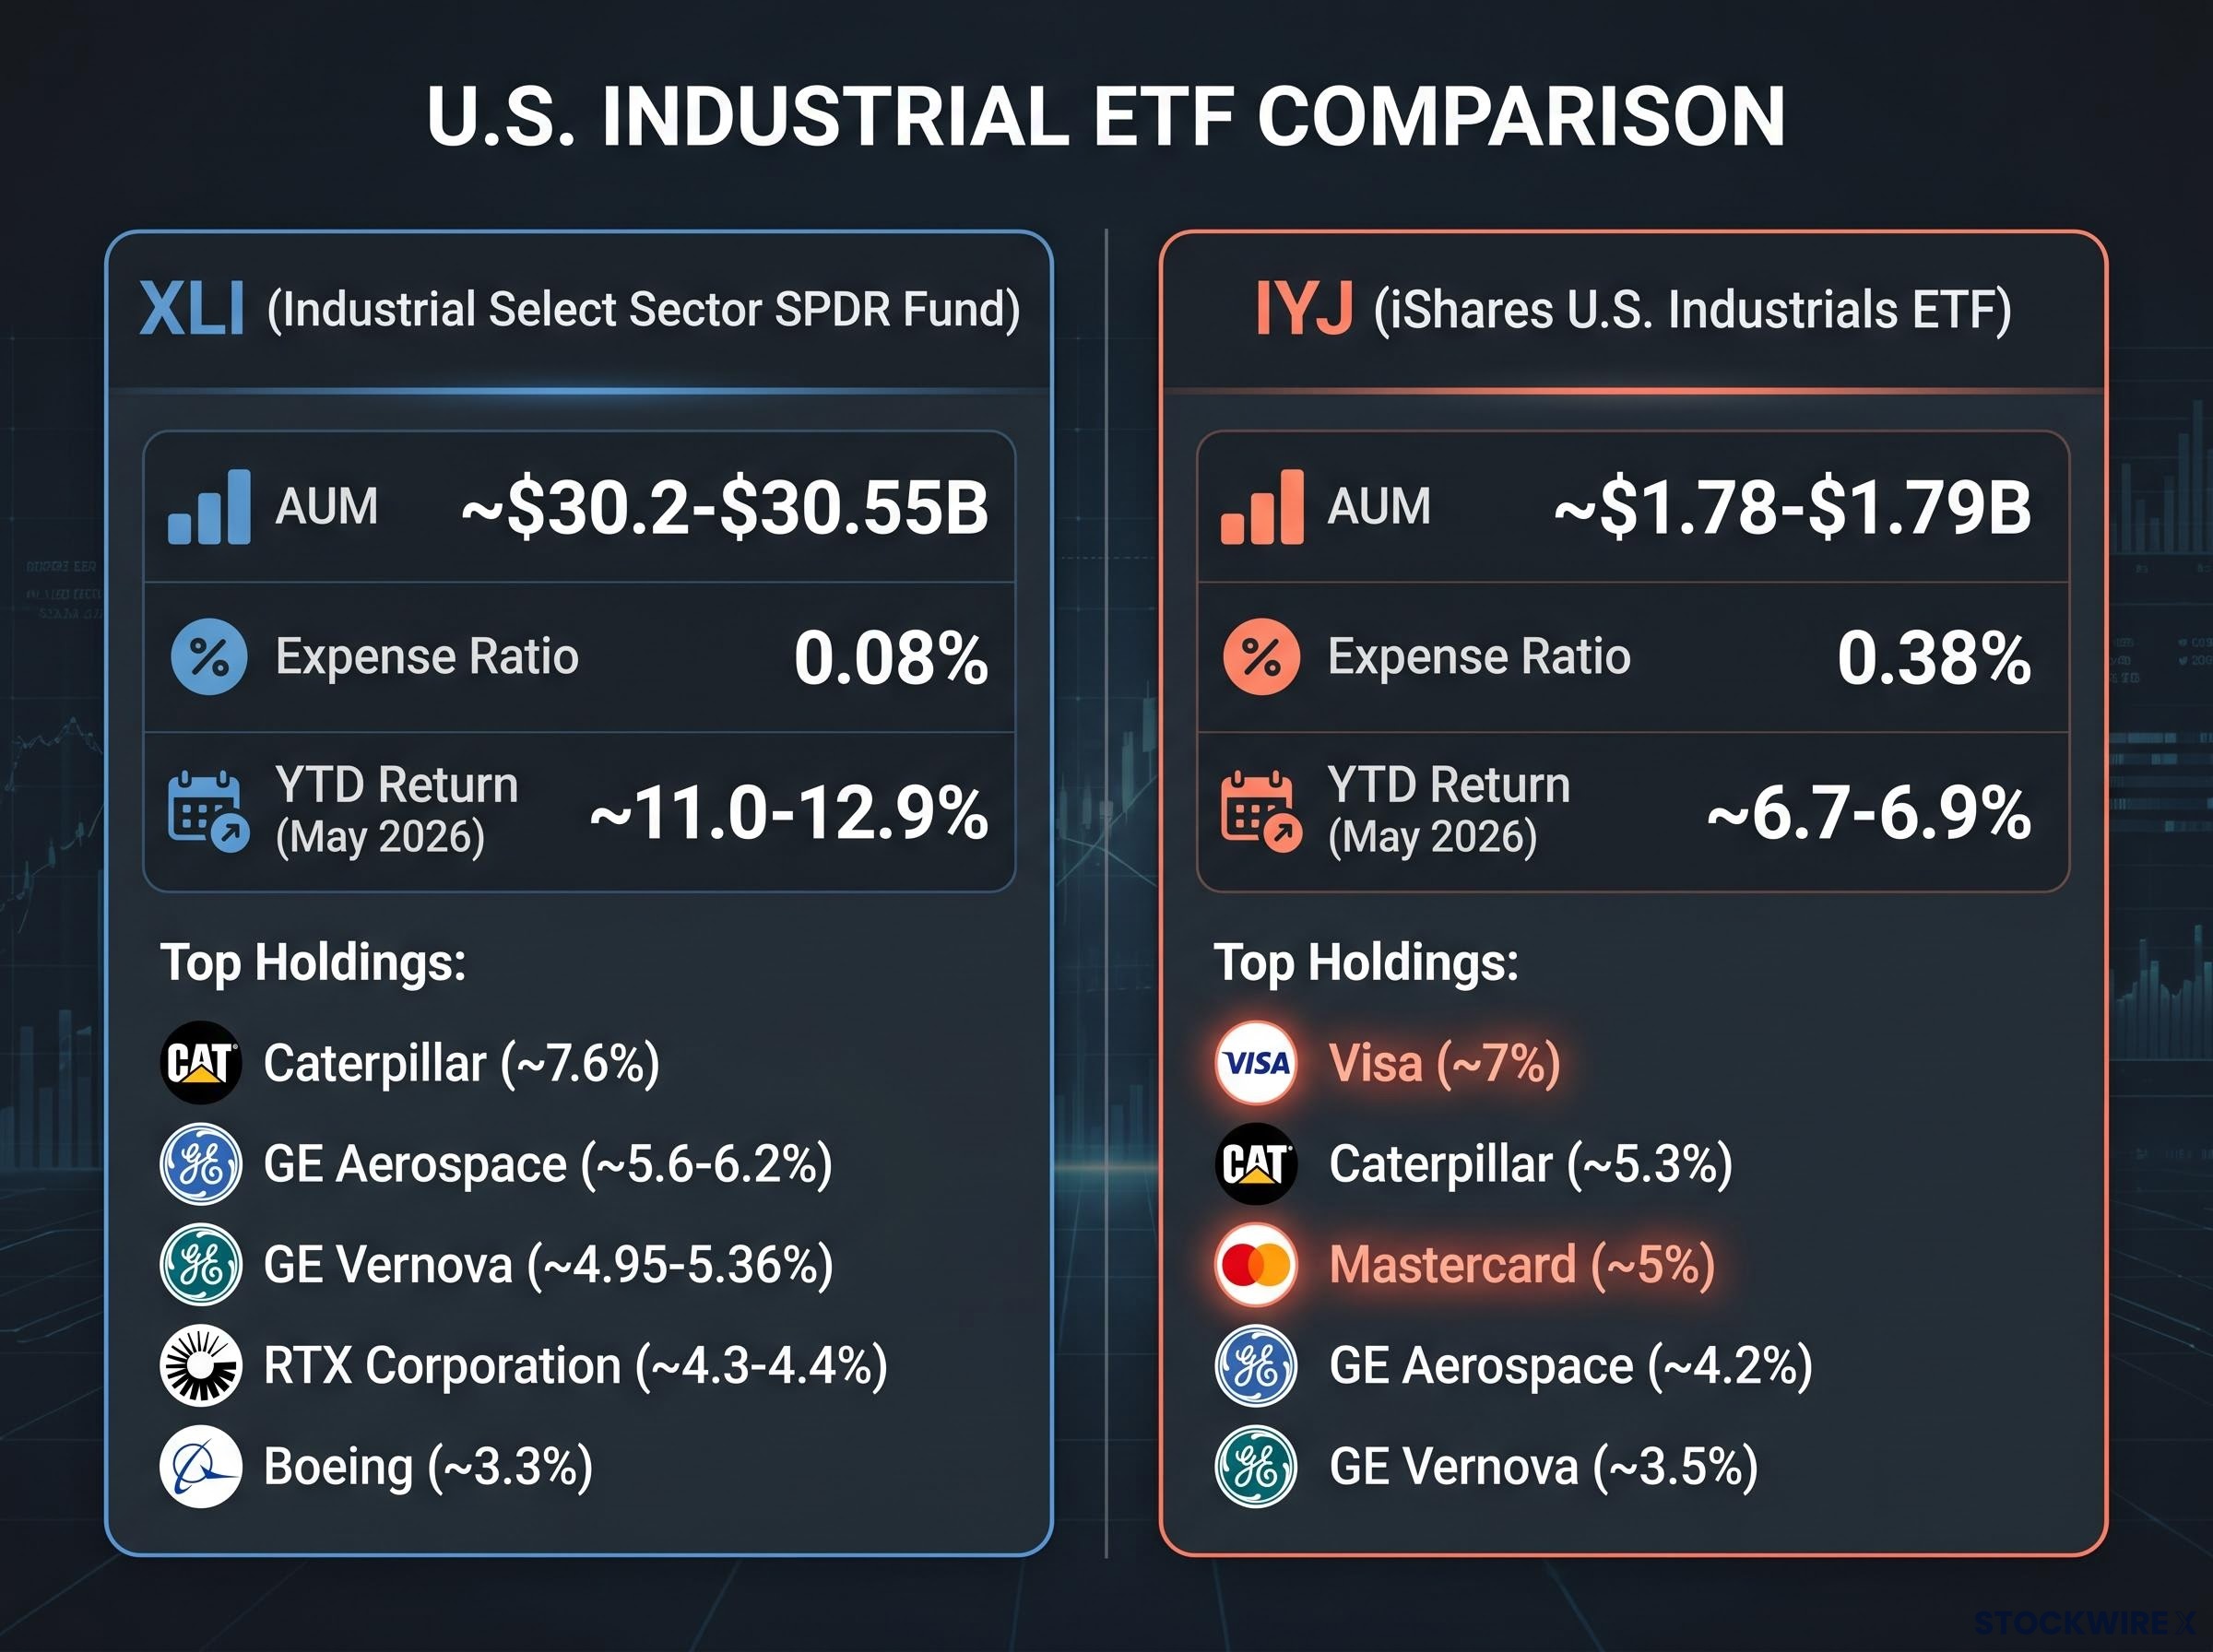
The two most widely held U.S. industrial ETFs illustrate how vehicle selection shapes actual risk exposure:
| Fund | AUM | Expense Ratio | YTD Return (May 2026) | Notable Characteristic |
|---|---|---|---|---|
| XLI | ~$30.2-$30.55B | 0.08% | ~11.0-12.9% | Largest, most liquid U.S. industrial ETF; pure industrial holdings |
| IYJ | ~$1.78-$1.79B | 0.38% | ~6.7-6.9% | Broader index methodology; includes non-industrial top holdings |
XLI’s top holdings reflect a straightforward industrial composition: Caterpillar at approximately 7.6%, GE Aerospace at approximately 5.6-6.2%, GE Vernova at approximately 4.95-5.36%, RTX Corporation at approximately 4.3-4.4%, and Boeing at approximately 3.3%.
IYJ’s top holdings tell a different story: Visa at approximately 7%, Caterpillar at approximately 5.3%, Mastercard at approximately 5%, GE Aerospace at approximately 4.2%, and GE Vernova at approximately 3.5%.
Index construction matters. IYJ’s inclusion of Visa and Mastercard as top holdings reflects its benchmark’s classification methodology, not the operating nature of those businesses. Investors who assume two funds labelled “industrial” offer comparable exposure may find themselves holding meaningful financial-sector weight without realising it. Always review the index methodology document alongside the fund fact sheet.
Understanding how industrial ETF indexes are built
Different ETFs tracking “the industrial sector” may use different index methodologies, producing materially different holdings. XLI tracks the Industrial Select Sector Index, which excludes financial services companies entirely. IYJ tracks the Russell 1000 Industrials 40 Act 15/22.5 Daily Capped Index, whose classification methodology captures companies like Visa and Mastercard.
The practical implication is straightforward: review the index methodology document alongside the fund fact sheet before assuming two industrial ETFs offer comparable exposure.
FINRA’s ETF investor guidance outlines the specific documents investors should review before committing capital to any fund, including the prospectus, fund fact sheet, and the underlying index methodology, each of which can reveal material differences between funds that share a sector label.
The risks every industrial sector investor needs to price in
The industrial sector’s risks are real, structurally embedded, and best understood as a hierarchy rather than a flat list. From most to least structurally severe:
- Cyclicality: The primary structural risk. A recessionary environment or significant credit tightening would be expected to compress industrial earnings and ETF returns across the board. The sector’s tight correlation with the economic cycle means that the same expansion tailwinds that drive returns can reverse sharply.
- Tariff and trade exposure: The most immediately relevant situational risk as of mid-2026. Steel and aluminium input costs and export competitiveness for U.S. industrial firms are directly affected by trade policy, particularly involving China and other major trading partners.
- Supply-chain disruption: Production and delivery timelines for manufacturers and contractors remain vulnerable to logistics bottlenecks, component shortages, and shipping disruptions.
- Labour-market pressure: Wage inflation and skilled-worker shortages are particularly relevant for capital-intensive manufacturers and large-scale construction contractors. These pressures can compress margins even when top-line demand is strong.
- Geopolitical risk: U.S.-China frictions, the ongoing conflict in Ukraine, and Middle East tensions affect defence spending priorities, energy markets, and global industrial demand. While generally considered less severe than cyclical risk, geopolitical developments can shift sector dynamics with limited warning.
Tariff and trade policy has moved from a background variable to a direct margin driver for U.S. industrial firms in 2026, with the average U.S. tariff rate now at approximately 9.6%, the highest level in roughly 80 years, and steel and aluminium input cost increases flowing through to manufacturers and contractors whose order books were priced under different assumptions.
Investors who map this hierarchy before allocating are better positioned to size their exposure appropriately and avoid being caught off-guard by a contraction cycle.
How to manage industrial sector risk through diversification
Spreading exposure across manufacturing, construction, aerospace, and clean-energy sub-segments reduces the impact of a downturn in any single area. A broad ETF like XLI provides this diversification by default.
Geographic diversification within U.S. industrial holdings adds a further buffer. Companies with significant international revenue streams, such as Caterpillar and GE Aerospace, are less exposed to a purely domestic economic slowdown than firms whose revenue is concentrated in the U.S. market.
The legislative and macroeconomic tailwinds driving long-term demand
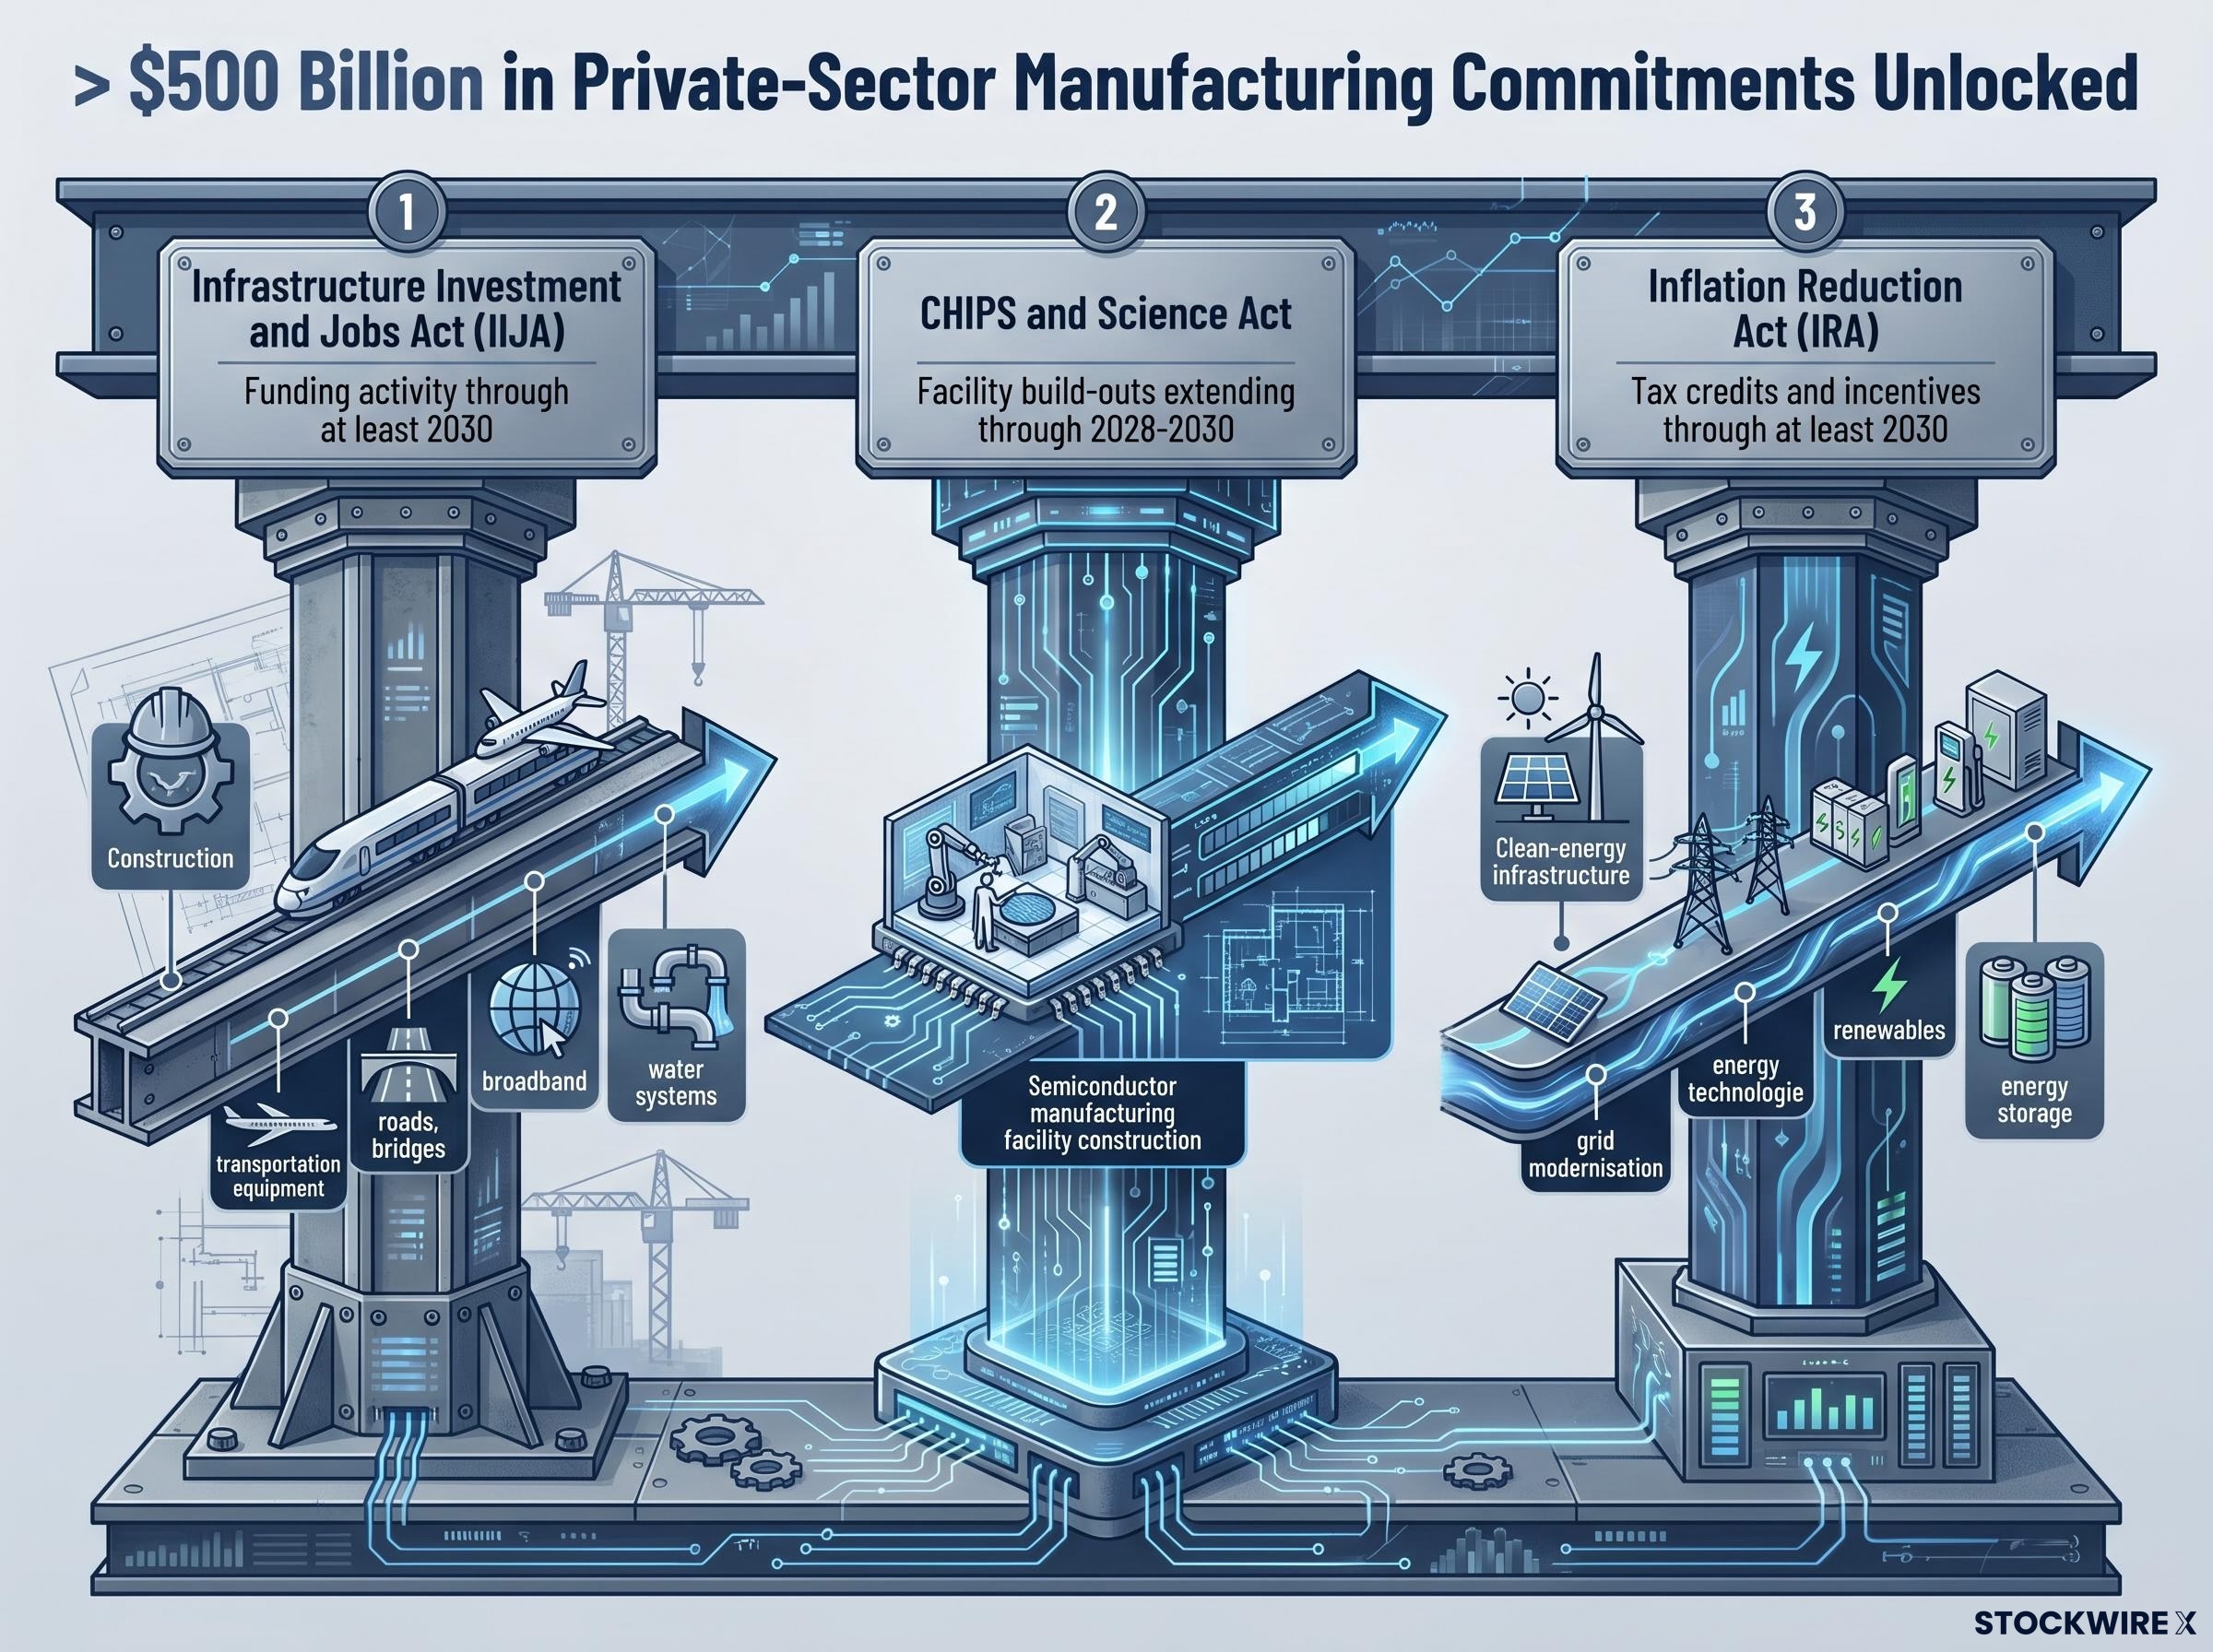
The forward-looking investment case for the industrial sector rests on three named legislative programmes rather than general optimism. Each creates distinct demand channels for industrial goods and services, and each has a multi-year funding horizon that extends well beyond the current economic cycle.
| Legislation | Key Industrial Demand Areas | Timeline |
|---|---|---|
| Infrastructure Investment and Jobs Act (IIJA) | Construction, transportation equipment, roads, bridges, broadband, water systems | Funding activity through at least 2030 |
| CHIPS and Science Act | Semiconductor manufacturing facility construction, domestic capacity expansion | Facility build-outs extending through 2028-2030 |
| Inflation Reduction Act (IRA) | Clean-energy infrastructure, grid modernisation, renewables, energy storage | Tax credits and incentives through at least 2030 |
Announced private-sector commitments under these three acts exceed $500 billion in select manufacturing segments as of mid-2025 to mid-2026, representing one of the largest coordinated industrial investment waves in recent U.S. history.
These programmes connect directly to companies that appear prominently in industrial ETF holdings. GE Vernova benefits from IRA-linked clean-energy infrastructure spending. Fluor Corporation is positioned for IIJA-linked engineering and construction contracts. Construction-adjacent companies benefit from the approximately 4% real-terms growth projected for the U.S. construction industry in 2025, supported by IIJA-linked federal investment.
The legislative demand runway transforms the industrial sector from a purely cyclical play into one with a defined structural demand floor extending to at least 2030.
Automation, Industry 4.0, and the energy transition as multi-decade growth engines
Beyond the near-term legislative tailwinds, three structural forces extend the industrial sector’s growth case across decades rather than funding cycles.
- Industry 4.0 and manufacturing automation: Adoption of artificial intelligence (the use of computer systems to perform tasks that typically require human decision-making), the Internet of Things (networks of physical devices that collect and share data), and advanced robotics is driving manufacturing modernisation. These technologies improve operational efficiency and output, creating demand for both the technology itself and the industrial equipment it upgrades.
- Clean-energy infrastructure build-out: Grid modernisation, renewable energy installations, and energy storage systems all require large-scale manufacturing, construction, and engineering services. This demand flows directly through industrial companies and is supported by sustained IIJA and IRA funding.
- Domestic manufacturing capacity expansion: Reshoring driven by the CHIPS Act and tariff considerations is generating new demand for U.S.-based factory construction, equipment procurement, and engineering services.
Robotics supply-chain dependencies introduce a structural risk layer that automation-focused industrial investors often underestimate: China controls an estimated 93% of the global permanent magnet market and approximately 99% of heavy rare earth element processing, creating concentrated bottlenecks for U.S. hardware manufacturers that cannot be resolved through domestic policy alone on any near-term timeline.
The combination of automation investment and clean-energy infrastructure creates a demand profile that is less cyclically sensitive than traditional industrial demand. It is driven by structural transformation rather than pure capital expenditure cycles, meaning it is more likely to persist through moderate economic slowdowns.
GE Vernova is positioned as a direct beneficiary of both the energy transition and infrastructure spending programmes, which explains its prominence in the top holdings of both XLI and IYJ.
Targeting specific themes with individual stocks versus broad ETFs
Theme-specific plays, such as a pure automation or clean-energy infrastructure company, require individual stock selection and a tolerance for single-company concentration risk. An investor who believes clean-energy infrastructure will outperform the broader industrial sector may prefer a direct position in GE Vernova over a broad ETF allocation.
Broad ETFs like XLI capture these themes implicitly through their holdings but dilute theme-specific upside across the full index. The trade-off is lower concentration risk in exchange for less targeted exposure.
Building a position in industrial sector stocks and funds: a practical starting framework
The analytical case is only useful if it converts into a decision process. The following four-step framework reduces the gap between research and allocation:
- Assess the macro environment and economic cycle position. Determine whether the economy is in an expansion, late-cycle, or contraction phase. The industrial sector tends to outperform in expansions and lag in contractions. Rate decisions from the Federal Reserve are the single most relevant macro input.
- Determine vehicle type based on risk tolerance and research capacity. ETFs suit investors seeking broad, diversified exposure with minimal ongoing research. Individual equities suit investors willing to analyse company fundamentals and accept single-company concentration risk.
- Compare costs and index construction across candidate funds. XLI’s expense ratio of 0.08% is materially lower than IYJ’s 0.38%, a difference that compounds over long holding periods. Index construction determines what the investor actually owns, as the IYJ example demonstrates.
- Establish monitoring inputs and review cadence. The three most relevant ongoing inputs for industrial sector positioning are Federal Reserve rate decisions, IIJA/CHIPS/IRA disbursement timelines, and tariff and trade policy developments. Set a quarterly review schedule aligned with earnings cycles and policy updates.
Earnings season signals from industrial companies carry particular weight as forward-looking macro indicators: cross-sector convergence on the same cost headwind across banks, retailers, and industrials elevates a theme from an isolated data point to actionable economic evidence, often weeks before official GDP data confirms the trend.
Diversification across sub-sectors (manufacturing, construction, aerospace, clean energy) and across companies with international revenue reduces concentration risk and buffers against domestic-only economic downturns.
All ETF data cited in this article, including expense ratios, AUM figures, and holdings, should be verified against the most current fund fact sheets from State Street Global Advisors (XLI) and BlackRock/iShares (IYJ) before any investment decision. Fund data changes frequently.
The industrial sector’s long-term case is structural, not just cyclical
The industrial sector offers a combination that few other equity allocations match: cyclical exposure that rewards patient investors who buy through downturns, layered with structural growth drivers that extend the opportunity beyond any single economic cycle. Automation, the energy transition, and domestic manufacturing expansion are not temporary policy artefacts. They are multi-decade forces reshaping how the U.S. economy produces, builds, and powers itself.
The risks are genuine. Cyclicality, tariff sensitivity, and labour-market pressures are embedded features of the sector, not temporary inconveniences. Informed allocation accounts for these realities rather than ignoring them.
The legislative demand runway, with IIJA, CHIPS Act, and IRA programmes extending to at least 2030 and private-sector commitments exceeding $500 billion, provides a structural demand floor that supports the sector’s forward case. XLI’s year-to-date return of approximately 11-12.9% as of May 2026 reflects the current-year expression of these tailwinds.
The next step is practical: assess the macroeconomic environment, compare available vehicles on cost and composition, and size the position relative to the broader portfolio’s existing cyclical exposure.
This article is for informational purposes only and should not be considered financial advice. Investors should conduct their own research and consult with financial professionals before making investment decisions. Past performance does not guarantee future results. Financial projections are subject to market conditions and various risk factors.