At the exact moment when abandoning a long-term investment plan has cost the most in recorded market history, the available evidence made abandoning it look like the smartest possible decision. That is not a failure of discipline. It is a structural trap, and it catches careful, evidence-driven investors more reliably than reckless ones.
The central paradox is precise: the period of maximum temptation to quit and the period of maximum cost of quitting are the same period. This article uses a specific, quantified case study, two investors who made identical decisions for eight years before one of them stopped, and a breakdown of exit costs across a 25-year timeline to show why this happens and why the reasoning behind the exit feels airtight every time.
After reading, you will be able to recognise the specific configuration of signals that indicates you are in the highest-risk quitting window. More importantly, you will understand why your reasoning at that moment is likely to feel not just defensible but correct, and why that feeling is itself the warning.
The two investors who made identical decisions for eight years
Ryan and Josh both began putting money into the S&P 500 on the same day, investing the same fixed amount into the same fund. For eight years, their investment behaviour was identical in every measurable respect: the same contribution schedule, the same fund performance, and the same portfolio balances at every point along the way.
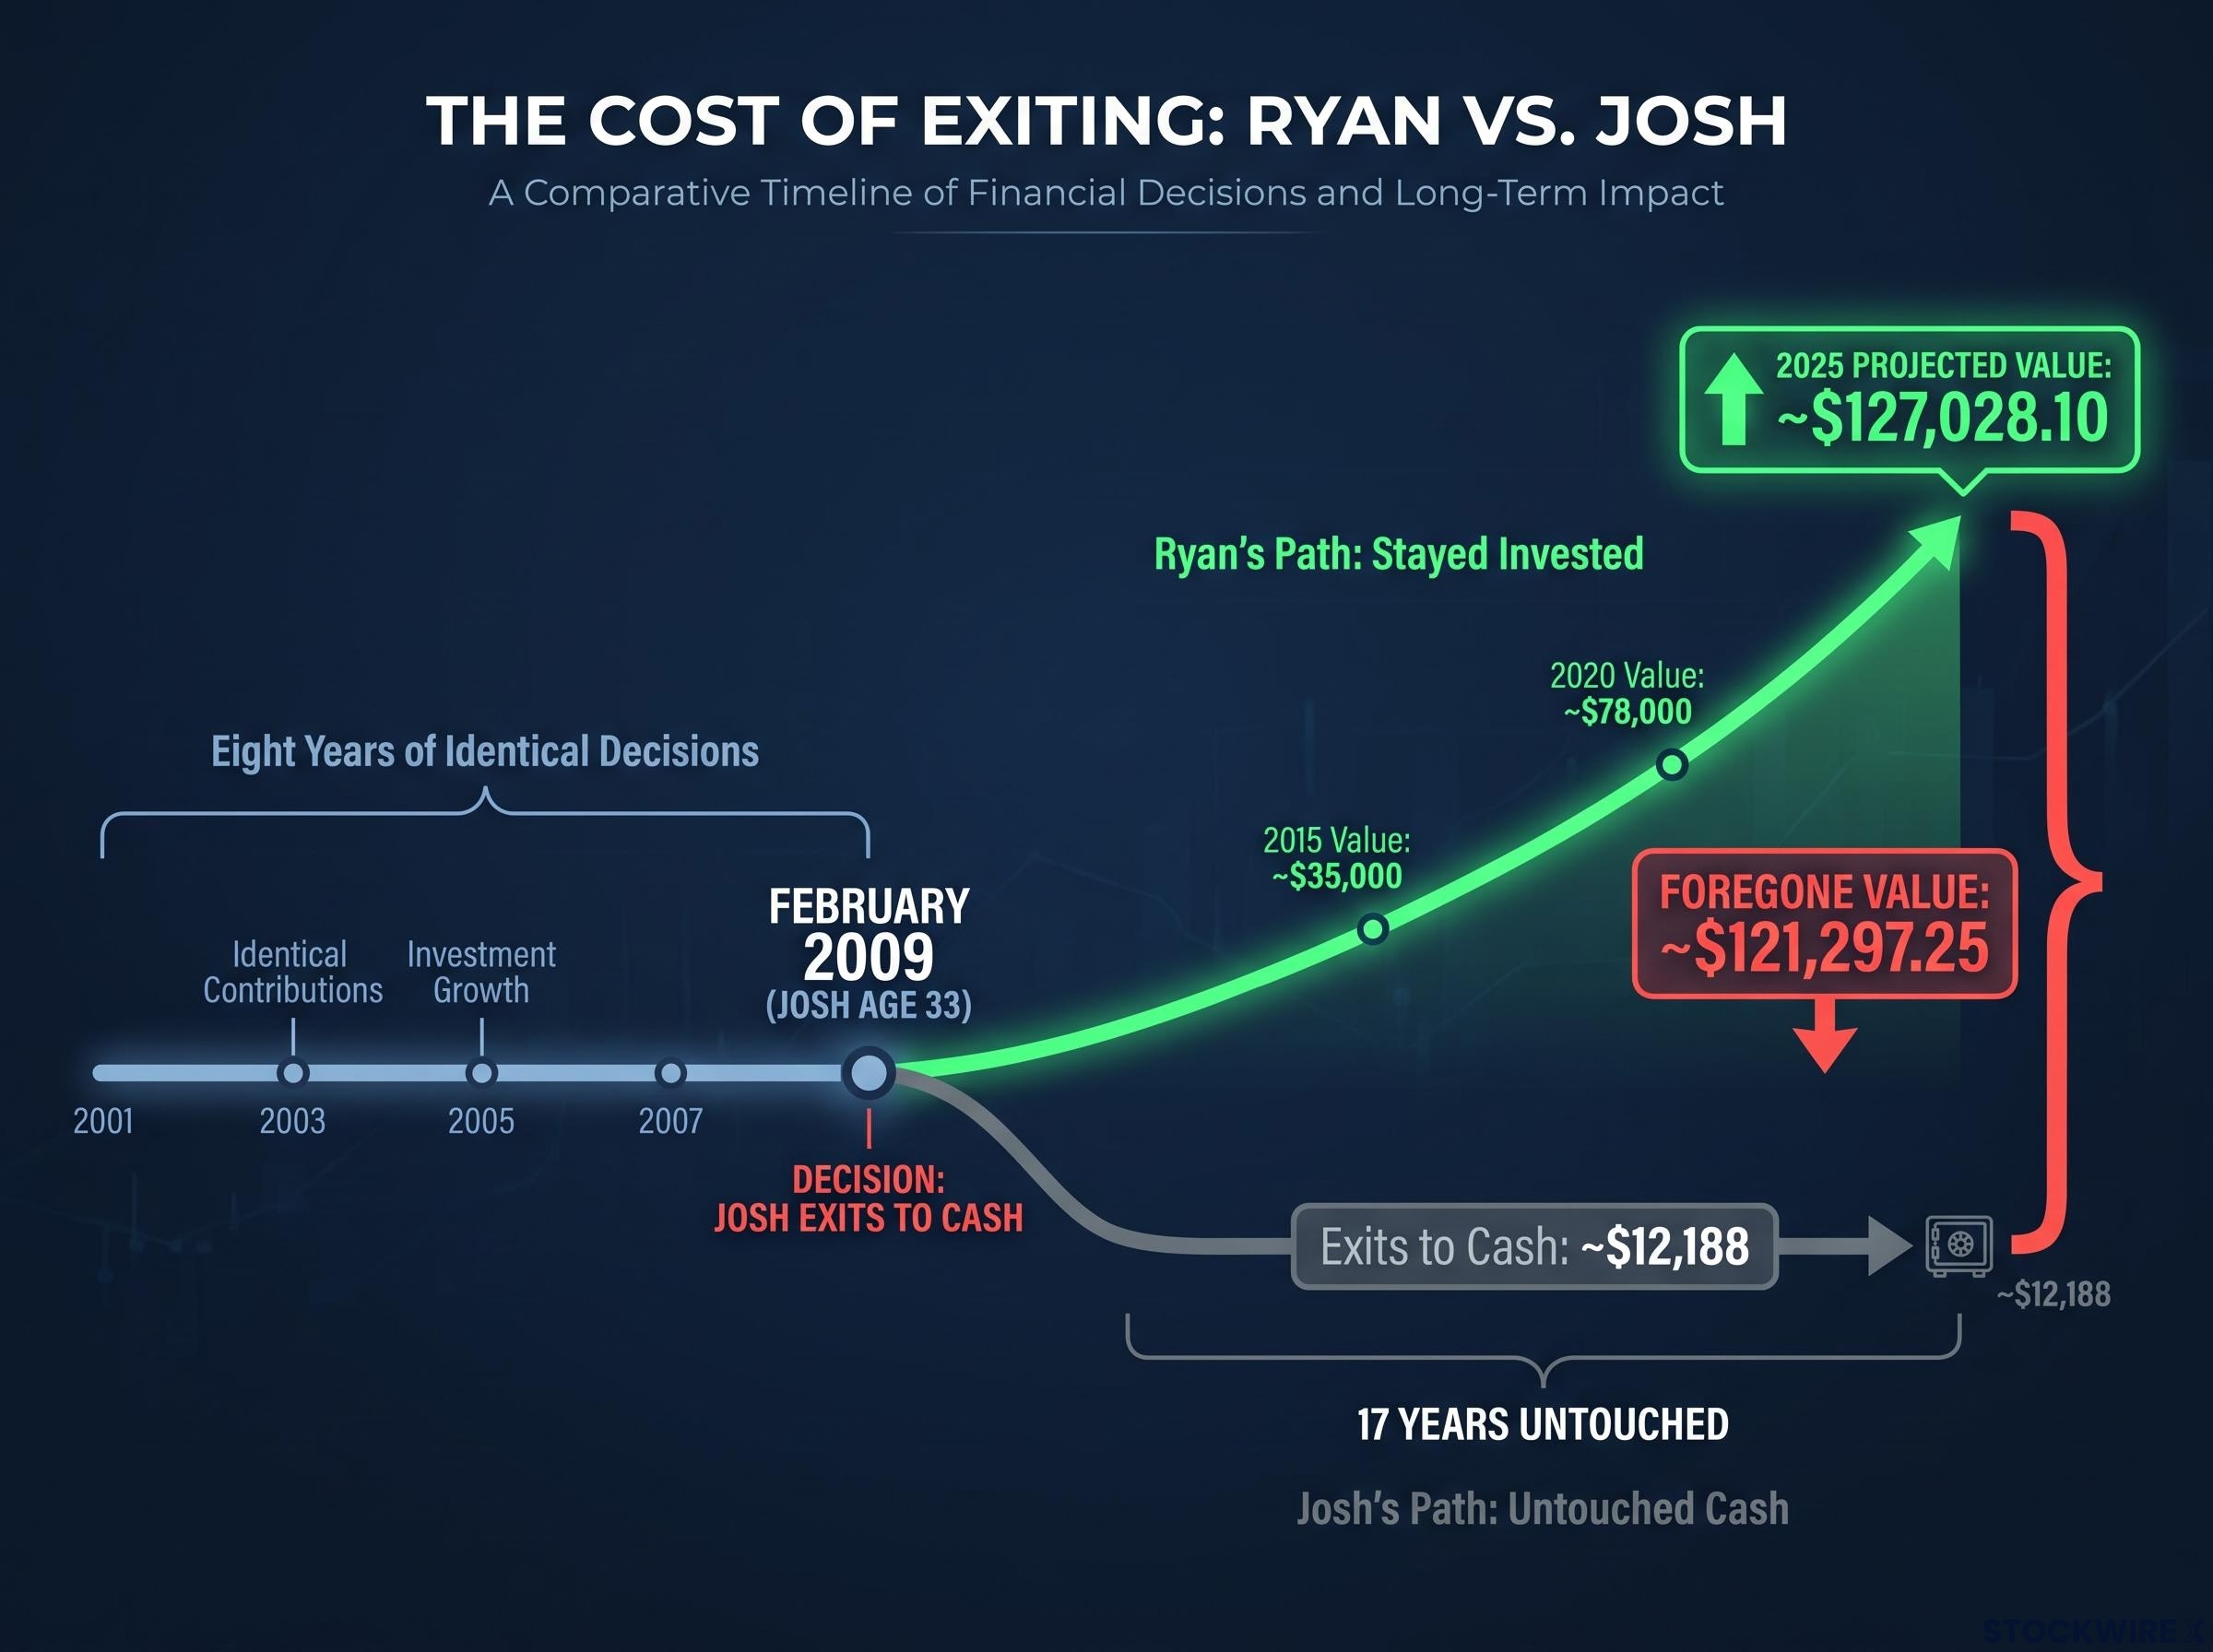
Their paths separated in February 2009, at which point Josh was 33 years old.
Why Josh’s reasoning was not wrong, just incomplete
At the time of his exit, Josh was carrying a mortgage on a property whose value had fallen considerably. His employer had recently announced staff cuts. His family was urging him to shift whatever remained of his portfolio into something more stable. With eight years of market data available to him, much of it showing volatility or outright losses, his portfolio seemed to confirm that the strategy had not delivered.
He converted his investment position into cash, receiving approximately $12,188, which matched Ryan’s 31 December 2008 balance, and he did not return to the market.
Josh’s decision was not panic. It was rational action supported by real evidence, real financial pressure, and real data. That is precisely what made it so expensive.
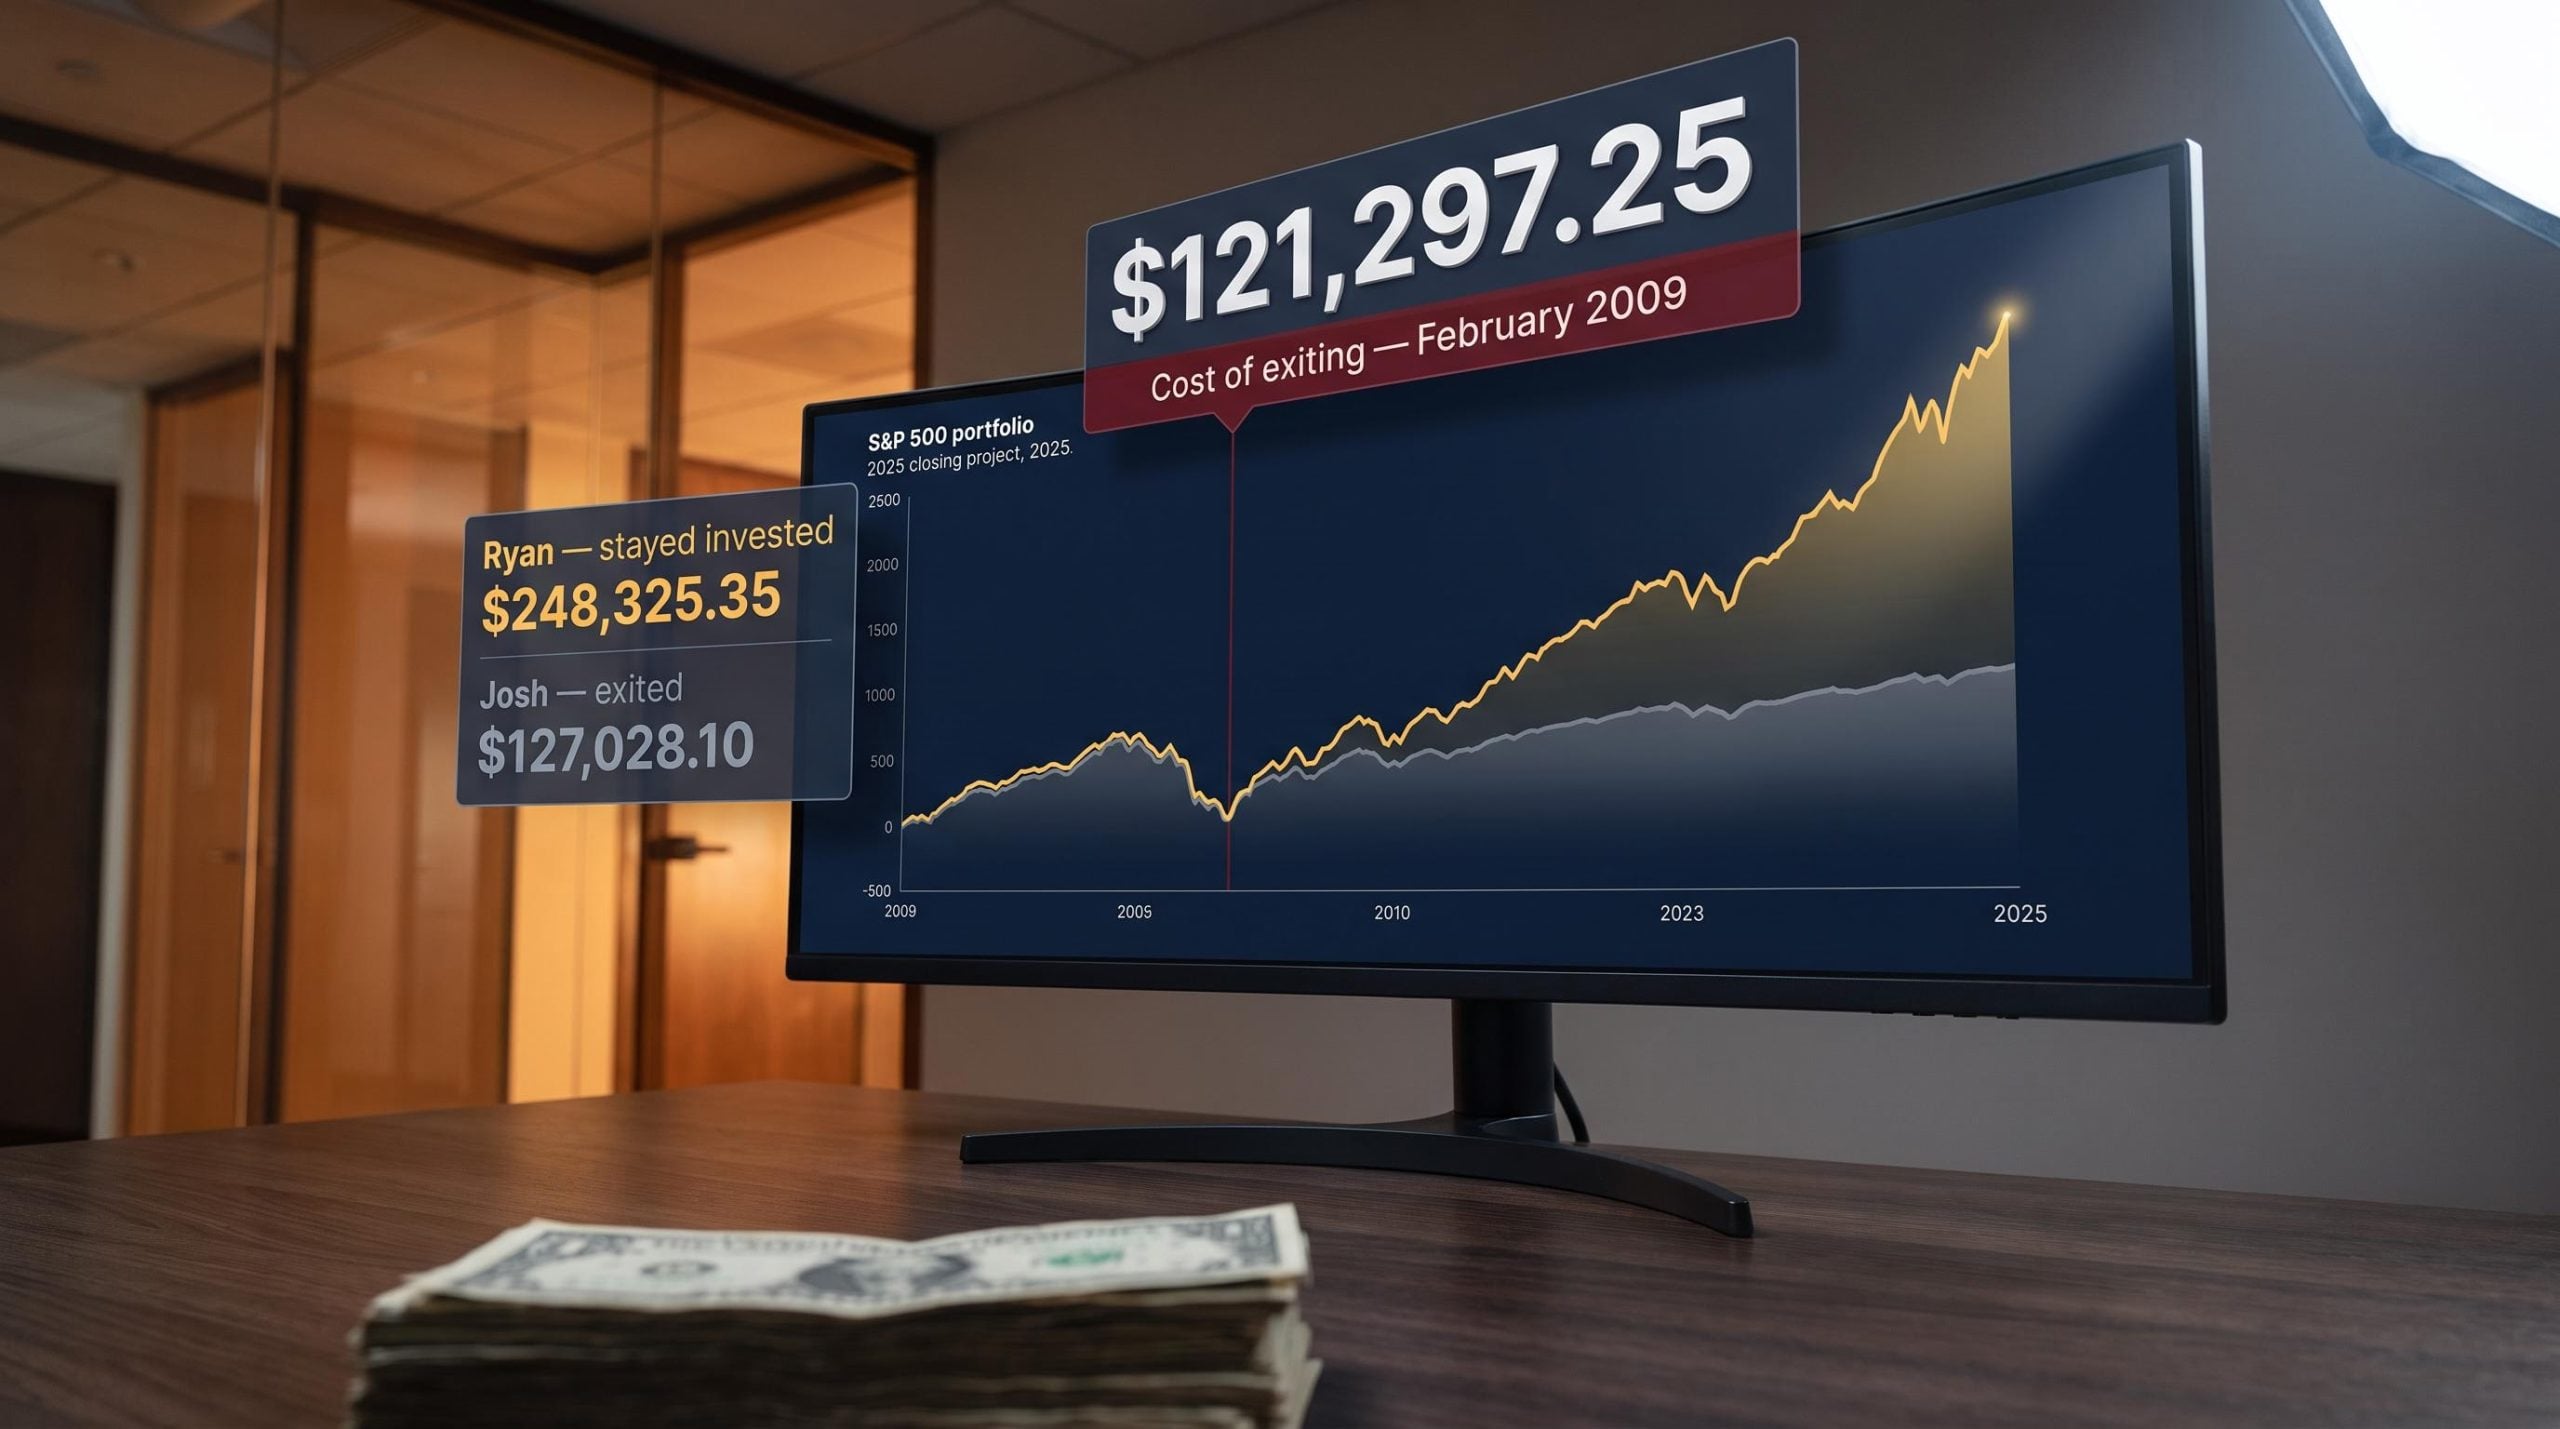
The cash sat untouched for the following 17 years. Over that same period, Ryan’s equivalent balance continued to compound through one of the longest sustained market expansions on record. If Josh had simply held his position through to the end of 2025 without adding another penny, the projected closing value of that balance would have been approximately $127,028.10.
Josh’s exit cost him approximately $121,297.25 in foregone final value: the price of a decision that, at the time, felt like the most responsible one he could make.
That $121,297.25 never appeared on any account statement. The figure existed only as the difference between two diverging timelines, which is precisely why this kind of mistake is so easy to make and so hard to identify while it is happening.
When big ASX news breaks, our subscribers know first
What stopping costs, depending on when you stop
The case study data allows a direct comparison across four exit points spanning the 25-year period. In each scenario, the investor stopped making new contributions but left existing funds invested, the most favourable possible version of quitting.
Looking at the earliest exit point: an investor who stopped at the end of 2002, only two years into the plan, would have seen a portfolio sitting roughly 20% below their total contributions. The dot-com collapse had wiped out nearly a fifth of what they had put in. On two years of evidence, almost all of it negative, the logical case for walking away was entirely defensible.
Halting contributions at that point would have forfeited approximately $212,989.55 in final value by the end of 2025.
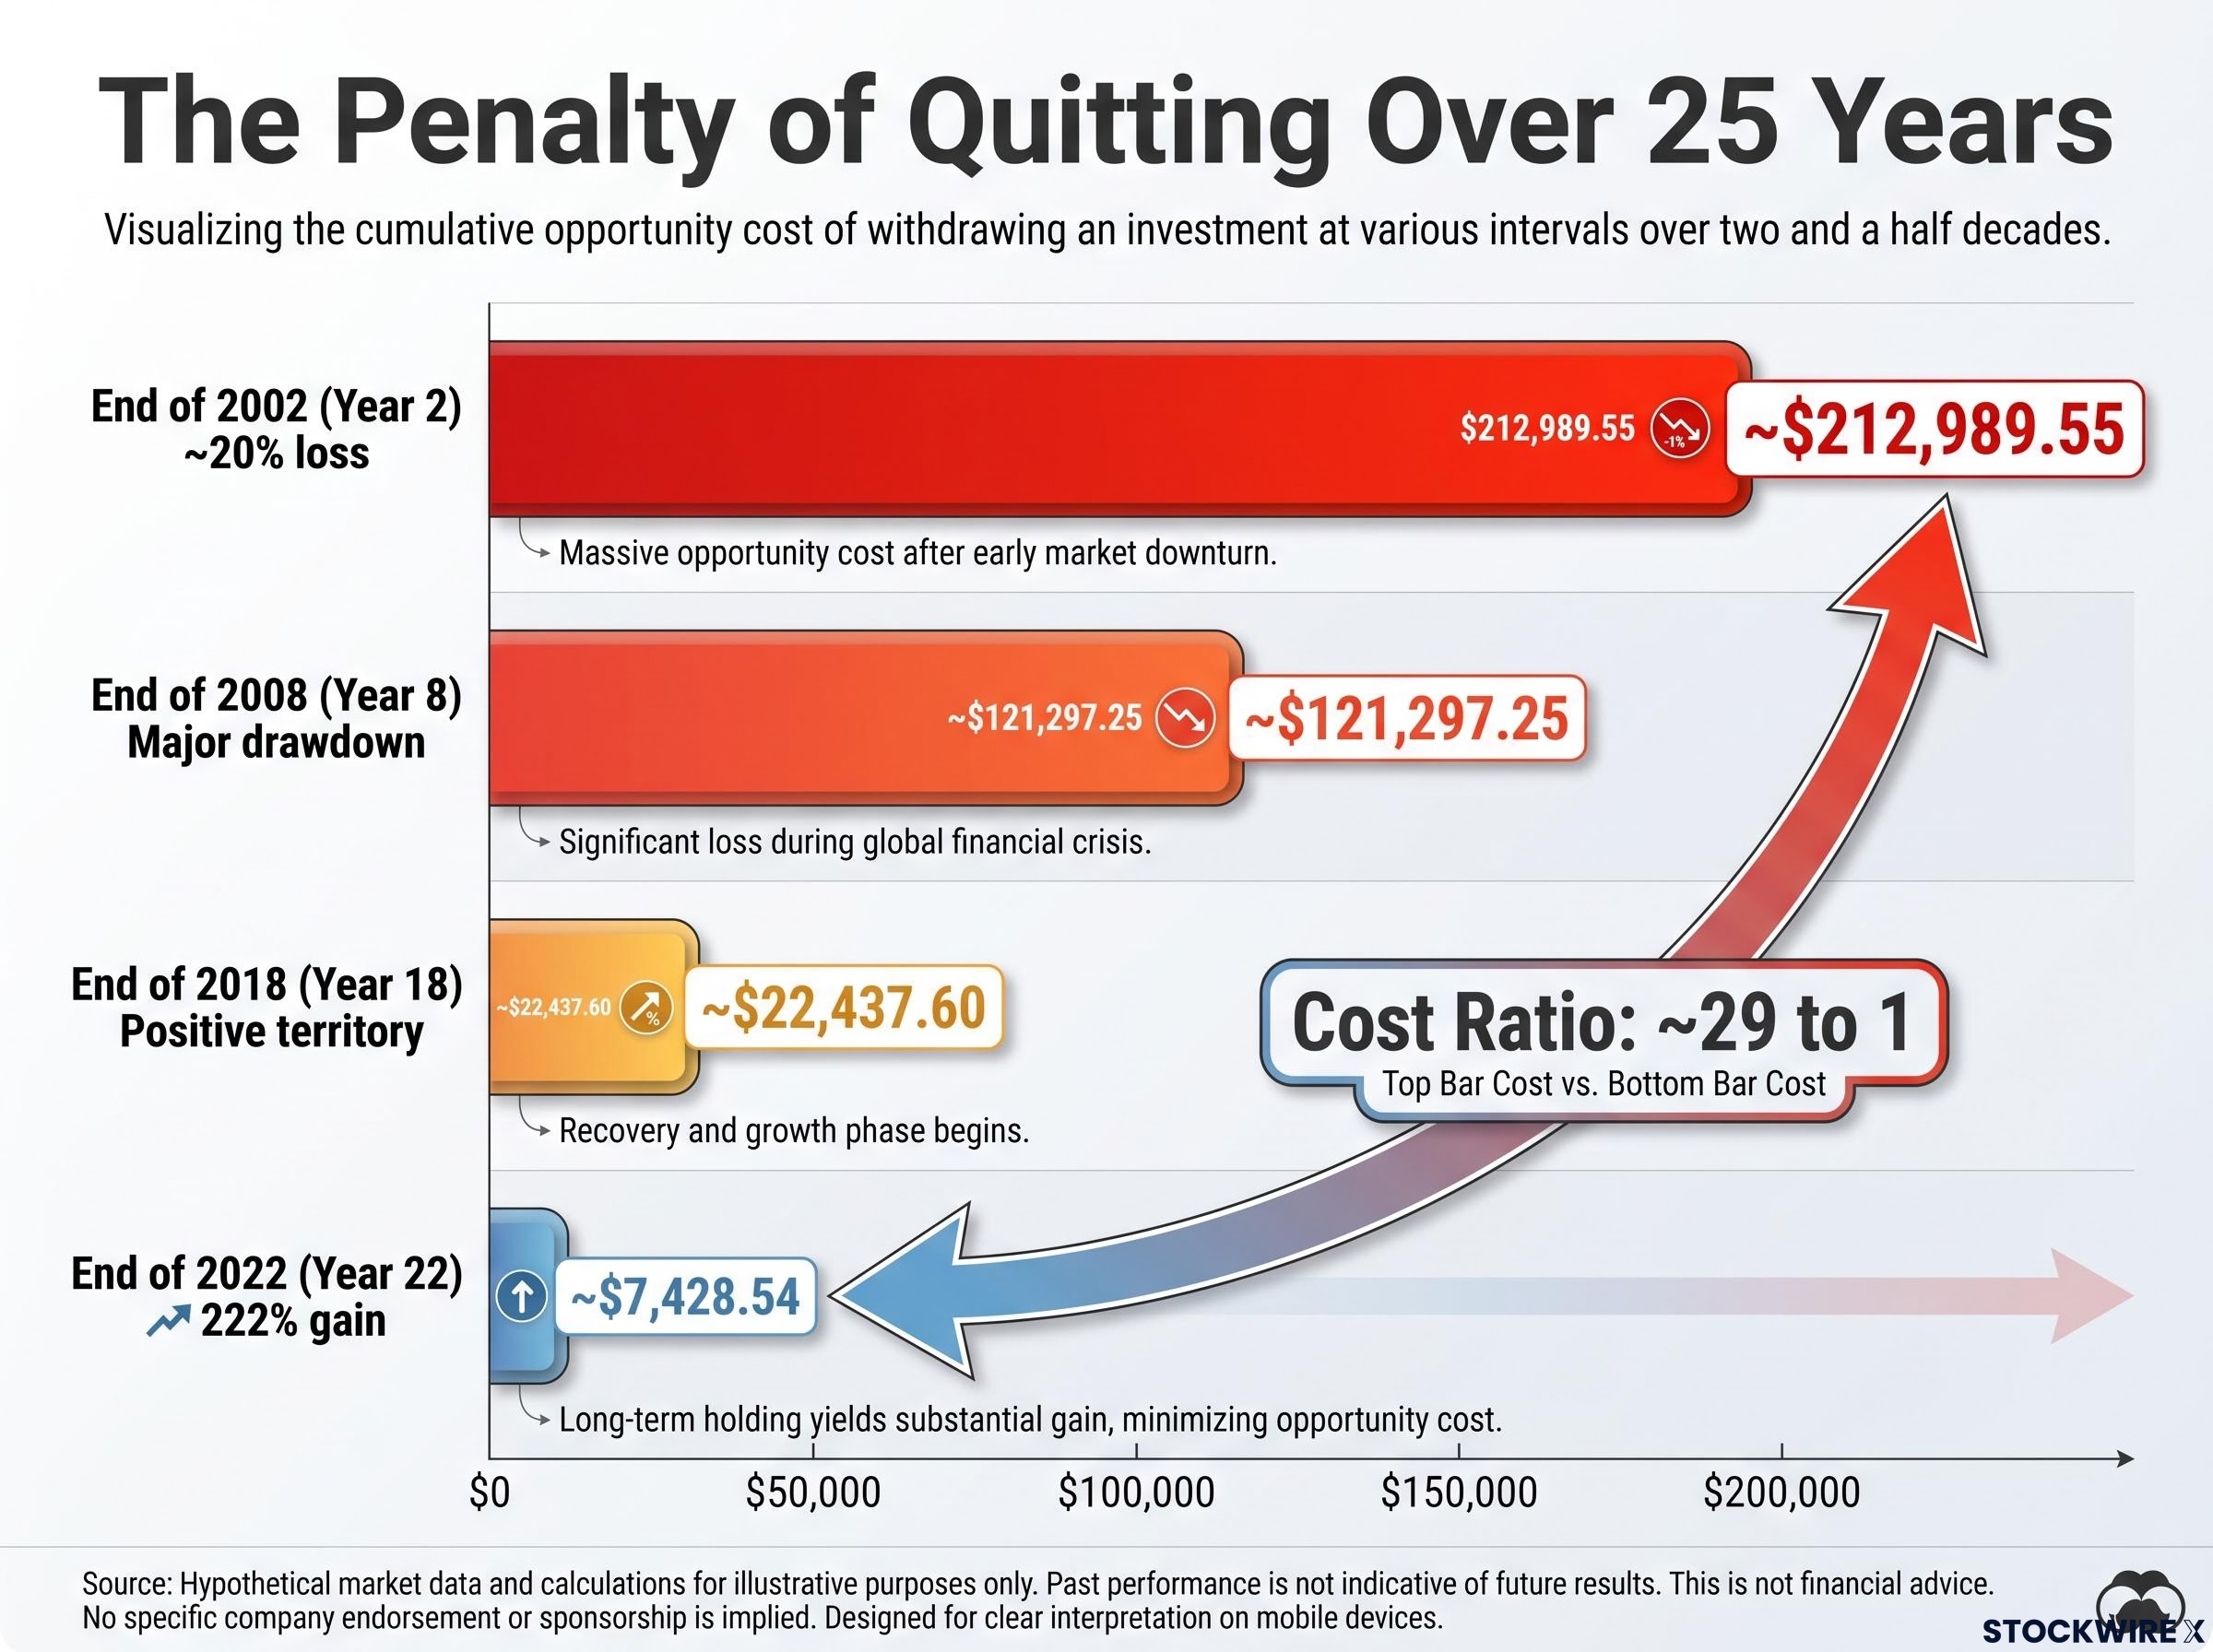
Comparing the other exit windows: stopping at the end of 2008 at the depth of a major drawdown carried a cost of approximately $121,297.25. Pausing contributions at the end of 2018, when the portfolio was in positive territory, reduced that penalty to approximately $22,437.60. And ceasing at the end of 2022, when cumulative gains stood at roughly 222%, left a gap of only approximately $7,428.54.
| Exit Point | Portfolio Condition at Exit | Projected 2025 Value | Cost vs. Continuing |
|---|---|---|---|
| End of 2002 (Year 2) | ~20% loss | ~$35,335.80 | ~$212,989.55 |
| End of 2008 (Year 8) | Major drawdown | ~$127,028.10 | ~$121,297.25 |
| End of 2018 (Year 18) | Positive territory | ~$225,887.75 | ~$22,437.60 |
| End of 2022 (Year 22) | 222% gain | ~$240,896.81 | ~$7,428.54 |
The relationship runs in a consistent inverse direction. Exit points where the case for quitting appears strongest, where the portfolio is furthest below water, attach the largest financial penalties. Exit points where the case for quitting is weakest, where accumulated gains are substantial, carry the smallest penalties.
The ratio between the cost of exiting in year 2 and the cost of exiting in year 22 is approximately 29 to 1.
That number points to something precise: the period when an investor is least inclined to trust the plan is the period that carries the steepest price for abandoning it. Peak rational justification for exiting and peak financial penalty for exiting tend to arrive together.
Why down years generated the highest contribution returns
The mechanism behind this paradox is dollar-cost averaging, which simply means investing a fixed dollar amount at regular intervals regardless of market conditions. With a fixed contribution amount rather than a fixed share quantity, each purchase naturally acquires more units when prices are lower and fewer when prices are higher.
Dollar-cost averaging operates as a behavioural protection mechanism as much as a mathematical one, removing the timing decision from each contribution cycle; research shows this matters because behavioural return drag costs investors an estimated 1.5% per annum on average, a penalty that compounds across decades and explains a significant portion of the gap between market returns and investor-captured returns.
The practical result is that falling markets increase the number of units purchased per contribution. Those extra units then capture the full benefit of the subsequent recovery. The process is built into the structure of fixed-amount investing and operates without any requirement for timing judgement, directional conviction about the market, or additional capital.
The contribution vintage data from the case study makes this concrete:
| Contribution Year | Market Condition | Growth Multiple by 2025 | Final Value |
|---|---|---|---|
| 2007 | Near market peak | 6.74× | $12,304.29 |
| 2008 | Worst annual decline since 1931 | 8.34× | $15,261.72 |
| 2001 | Early dot-com decline | 8.76× | — |
| 2002 | Trough of dot-com decline | 10.60× | — |
The money deployed during 2008, the steepest annual fall for US stocks since 1931, compounded to an 8.34× multiple by the close of 2025. That is roughly 24% ahead of the 2007 vintage, even though the 2008 contribution had one fewer year in the market. The same pattern held at the earlier trough: the 2002 vintage finished around 21% ahead of the 2001 vintage, again on less compounding time.
Across the full 25-year period, the five calendar years in which the S&P 500 posted negative returns made up 20% of all contributions but accounted for 23.8% of the portfolio’s closing balance.
Vanguard’s research on cost averaging confirms that fixed-contribution investors systematically acquire more units during market downturns, with those lower-cost vintages delivering disproportionate contributions to long-term portfolio value once markets recover.
Three structural features drive this outcome:
- Fixed-dollar contributions buy more units at lower prices
- The mechanism requires no market timing or active judgment
- Those additional units participate fully in recovery-phase gains
Seen through this lens, a declining portfolio is not signalling that the plan has broken down. For a fixed-contribution investor, it is signalling that the contributions being made right now are likely to rank among the most valuable in the entire investment timeline.
Why the logic of cutting losses breaks down in long-term equity markets
Cutting losses is genuinely rational in most contexts. Exiting a failing business, stopping a non-working project, or redirecting capital from a structurally broken asset are all sound decisions. The heuristic works because in most domains, continued losses signal continued failure.
The invisible loss problem
Long-term diversified equity exposure is structurally different. A short-term price decline does not indicate structural failure; it indicates temporary repricing. The probability of loss falls sharply as holding periods extend beyond 7-8 years, meaning the “evidence of failure” that drives most exits is actually the normal noise of a system that resolves positively over longer timeframes.
The deeper problem is opportunity-cost blindness. When an investor exits, the loss they avoid is concrete: they can see the portfolio value, count the cash, and solve immediate problems with it. The growth they forfeit is counterfactual. It exists only as a comparison between two timelines, and no account statement ever displays it.
At the moment Josh converted his holdings to cash, the $121,297.25 he would ultimately forgo did not exist anywhere he could see. The figure only materialises when you hold two timelines side by side and measure the gap between them, something no account statement will ever do for you.
The money available by selling is immediate and capable of solving real problems: cash-flow gaps, debt obligations, job insecurity. Forfeited gains are probabilistic and future-dated. Under pressure, the human brain reliably prefers certain, visible relief over uncertain, invisible growth.
The reasoning pattern that serves well elsewhere, “this hasn’t worked for years, I should stop,” becomes systematically misleading in long-term investing. For you, this means that exits which feel like careful, prudent risk control are often the ones inflicting the greatest long-term financial damage. The only reliable defence is to understand this pattern clearly before the pressure arrives, because it is nearly impossible to reason through it clearly once you are inside it.
The behaviour gap: why same market, same product, different outcomes
The Ryan and Josh case functions as a near-perfect natural experiment. Both operated in the same market, using the same product, with matching contributions over eight years. The single variable that changed was whether the investor remained in the plan. One did; the other exited for understandable reasons. The gap in their eventual outcomes came to approximately $121,297.25.
This is not an isolated case. The pattern repeats at scale across the entire investor population. Financial institutions explicitly identify “moving out of long-term investments after short periods” and “attempting to time the market” as among the most common and costly investor errors. Research consistently documents a gap between the returns markets deliver and the returns the average investor actually captures, driven primarily by exit behaviour rather than product selection.
The scale of this pattern across the broader investor population is reinforced by research on investing biases at exit, where a University of Chicago study found that randomly selected sell decisions outperformed those of professional portfolio managers by up to 150 basis points annually, identifying the sell decision itself as the primary site of portfolio value destruction.
What separates investors who stay from those who exit
The distinction is less about discipline than about structural preparation. Having an emergency fund that absorbs financial shocks without touching long-term investments, and having pre-committed rules that remove the exit decision from the moment of highest stress, are the two factors that most reliably separate investors who hold from those who liquidate.
Without a liquidity buffer, even a disciplined investor can be structurally forced to exit at the worst time. Josh’s pressures match the documented real-world triggers:
- Redundancy or employer downsizing
- Liquidity shortfalls and mortgage payment stress
- Pressure from family members to seek the safety of cash
- A realised drawdown that exceeds what an investor can emotionally tolerate
- No accessible emergency reserve outside the investment account
What often separates the investor who holds from the one who exits is not superior knowledge or stronger resolve. It is circumstance. They were not pushed into a forced decision at the worst possible time. What this tells you is that the question is not “did I pick the right fund?” but “will I be in a position to stay invested when conditions are at their worst?” The answer to that question is shaped almost entirely by choices made before a crisis, not during it.
What to do before the next warning configuration appears
The warning configuration is now identifiable: large portfolio declines, universally negative economic news, persuasive advice to move to safety, and a strong rational story for stopping. When all four appear simultaneously, you are inside the highest-risk quitting window, and your instinct to exit will feel not just reasonable but obvious.
The 29-to-1 cost ratio between early and late exits tells you that the period generating the strongest logical argument for stopping is also the period where stopping extracts the largest long-term price. The finding that five negative-return years produced 23.8% of the final balance tells you that measuring a long-term equity strategy against short-term losses is a category error.
Four structural preparations determine whether you repeat Josh’s outcome or avoid it:
- Emergency fund and liquidity buffer: Ensure near-term financial shocks can be absorbed without touching long-term investments. Without this buffer, even sound long-term plans can be forced into an exit at the worst time.
- Clear time horizon with pre-committed evaluation rules: Establish upfront that a long-term equity plan will not be judged on data spanning less than 7-10 years. This removes the exit decision from the moment of maximum emotional pressure.
- Mechanical understanding of compounding and cost averaging: When you understand that downturns generate more units at lower prices, and that those units participate fully in recoveries, short-term declines become legible as inputs to future wealth rather than evidence of failure.
- Separation of product risk from market risk: If the fund or plan is structurally unsound, changing vehicles is appropriate. If the market is temporarily down, that is a normal input to a long-term equity journey. Conflating the two leads to abandoning sound strategies during their most productive accumulation phases.
Exits that carry the heaviest long-term financial cost tend to be the ones that feel most like responsible stewardship at the time. The capacity to stay invested through those moments is built in advance, through structural decisions made while conditions are still calm.
For investors wanting a structured framework for evaluating their own position, our dedicated guide to holding cash versus staying invested walks through a stage-based decision model that distinguishes disciplined optionality from a compounding penalty disguised as caution.
What the numbers actually tell you about when to trust your instinct to exit
What this case study establishes is not that you should never quit investing. It delivers a more specific and actionable finding: the cluster of conditions that most commonly drives an exit decision, extended losses, bad news on every channel, real financial strain, a coherent logical case for stopping, is the precise cluster that attaches the highest price to walking away. The 29-to-1 ratio between the year-two exit cost and the year-22 exit cost captures the paradox in a single figure. The 2008 vintage outpacing the 2007 vintage by roughly 24% shows it operating in the data. Josh’s $121,297.25 shortfall makes it personal: a loss that registered as a considered, reasonable choice, that never showed up on any statement, and that is only legible when you compare two diverging futures.
The case here is not that investors should never choose to exit. It is that when the justification for leaving feels watertight, that very feeling warrants a pause and a closer look. Ask whether the pressures driving your thinking are temporary circumstances or signs of permanent structural damage. Ask whether your emergency fund gives you a genuine choice or whether the exit is effectively forced.
The stronger your rational case for stopping feels, the more carefully it deserves scrutiny. The data consistently shows that peak conviction about exiting and peak cost of exiting tend to coincide.
For investors assessing whether current conditions resemble the warning configuration described above, our full explainer on the 2026 market outlook examines how five major asset managers are positioning through late-cycle volatility and what distinguishes a cyclical correction from a structural reversal.
What ultimately separated Josh from Ryan was not analytical skill, market insight, or personal discipline. It was whether the circumstances were in place to keep the exit decision off the table at the moment it would have been most damaging. That is something you can arrange now, while nothing feels urgent, and it is the arrangement that matters most.
This article is for informational purposes only and should not be considered financial advice. Investors should conduct their own research and consult with financial professionals before making investment decisions. Past performance does not guarantee future results. Financial projections are subject to market conditions and various risk factors.